| Param | Original file | Final file |
|---|---|---|
| Filename | modeM0/AS1A10_071T19_9000005144_35830cztM0_level2.evt | modeM0/AS1A10_071T19_9000005144_35830cztM0_level2_quad_clean.evt |
| Size (bytes) | 629,409,600 | 60,759,360 |
| Size | 600.3 MB | 57.9 MB |
| Events in quadrant A | 5,538,096 | 355,578 |
| Events in quadrant B | 2,714,228 | 416,981 |
| Events in quadrant C | 2,799,839 | 407,162 |
| Events in quadrant D | 7,645,983 | 282,849 |
| Mode M0 | |||
|---|---|---|---|
| Quadrant | BADHDUFLAG | Total packets | Discarded packets |
| A | 0 | 20016 | 3 |
| B | 0 | 11531 | 2 |
| C | 0 | 11557 | 2 |
| D | 0 | 26236 | 2 |
| Mode M9 | |||
|---|---|---|---|
| Quadrant | BADHDUFLAG | Total packets | Discarded packets |
| A | 0 | 25 | 0 |
| B | 0 | 25 | 0 |
| C | 0 | 25 | 0 |
| D | 0 | 26 | 0 |
| Mode SS | |||
|---|---|---|---|
| Quadrant | BADHDUFLAG | Total packets | Discarded packets |
| A | 0 | 110 | 0 |
| B | 0 | 110 | 0 |
| C | 0 | 110 | 0 |
| D | 0 | 110 | 0 |
| Quadrant | Total seconds | Saturated seconds | Saturation percentage |
|---|---|---|---|
| A | 5368 | 987 | 18.386736% |
| B | 5368 | 31 | 0.577496% |
| C | 5368 | 68 | 1.266766% |
| D | 5368 | 2065 | 38.468703% |
Noise dominated data is calculated using 1-second bins in cleaned event files. If a bin has >2000 counts, and if more than 50% of those come from <1% of pixels, then it is considered to be noise-dominated and hence unusable.
| Quadrant | # 1 sec bins | Bins with >0 counts | Bins with >2000 counts | High rate bins dominated by noise | Noise dominated (total time) | Noise dominated (detector-on time) | Marked lightcurve |
|---|---|---|---|---|---|---|---|
| A | 7041 | 5369 | 967 | 967 | 13.73% | 18.01% | 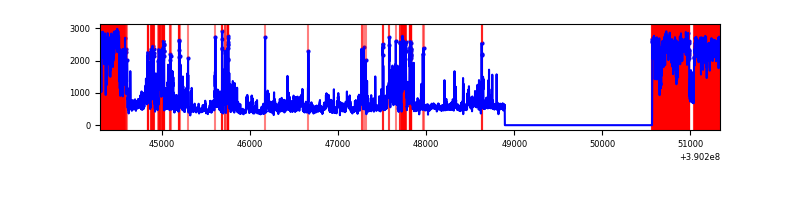 |
| B | 7040 | 5368 | 11 | 11 | 0.16% | 0.20% | 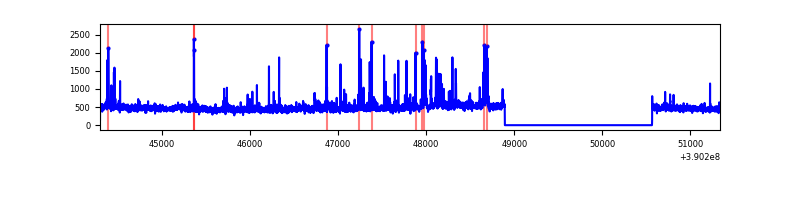 |
| C | 7040 | 5368 | 60 | 60 | 0.85% | 1.12% | 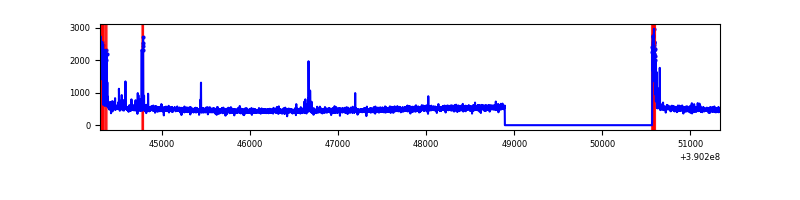 |
| D | 7041 | 5369 | 2088 | 2088 | 29.65% | 38.89% | 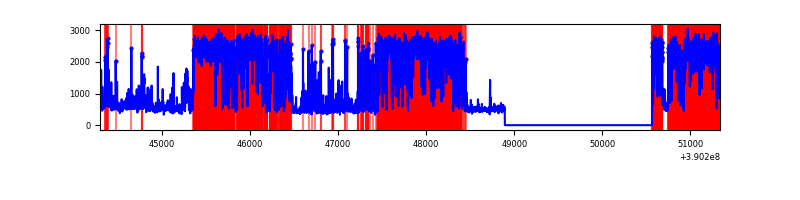 |
Top three noisy pixels from each quadrant. If the there are fewer than three noisy pixels in the level2.evt file, extra rows are filled as -1
| Pixel properties | Quadrant properties | ||||||
|---|---|---|---|---|---|---|---|
| Quadrant | DetID | PixID | Counts | Sigma | Mean | Median | Sigma |
| A | 15 | 169 | 3120230 | 26907.53 | 577 | 566 | 115.9 |
| A | 10 | 83 | 126154 | 1083.21 | 577 | 566 | 115.9 |
| A | 13 | 6 | 41299 | 351.33 | 577 | 566 | 115.9 |
| B | 5 | 255 | 138049 | 1159.79 | 615 | 600 | 118.5 |
| B | 5 | 172 | 91479 | 766.83 | 615 | 600 | 118.5 |
| B | 4 | 232 | 20756 | 170.08 | 615 | 600 | 118.5 |
| C | 15 | 214 | 225605 | 1593.02 | 601 | 606 | 141.2 |
| C | 0 | 10 | 187702 | 1324.66 | 601 | 606 | 141.2 |
| C | 0 | 207 | 46481 | 324.8 | 601 | 606 | 141.2 |
| D | 2 | 250 | 3267742 | 27533.46 | 481 | 467 | 118.7 |
| D | 7 | 223 | 2159677 | 18195.75 | 481 | 467 | 118.7 |
| D | 13 | 249 | 135852 | 1140.9 | 481 | 467 | 118.7 |
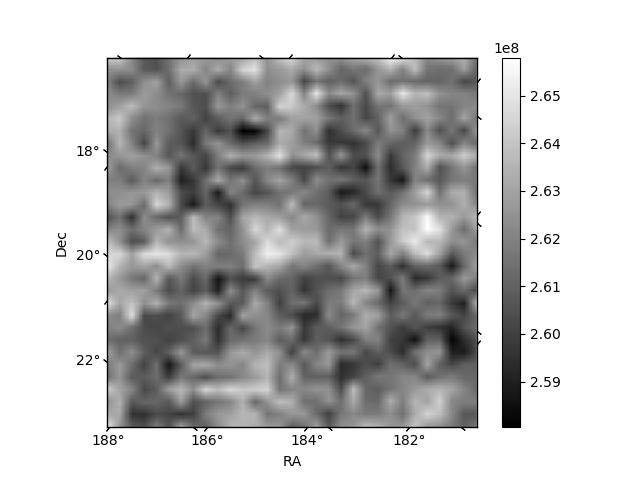
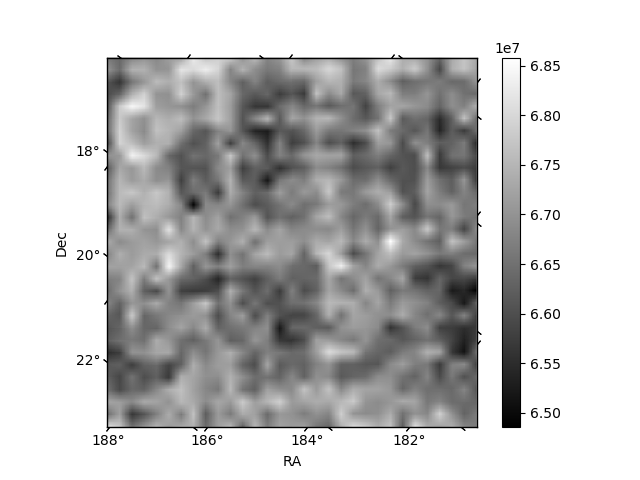
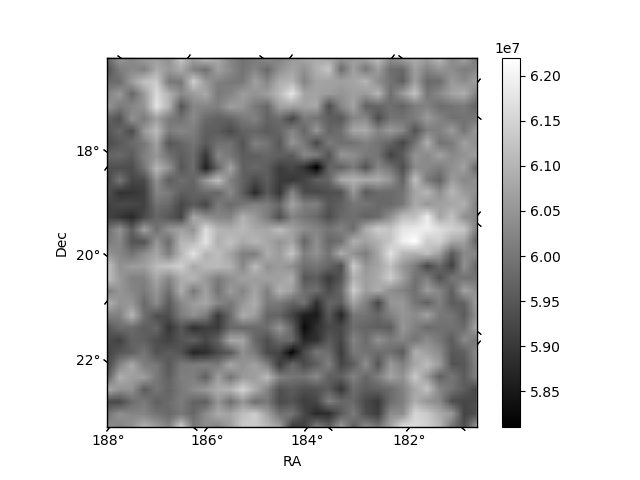
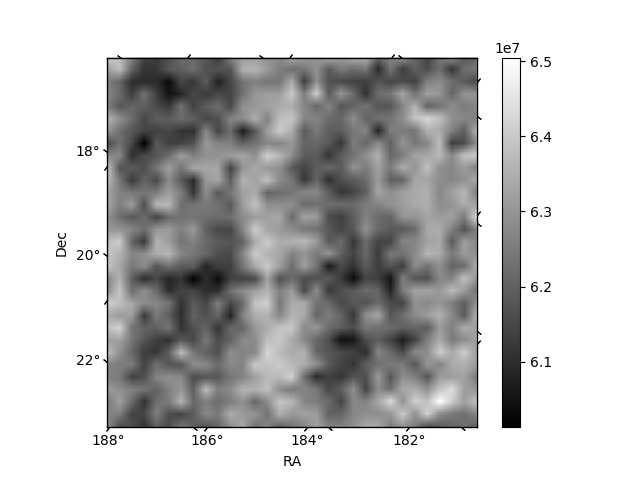
Histogram calculated using DETX and DETY for each event in the final _common_clean file
| Quadrant A | 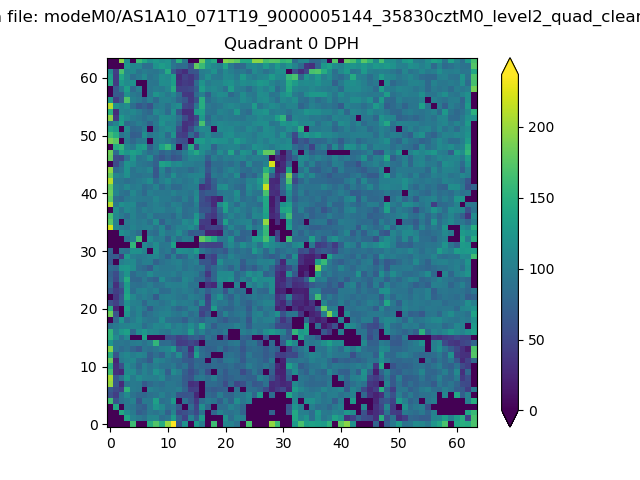 |
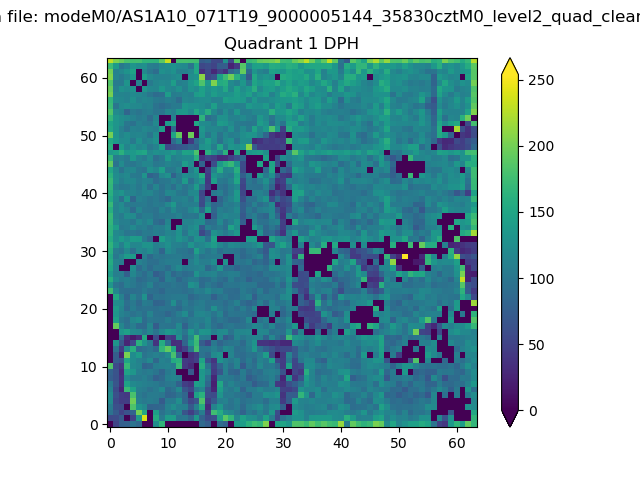 |
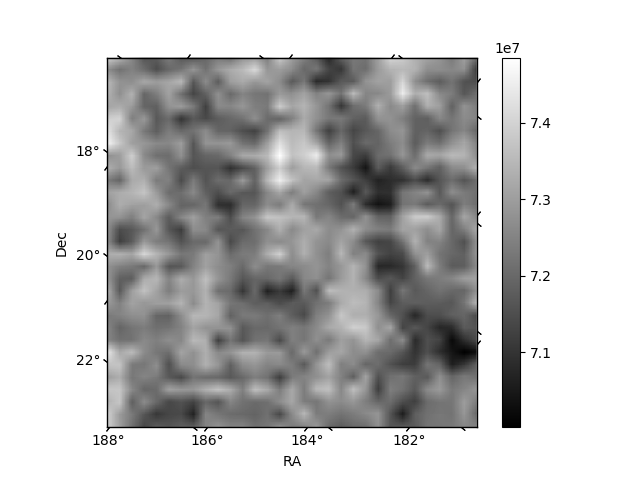
Quadrant B |
|---|---|---|---|
| Quadrant D | 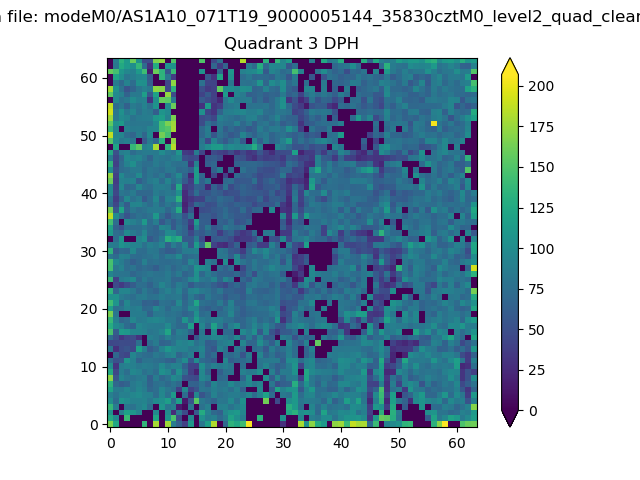 |
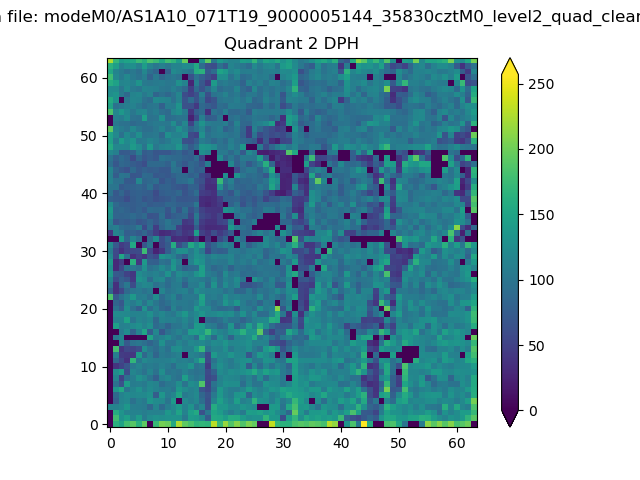 |
Quadrant C |
| Plot type | Count rate plots | Images |
|---|---|---|
| Comparison with Poisson distribution Blue bars denote a histogram of data divided into 1 sec bins. Red curve is a Poisson curve with rate = median count rate of data. |
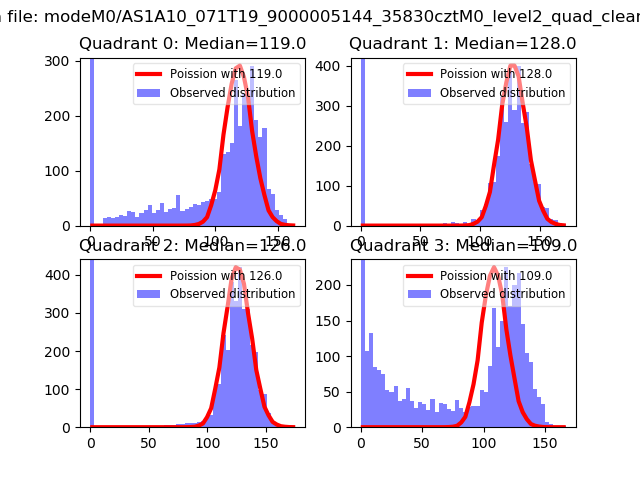 |
 |
| Quadrant-wise count rates Data is divided into 100 sec bins |
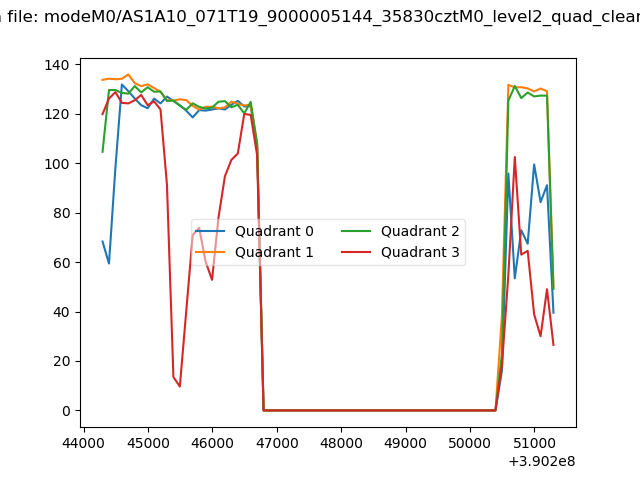 |
|
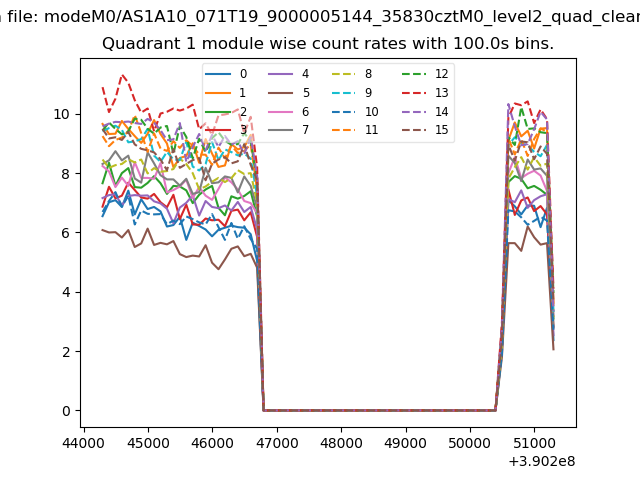
| Module-wise count rates for Quadrant A Data is divided into 100 sec bins |
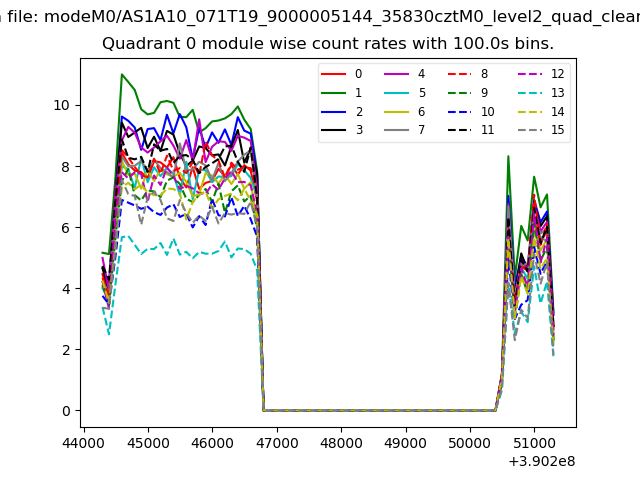 |
 |
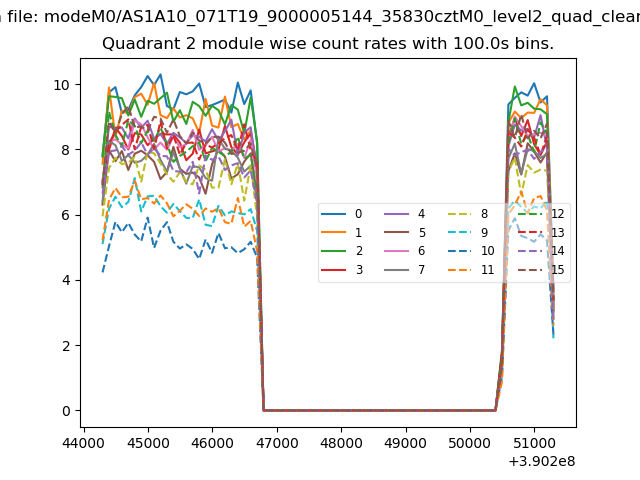
| Module-wise count rates for Quadrant B Data is divided into 100 sec bins |
 |
 |
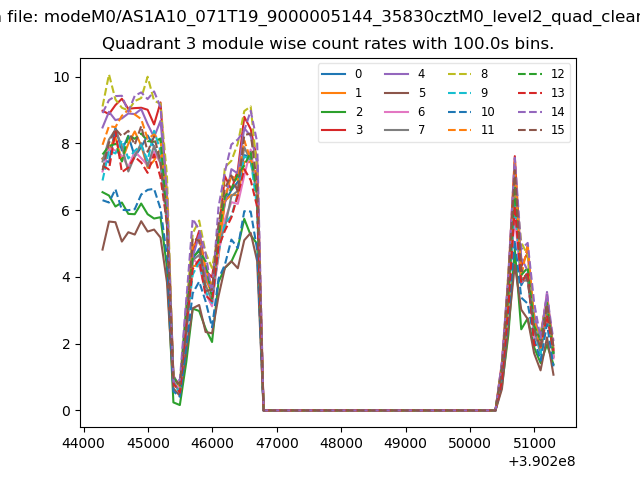
| Module-wise count rates for Quadrant C Data is divided into 100 sec bins |
 |
 |
| Module-wise count rates for Quadrant D Data is divided into 100 sec bins |
 |
 |
| Parameter | Plot |
|---|---|
| CZT HV Monitor | 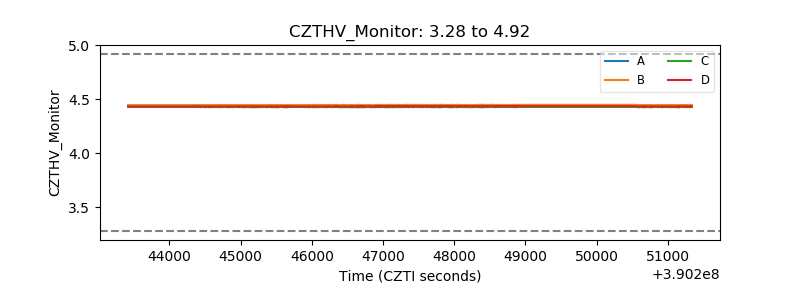 |
| D_VDD | 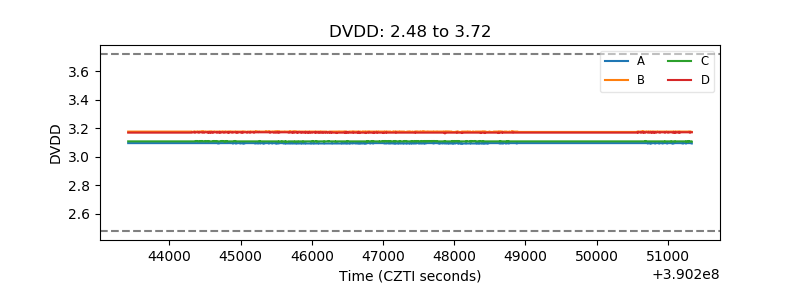 |
| Temperature 1 | 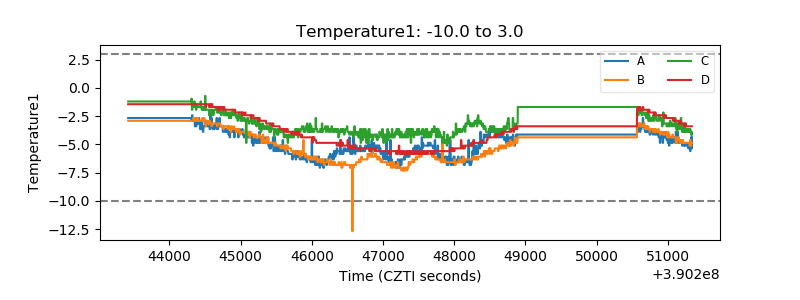 |
| Veto HV Monitor | 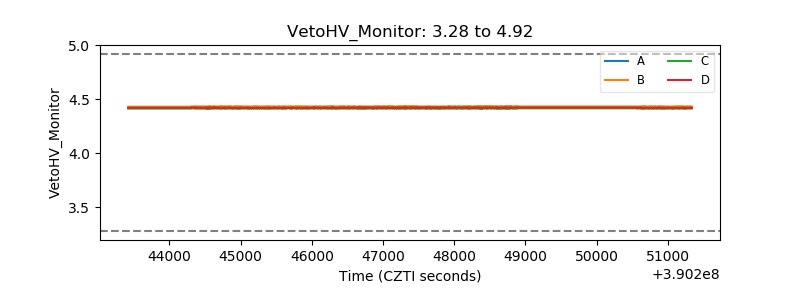 |
| Veto LLD | 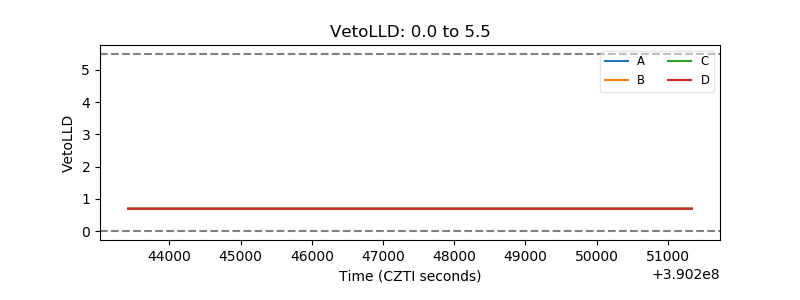 |
| Alpha Counter | 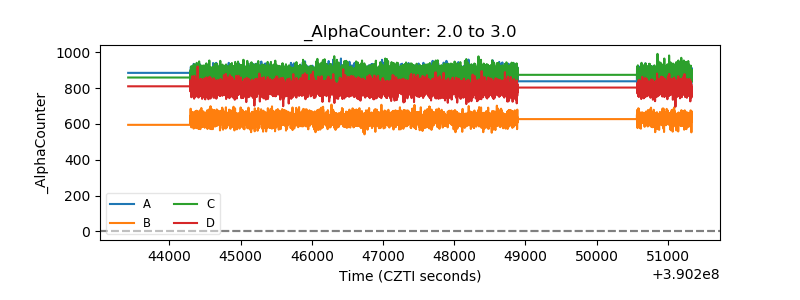 |
| _CPM_Rate | 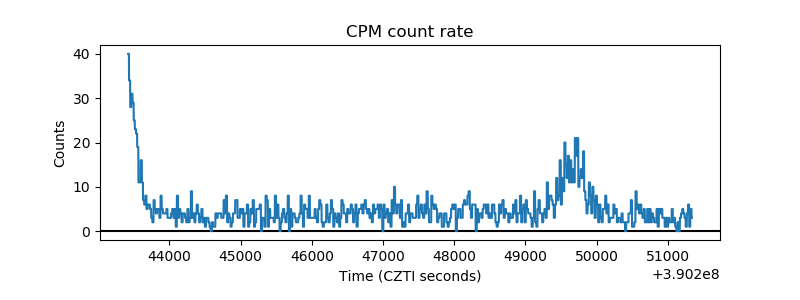 |
| CZT Counter | 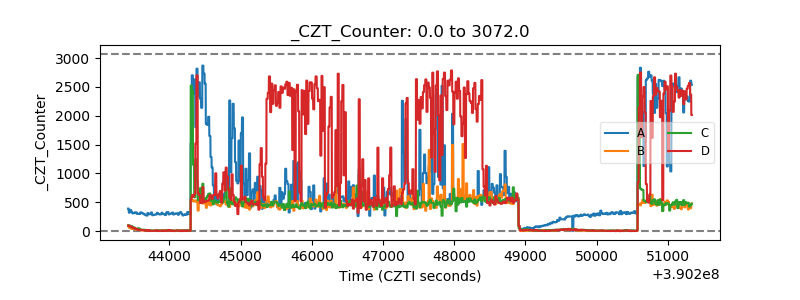 |
| +2.5 Volts monitor | 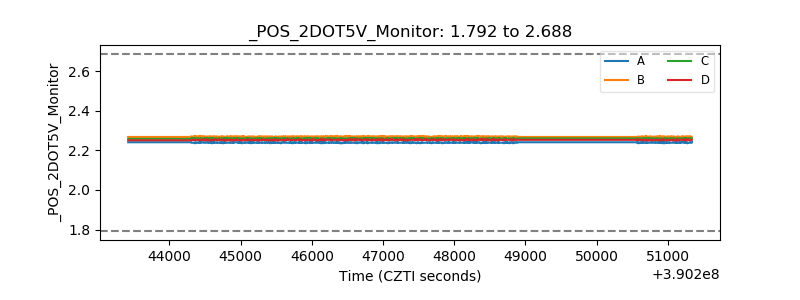 |
| +5 Volts monitor | 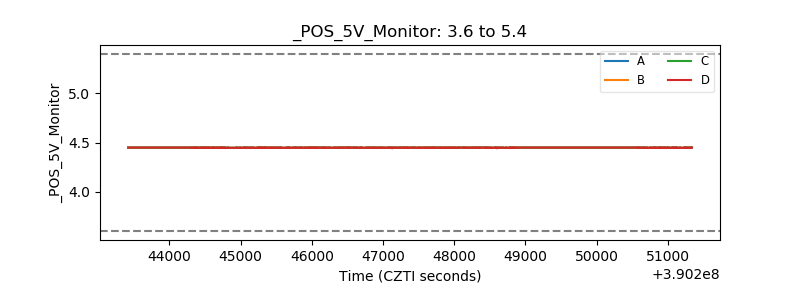 |
| _ROLL_ROT | 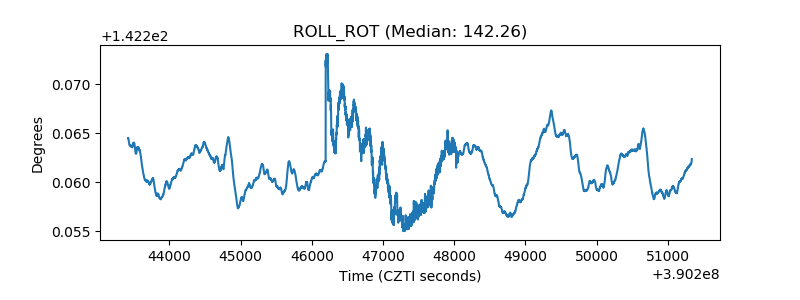 |
| _Roll_DEC | 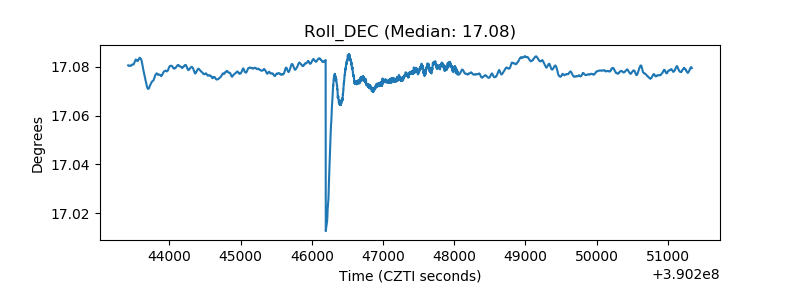 |
| _Roll_RA | 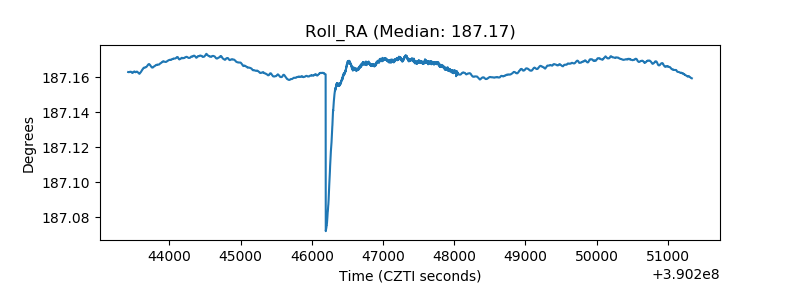 |
| Veto Counter | 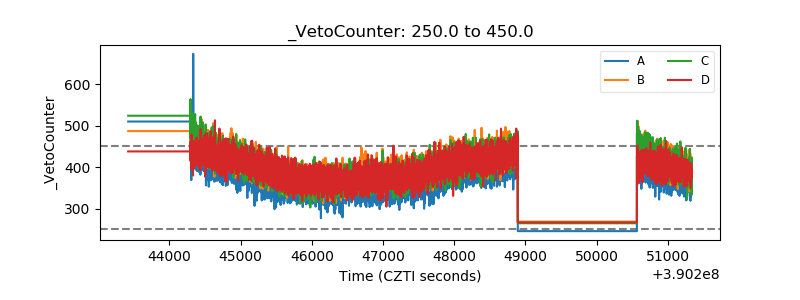 |