| Param | Original file | Final file |
|---|---|---|
| Filename | modeM0/AS1A10_071T19_9000005144cztM0_level2_bc.evt | modeM0/AS1A10_071T19_9000005144cztM0_level2_quad_clean.evt |
| Size (bytes) | 1,972,290,240 | 499,921,920 |
| Size | 1.8 GB | 476.8 MB |
| Events in quadrant A | 18,540,003 | 3,011,839 |
| Events in quadrant B | 10,706,535 | 3,346,927 |
| Events in quadrant C | 10,087,186 | 3,287,934 |
| Events in quadrant D | 17,867,390 | 2,943,935 |
| Mode M0 | |||
|---|---|---|---|
| Quadrant | BADHDUFLAG | Total packets | Discarded packets |
| A | 0 | 129510 | 0 |
| B | 0 | 86841 | 0 |
| C | 0 | 80610 | 0 |
| D | 0 | 122322 | 0 |
| Mode M9 | |||
|---|---|---|---|
| Quadrant | BADHDUFLAG | Total packets | Discarded packets |
| A | 0 | 157 | 0 |
| B | 0 | 157 | 0 |
| C | 0 | 157 | 0 |
| D | 0 | 157 | 0 |
| Mode SS | |||
|---|---|---|---|
| Quadrant | BADHDUFLAG | Total packets | Discarded packets |
| A | 0 | 760 | 0 |
| B | 0 | 760 | 0 |
| C | 0 | 760 | 0 |
| D | 0 | 760 | 0 |
| Quadrant | Total seconds | Saturated seconds | Saturation percentage |
|---|---|---|---|
| A | 37099 | 6638 | 17.892666% |
| B | 37098 | 751 | 2.024368% |
| C | 37099 | 373 | 1.005418% |
| D | 37098 | 4368 | 11.774220% |
Noise dominated data is calculated using 1-second bins in cleaned event files. If a bin has >2000 counts, and if more than 50% of those come from <1% of pixels, then it is considered to be noise-dominated and hence unusable.
| Quadrant | # 1 sec bins | Bins with >0 counts | Bins with >2000 counts | High rate bins dominated by noise | Noise dominated (total time) | Noise dominated (detector-on time) | Marked lightcurve |
|---|---|---|---|---|---|---|---|
| A | 51084 | 37107 | 366 | 366 | 0.72% | 0.99% | 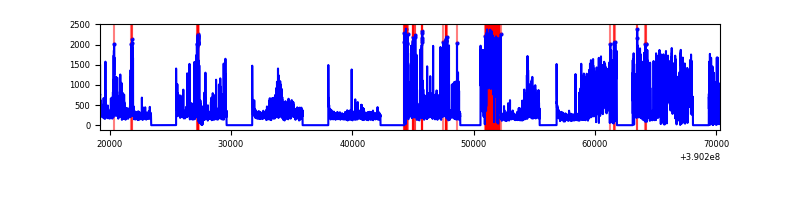 |
| B | 51083 | 37097 | 86 | 86 | 0.17% | 0.23% | 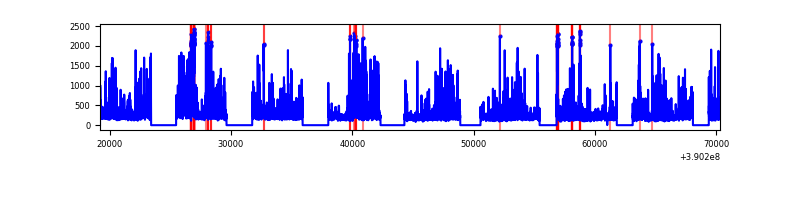 |
| C | 51083 | 37100 | 31 | 31 | 0.06% | 0.08% | 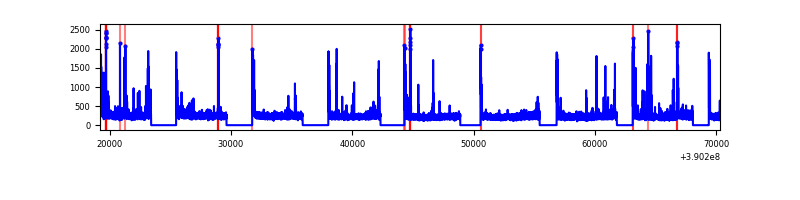 |
| D | 51083 | 37093 | 107 | 107 | 0.21% | 0.29% | 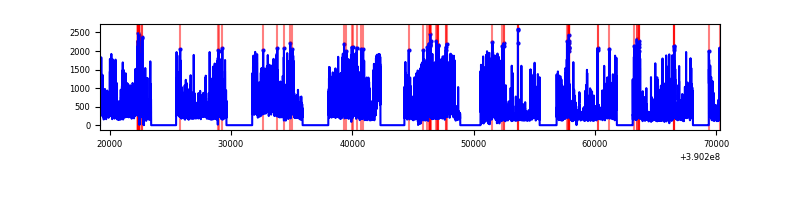 |
Top three noisy pixels from each quadrant. If the there are fewer than three noisy pixels in the level2.evt file, extra rows are filled as -1
| Pixel properties | Quadrant properties | ||||||
|---|---|---|---|---|---|---|---|
| Quadrant | DetID | PixID | Counts | Sigma | Mean | Median | Sigma |
| A | 15 | 169 | 10581262 | 26418.7 | 1820 | 1794 | 400.5 |
| A | 10 | 83 | 738839 | 1840.52 | 1820 | 1794 | 400.5 |
| A | 13 | 6 | 105775 | 259.66 | 1820 | 1794 | 400.5 |
| B | 5 | 172 | 1452685 | 3759.23 | 1978 | 1942 | 385.9 |
| B | 5 | 255 | 720881 | 1862.95 | 1978 | 1942 | 385.9 |
| B | 4 | 232 | 245771 | 631.82 | 1978 | 1942 | 385.9 |
| C | 15 | 214 | 1464610 | 3290.34 | 1929 | 1912 | 444.5 |
| C | 0 | 10 | 670640 | 1504.3 | 1929 | 1912 | 444.5 |
| C | 0 | 207 | 332347 | 743.31 | 1929 | 1912 | 444.5 |
| D | 2 | 250 | 3587109 | 8164.98 | 1851 | 1798 | 439.1 |
| D | 7 | 223 | 3285473 | 7478.05 | 1851 | 1798 | 439.1 |
| D | 13 | 249 | 964571 | 2192.56 | 1851 | 1798 | 439.1 |
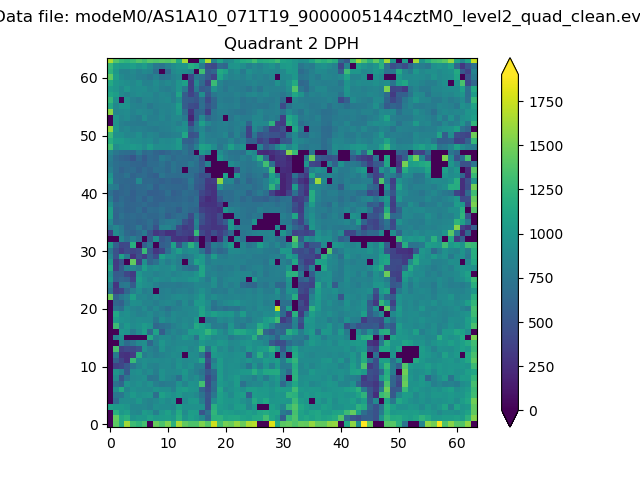
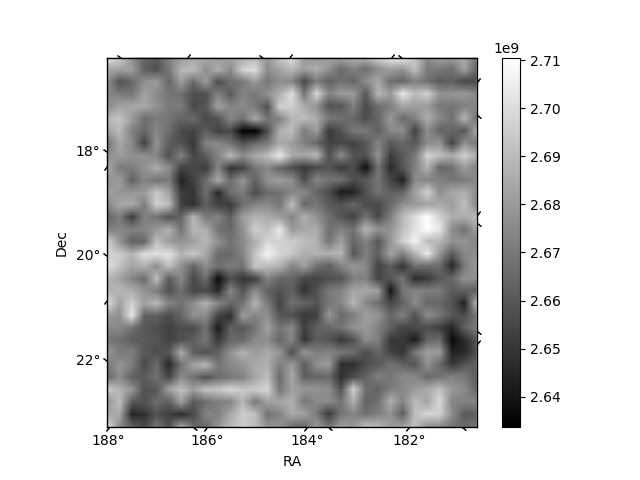
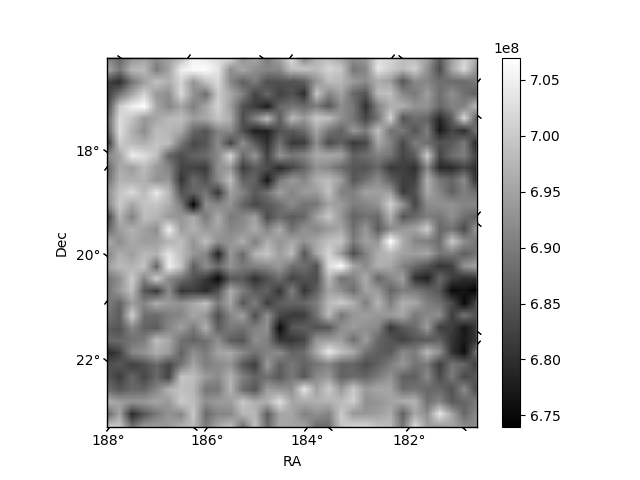
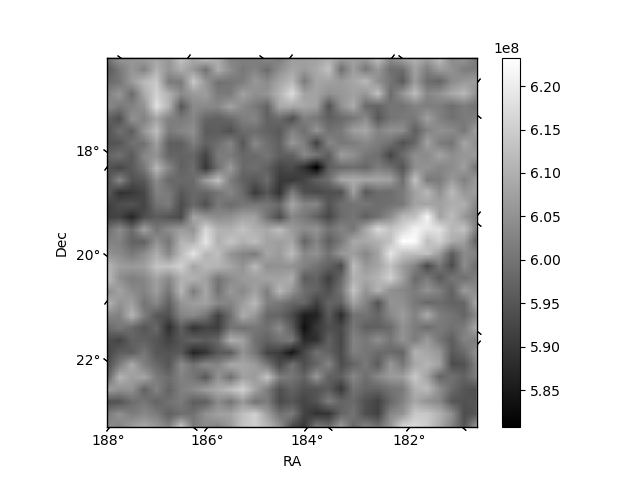
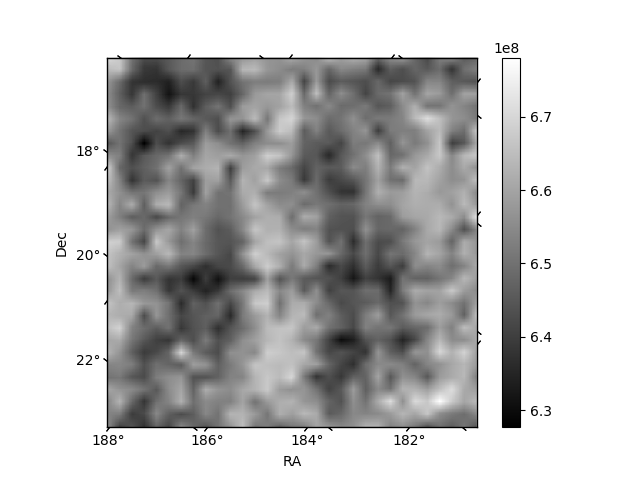
Histogram calculated using DETX and DETY for each event in the final _common_clean file
| Quadrant A | 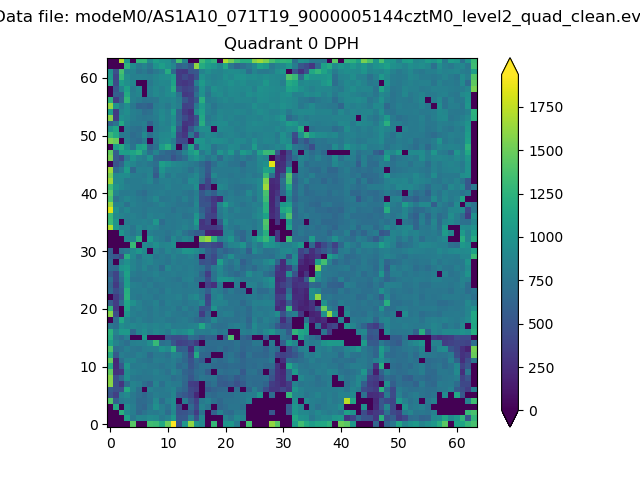 |
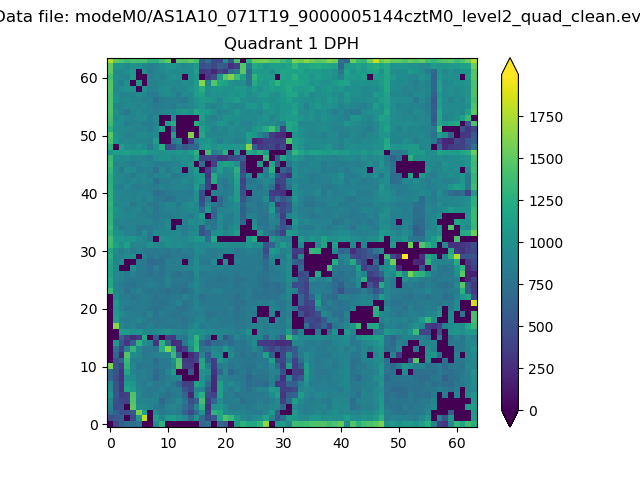 |
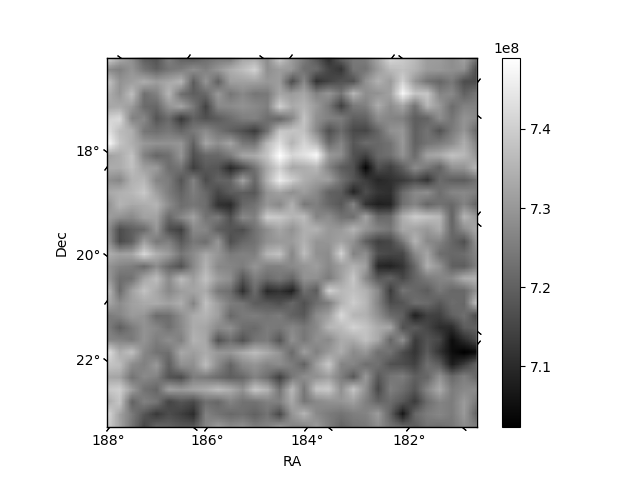
Quadrant B |
|---|---|---|---|
| Quadrant D | 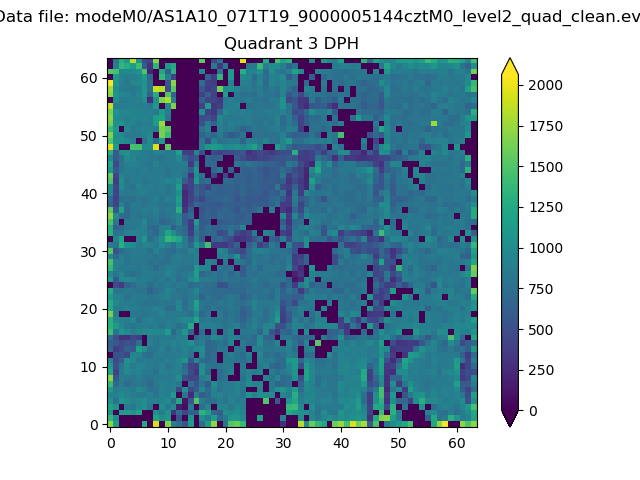 |
 |
Quadrant C |
| Plot type | Count rate plots | Images |
|---|---|---|
| Comparison with Poisson distribution Blue bars denote a histogram of data divided into 1 sec bins. Red curve is a Poisson curve with rate = median count rate of data. |
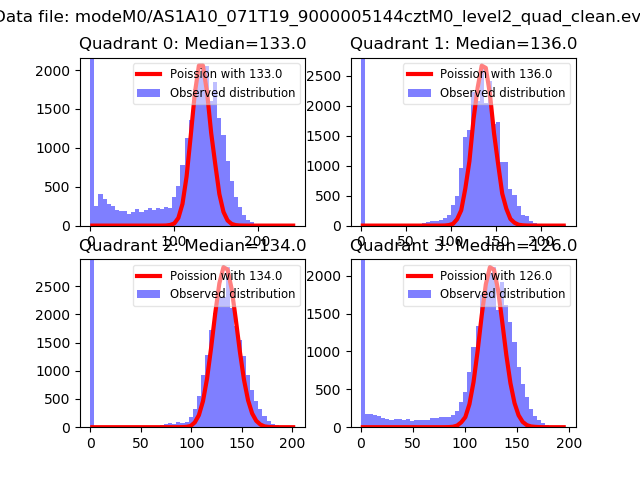 |
 |
| Quadrant-wise count rates Data is divided into 100 sec bins |
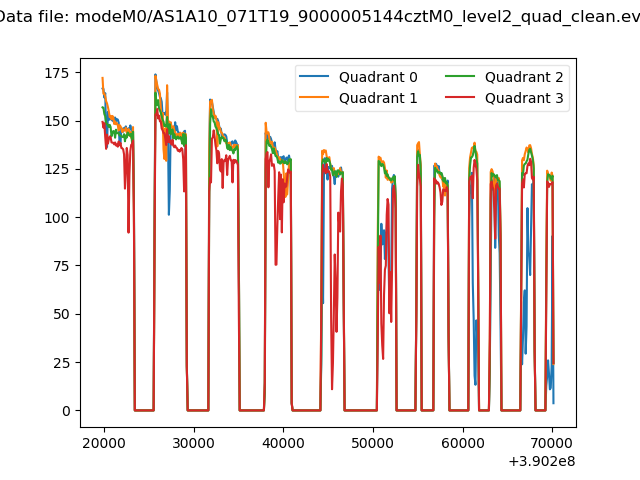 |
|
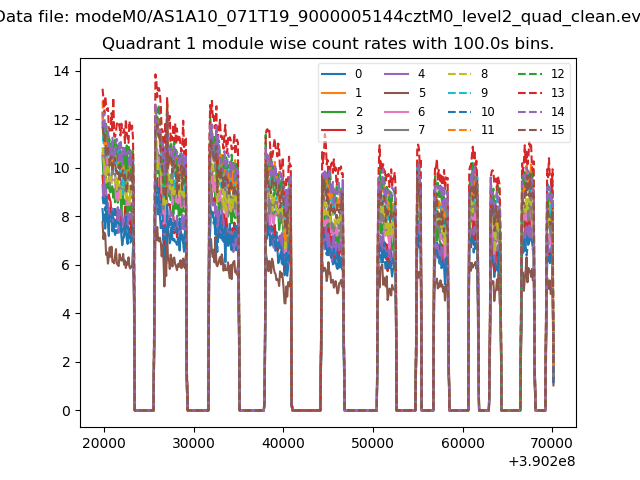
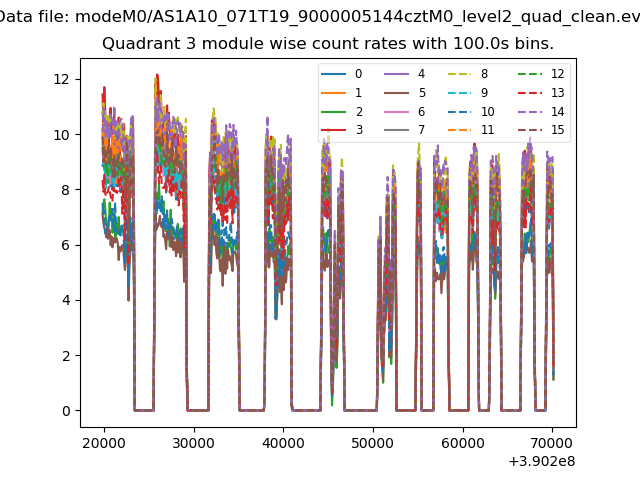
| Module-wise count rates for Quadrant A Data is divided into 100 sec bins |
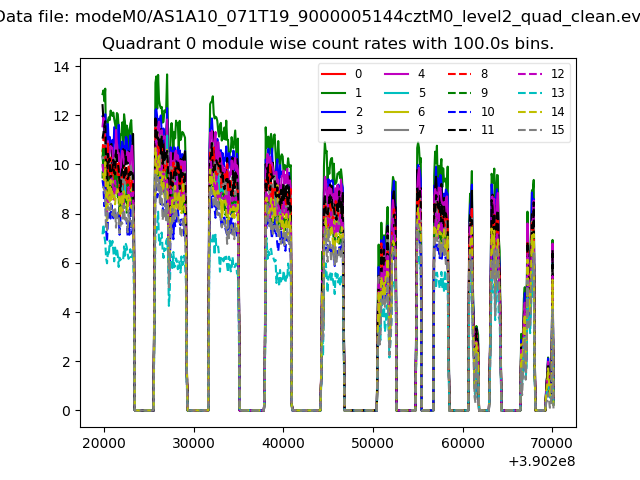 |
 |
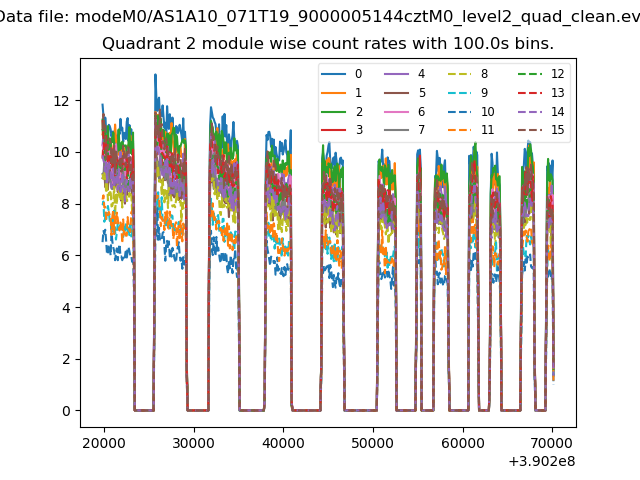
| Module-wise count rates for Quadrant B Data is divided into 100 sec bins |
 |
 |
| Module-wise count rates for Quadrant C Data is divided into 100 sec bins |
 |
 |
| Module-wise count rates for Quadrant D Data is divided into 100 sec bins |
 |
 |
| Parameter | Plot |
|---|---|
| CZT HV Monitor | 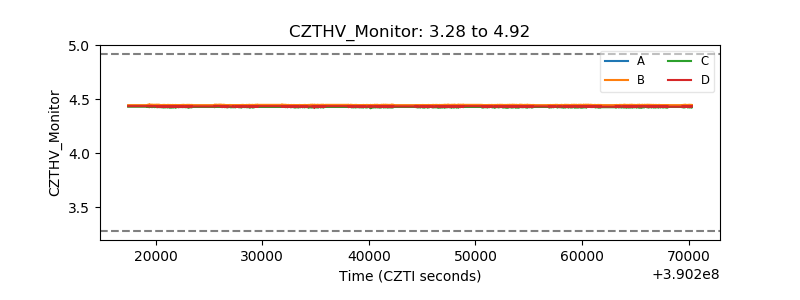 |
| D_VDD | 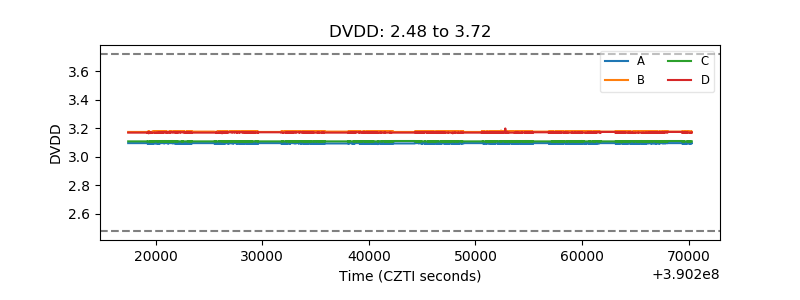 |
| Temperature 1 | 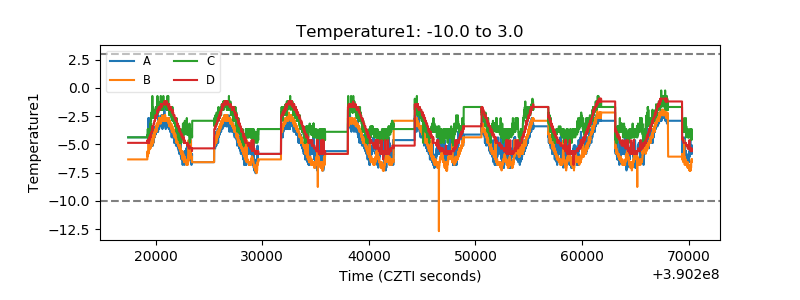 |
| Veto HV Monitor | 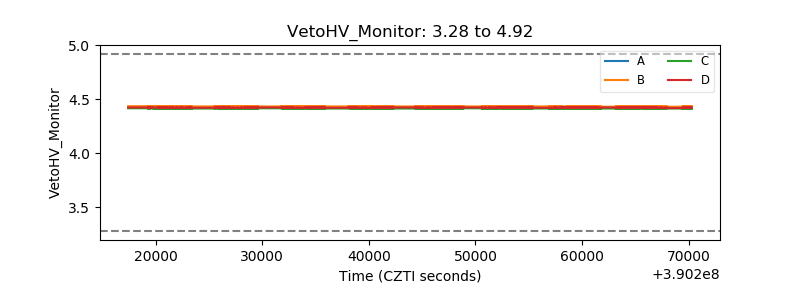 |
| Veto LLD | 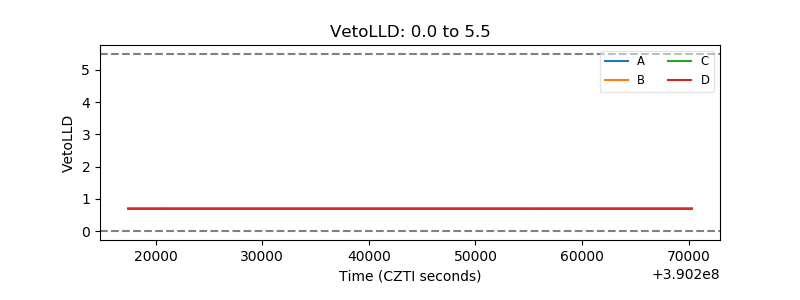 |
| Alpha Counter | 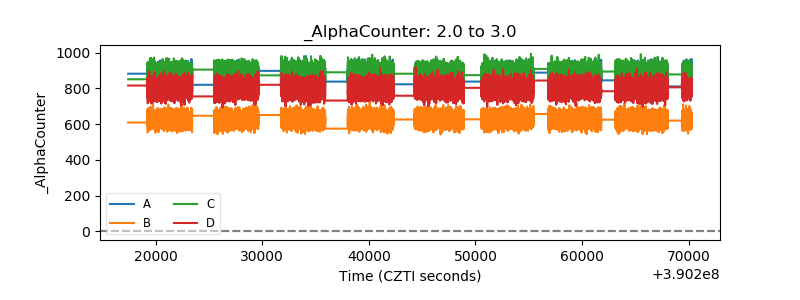 |
| _CPM_Rate | 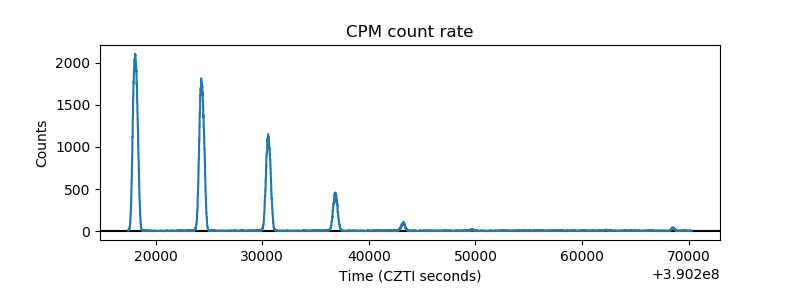 |
| CZT Counter | 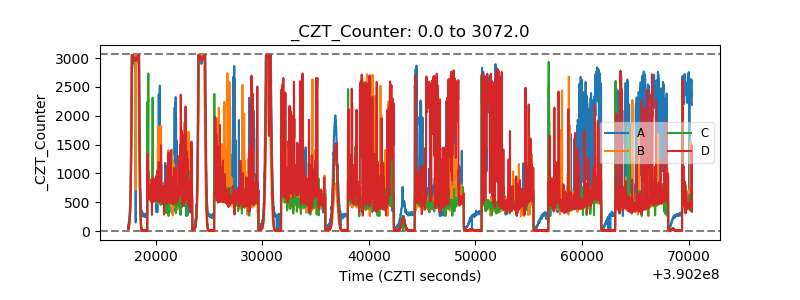 |
| +2.5 Volts monitor | 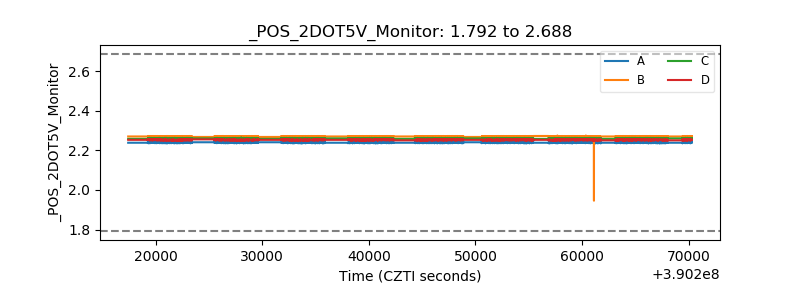 |
| +5 Volts monitor | 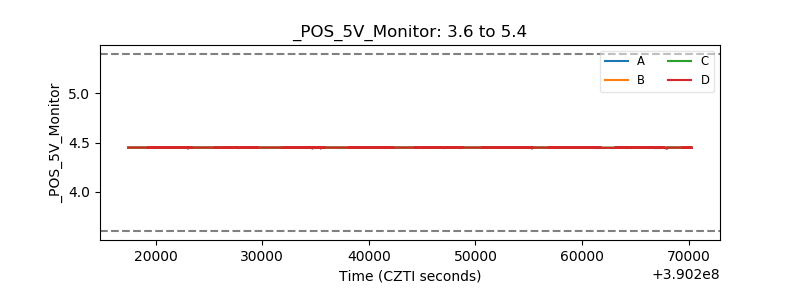 |
| _ROLL_ROT | 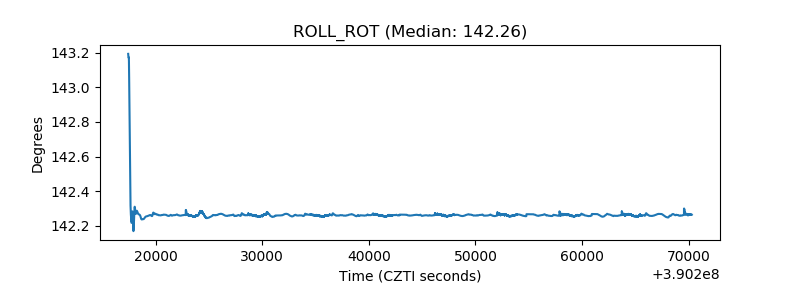 |
| _Roll_DEC | 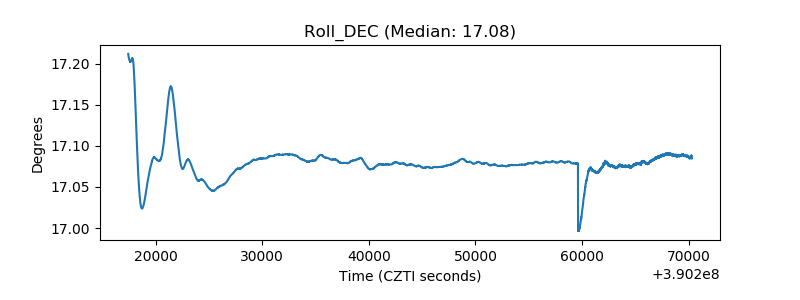 |
| _Roll_RA | 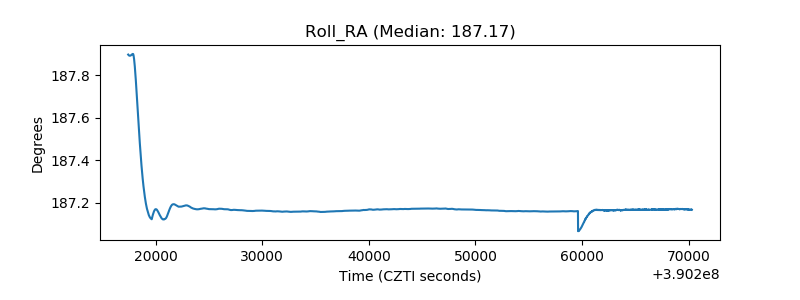 |
| Veto Counter | 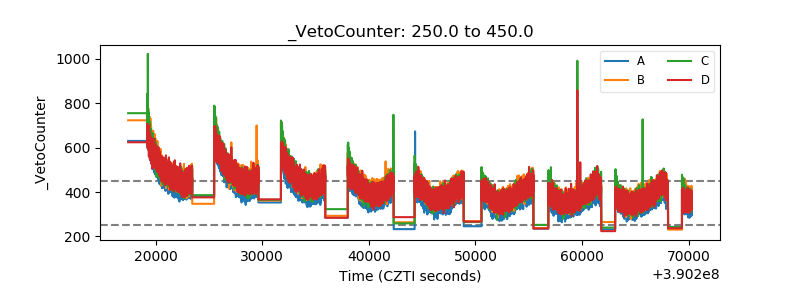 |