| Param | Original file | Final file |
|---|---|---|
| Filename | modeM0/AS1A09_146T01_9000005142_35822cztM0_level2.evt | modeM0/AS1A09_146T01_9000005142_35822cztM0_level2_quad_clean.evt |
| Size (bytes) | 536,045,760 | 58,055,040 |
| Size | 511.2 MB | 55.4 MB |
| Events in quadrant A | 5,731,967 | 289,419 |
| Events in quadrant B | 3,066,505 | 378,333 |
| Events in quadrant C | 2,885,752 | 370,343 |
| Events in quadrant D | 4,180,060 | 337,193 |
| Mode SS | |||
|---|---|---|---|
| Quadrant | BADHDUFLAG | Total packets | Discarded packets |
| A | 0 | 112 | 0 |
| B | 0 | 112 | 0 |
| C | 0 | 112 | 0 |
| D | 0 | 112 | 0 |
| Mode M0 | |||
|---|---|---|---|
| Quadrant | BADHDUFLAG | Total packets | Discarded packets |
| A | 0 | 20595 | 3 |
| B | 0 | 12522 | 2 |
| C | 0 | 11692 | 2 |
| D | 0 | 16057 | 2 |
| Mode M9 | |||
|---|---|---|---|
| Quadrant | BADHDUFLAG | Total packets | Discarded packets |
| A | 0 | 25 | 0 |
| B | 0 | 25 | 0 |
| C | 0 | 25 | 0 |
| D | 0 | 26 | 0 |
| Quadrant | Total seconds | Saturated seconds | Saturation percentage |
|---|---|---|---|
| A | 5450 | 1219 | 22.366972% |
| B | 5450 | 79 | 1.449541% |
| C | 5450 | 46 | 0.844037% |
| D | 5450 | 427 | 7.834862% |
Noise dominated data is calculated using 1-second bins in cleaned event files. If a bin has >2000 counts, and if more than 50% of those come from <1% of pixels, then it is considered to be noise-dominated and hence unusable.
| Quadrant | # 1 sec bins | Bins with >0 counts | Bins with >2000 counts | High rate bins dominated by noise | Noise dominated (total time) | Noise dominated (detector-on time) | Marked lightcurve |
|---|---|---|---|---|---|---|---|
| A | 7153 | 5450 | 1078 | 1078 | 15.07% | 19.78% | 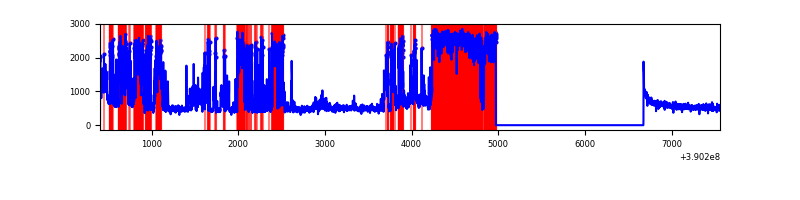 |
| B | 7153 | 5451 | 38 | 38 | 0.53% | 0.70% | 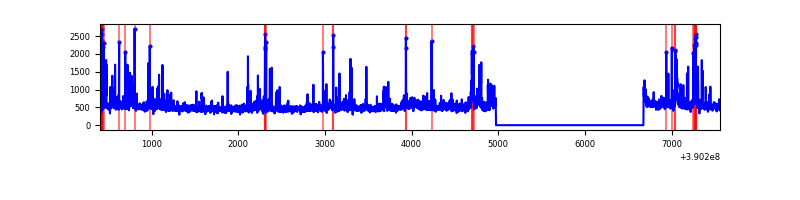 |
| C | 7153 | 5451 | 35 | 35 | 0.49% | 0.64% | 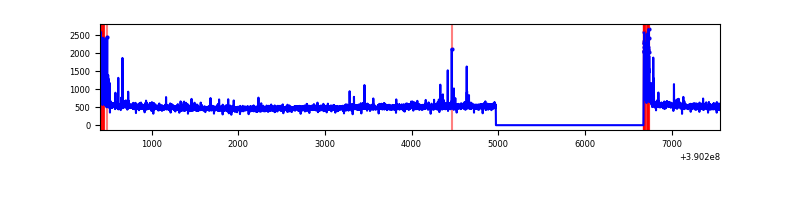 |
| D | 7153 | 5451 | 233 | 233 | 3.26% | 4.27% | 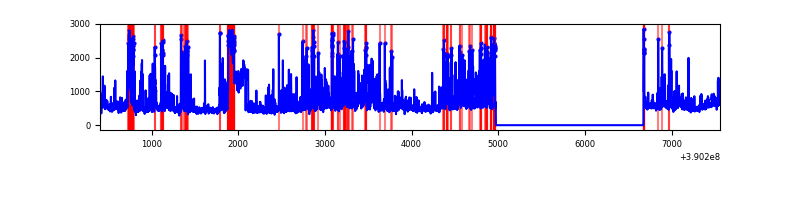 |
Top three noisy pixels from each quadrant. If the there are fewer than three noisy pixels in the level2.evt file, extra rows are filled as -1
| Pixel properties | Quadrant properties | ||||||
|---|---|---|---|---|---|---|---|
| Quadrant | DetID | PixID | Counts | Sigma | Mean | Median | Sigma |
| A | 15 | 169 | 3345940 | 29032.03 | 575 | 564 | 115.2 |
| A | 10 | 83 | 150309 | 1299.52 | 575 | 564 | 115.2 |
| A | 13 | 254 | 7968 | 64.25 | 575 | 564 | 115.2 |
| B | 5 | 172 | 236602 | 1916.46 | 643 | 626 | 123.1 |
| B | 0 | 213 | 91438 | 737.52 | 643 | 626 | 123.1 |
| B | 5 | 255 | 71172 | 572.93 | 643 | 626 | 123.1 |
| C | 15 | 214 | 231446 | 1580.49 | 628 | 630 | 146.0 |
| C | 0 | 10 | 164410 | 1121.47 | 628 | 630 | 146.0 |
| C | 0 | 207 | 28864 | 193.33 | 628 | 630 | 146.0 |
| D | 2 | 250 | 470786 | 3110.93 | 608 | 589 | 151.1 |
| D | 10 | 118 | 390159 | 2577.49 | 608 | 589 | 151.1 |
| D | 13 | 249 | 269310 | 1777.92 | 608 | 589 | 151.1 |
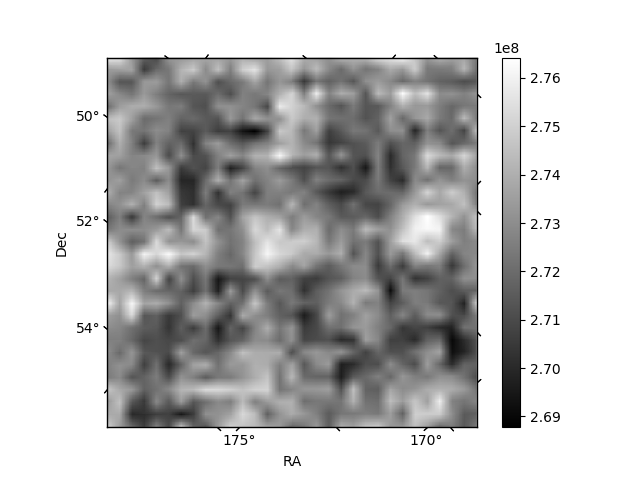
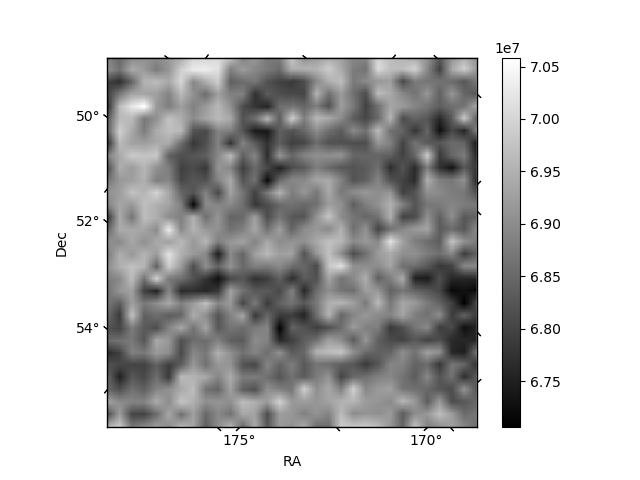
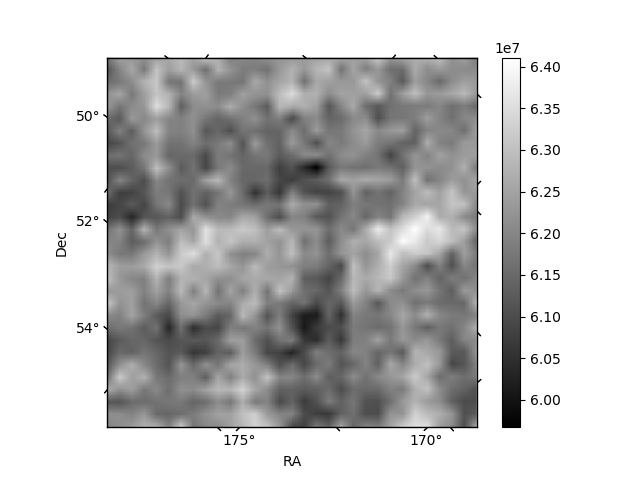
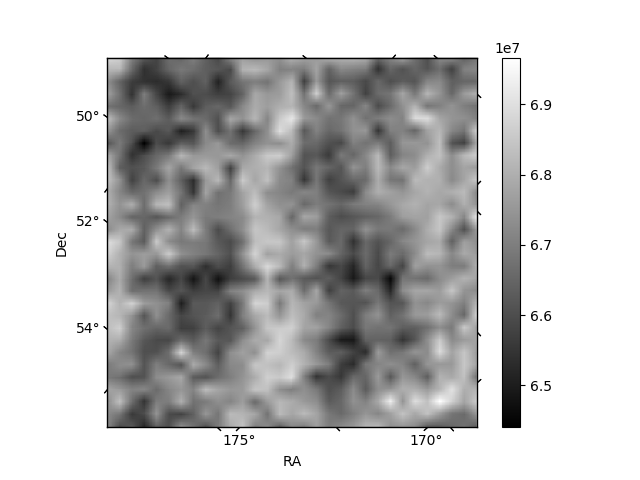
Histogram calculated using DETX and DETY for each event in the final _common_clean file
| Quadrant A | 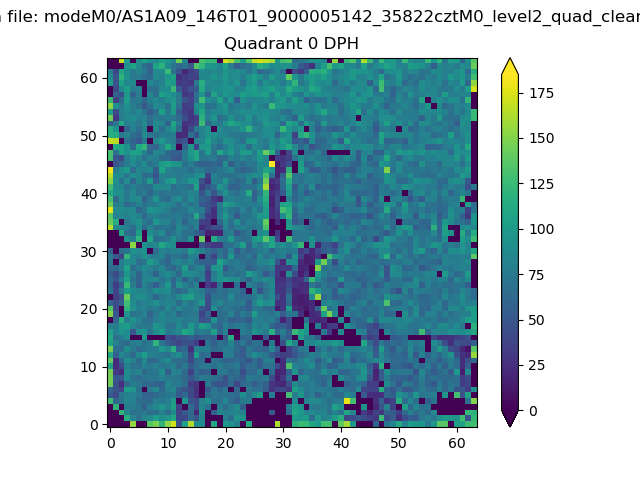 |
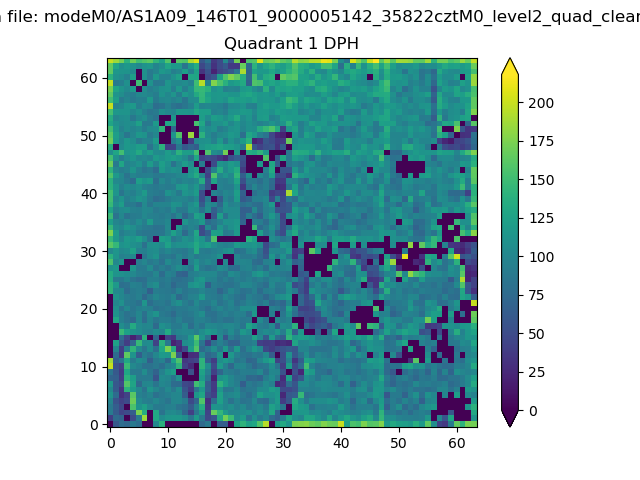 |
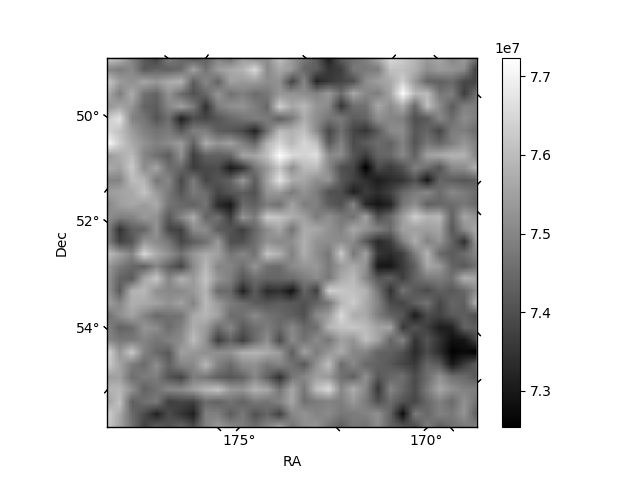
Quadrant B |
|---|---|---|---|
| Quadrant D | 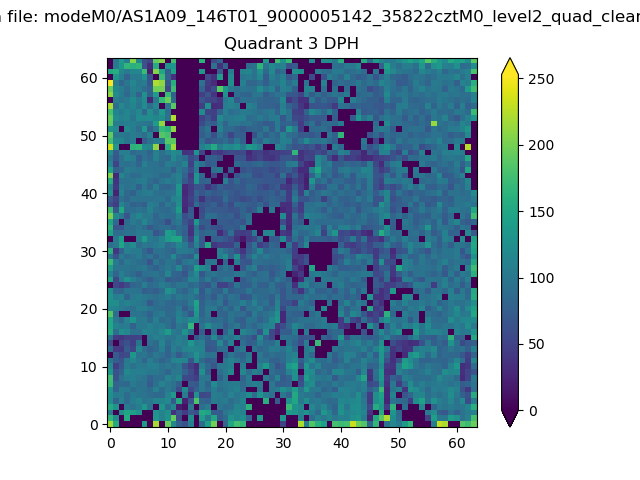 |
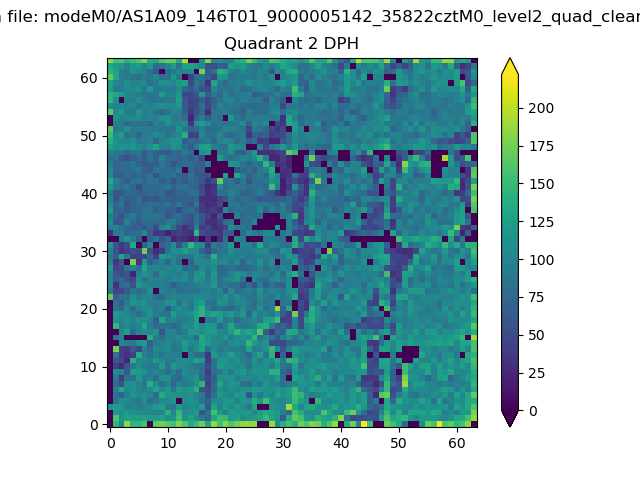 |
Quadrant C |
| Plot type | Count rate plots | Images |
|---|---|---|
| Comparison with Poisson distribution Blue bars denote a histogram of data divided into 1 sec bins. Red curve is a Poisson curve with rate = median count rate of data. |
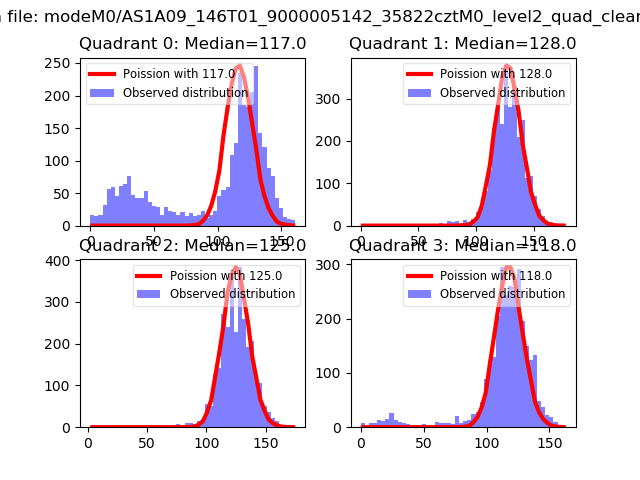 |
 |
| Quadrant-wise count rates Data is divided into 100 sec bins |
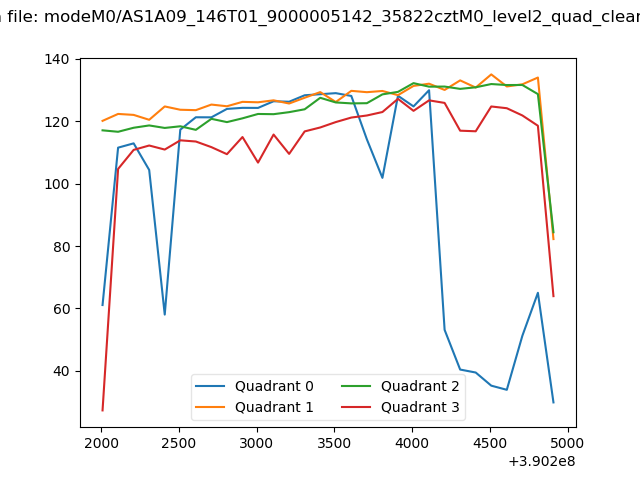 |
|
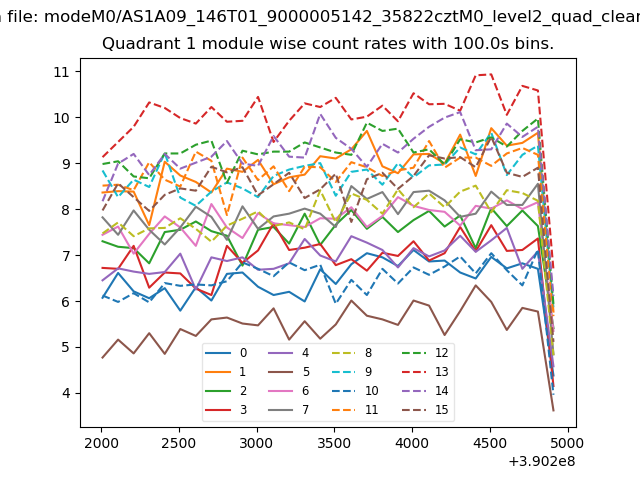
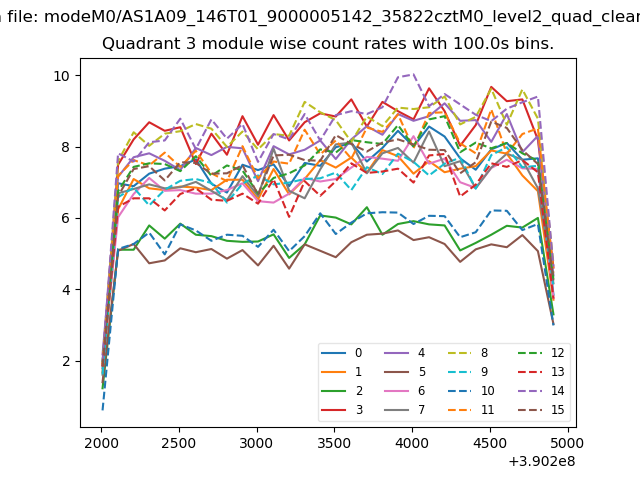
| Module-wise count rates for Quadrant A Data is divided into 100 sec bins |
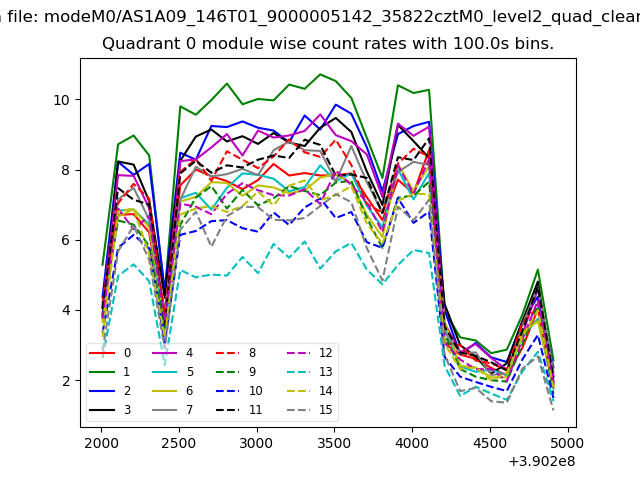 |
 |
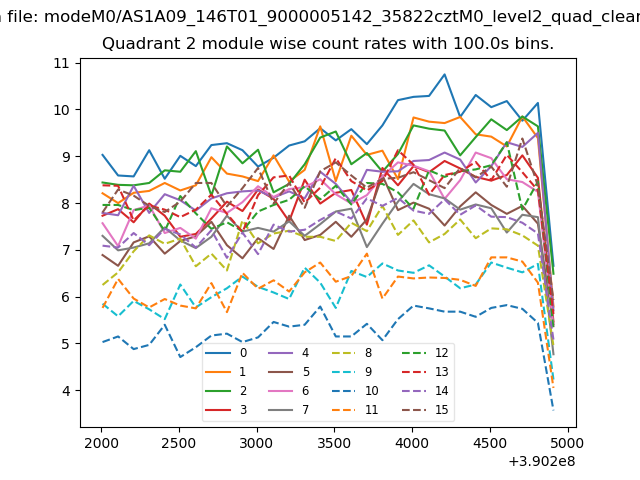
| Module-wise count rates for Quadrant B Data is divided into 100 sec bins |
 |
 |
| Module-wise count rates for Quadrant C Data is divided into 100 sec bins |
 |
 |
| Module-wise count rates for Quadrant D Data is divided into 100 sec bins |
 |
 |
| Parameter | Plot |
|---|---|
| CZT HV Monitor | 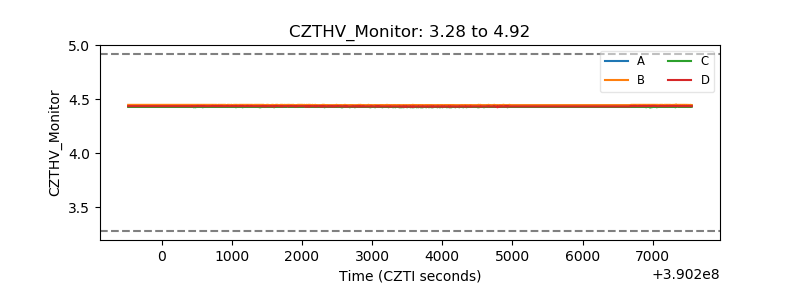 |
| D_VDD | 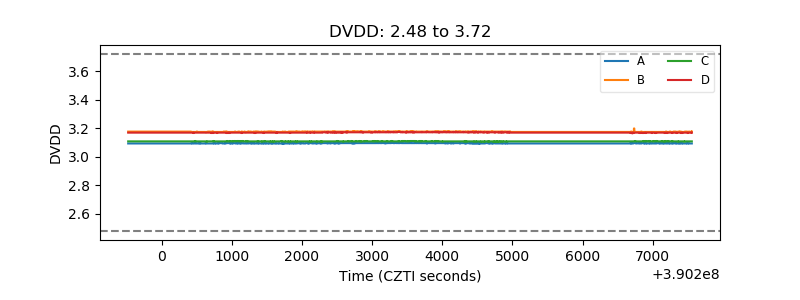 |
| Temperature 1 | 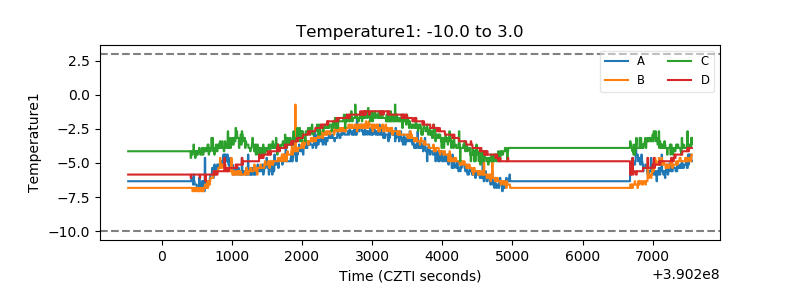 |
| Veto HV Monitor | 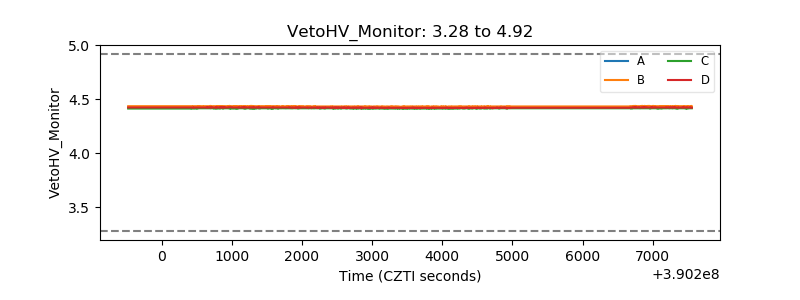 |
| Veto LLD | 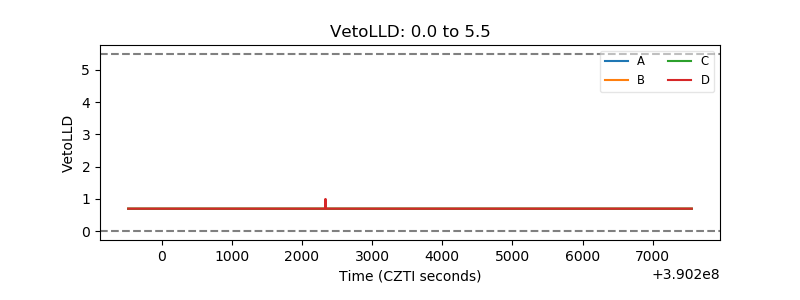 |
| Alpha Counter | 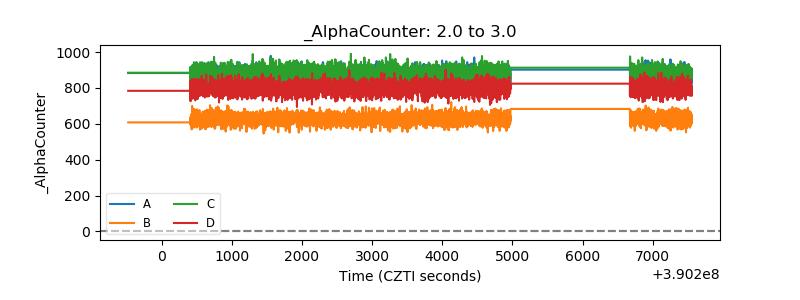 |
| _CPM_Rate | 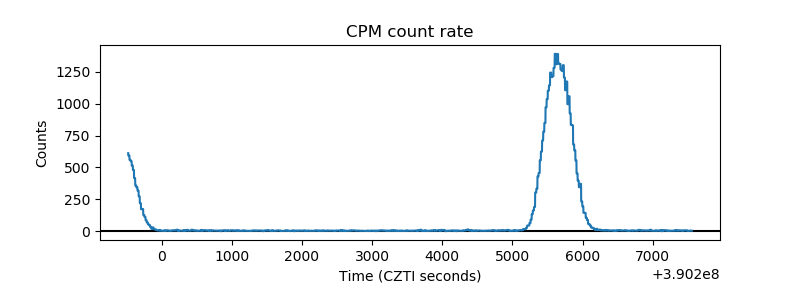 |
| CZT Counter | 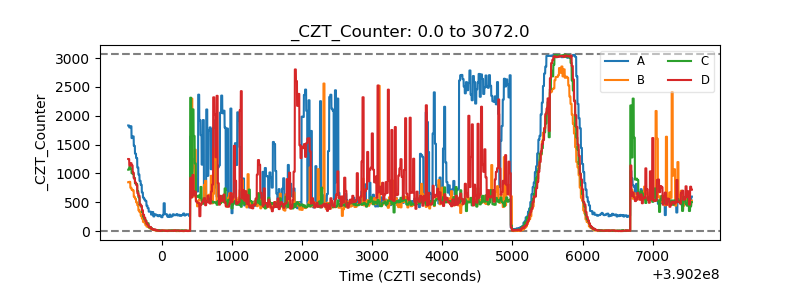 |
| +2.5 Volts monitor | 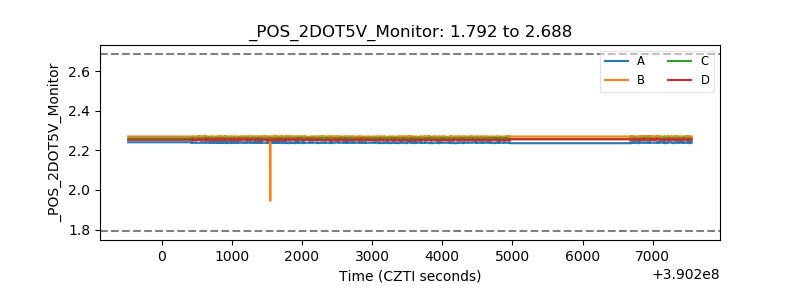 |
| +5 Volts monitor | 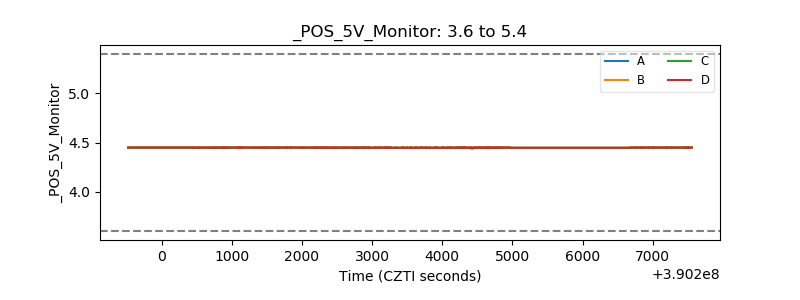 |
| _ROLL_ROT | 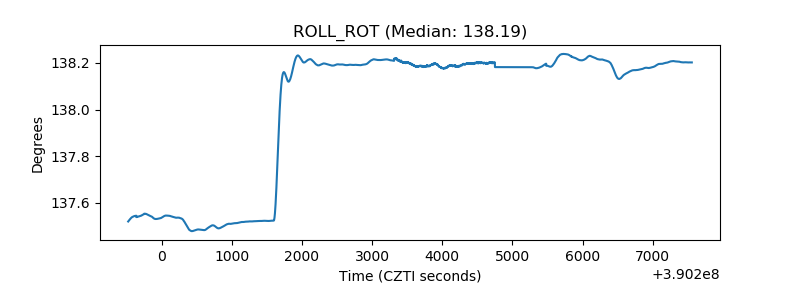 |
| _Roll_DEC | 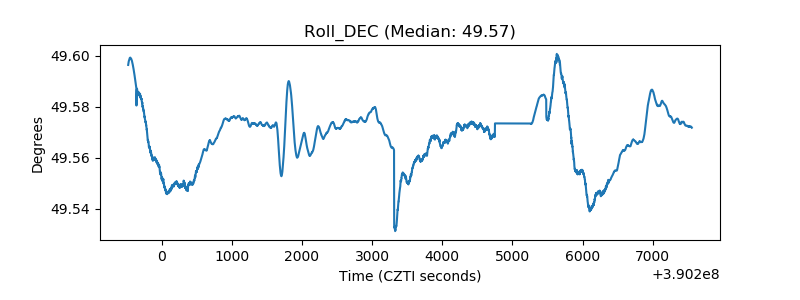 |
| _Roll_RA | 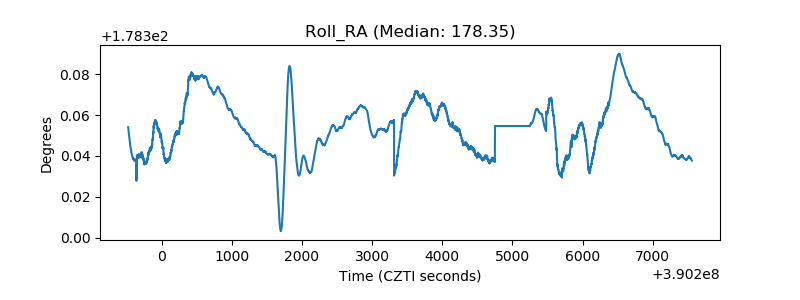 |
| Veto Counter | 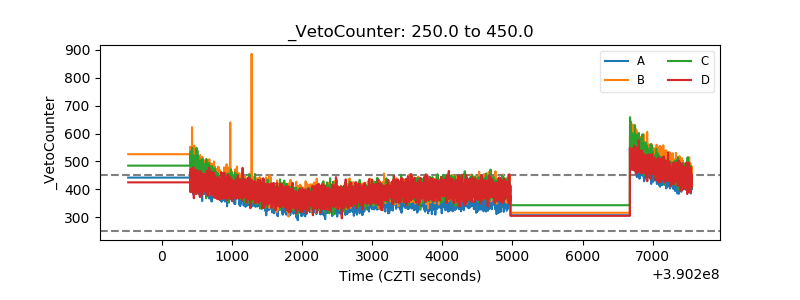 |