| Param | Original file | Final file |
|---|---|---|
| Filename | modeM0/AS1A09_146T01_9000005142_35816cztM0_level2.evt | modeM0/AS1A09_146T01_9000005142_35816cztM0_level2_quad_clean.evt |
| Size (bytes) | 490,648,320 | 70,084,800 |
| Size | 467.9 MB | 66.8 MB |
| Events in quadrant A | 3,642,310 | 441,527 |
| Events in quadrant B | 3,412,715 | 441,709 |
| Events in quadrant C | 3,009,984 | 431,717 |
| Events in quadrant D | 4,417,395 | 418,304 |
| Mode SS | |||
|---|---|---|---|
| Quadrant | BADHDUFLAG | Total packets | Discarded packets |
| A | 0 | 114 | 0 |
| B | 0 | 114 | 0 |
| C | 0 | 114 | 0 |
| D | 0 | 114 | 0 |
| Mode M0 | |||
|---|---|---|---|
| Quadrant | BADHDUFLAG | Total packets | Discarded packets |
| A | 0 | 14526 | 3 |
| B | 0 | 13837 | 2 |
| C | 0 | 12382 | 2 |
| D | 0 | 16962 | 2 |
| Mode M9 | |||
|---|---|---|---|
| Quadrant | BADHDUFLAG | Total packets | Discarded packets |
| A | 0 | 21 | 0 |
| B | 0 | 21 | 0 |
| C | 0 | 21 | 0 |
| D | 0 | 22 | 0 |
| Quadrant | Total seconds | Saturated seconds | Saturation percentage |
|---|---|---|---|
| A | 5551 | 161 | 2.900378% |
| B | 5551 | 159 | 2.864349% |
| C | 5551 | 146 | 2.630157% |
| D | 5551 | 447 | 8.052603% |
Noise dominated data is calculated using 1-second bins in cleaned event files. If a bin has >2000 counts, and if more than 50% of those come from <1% of pixels, then it is considered to be noise-dominated and hence unusable.
| Quadrant | # 1 sec bins | Bins with >0 counts | Bins with >2000 counts | High rate bins dominated by noise | Noise dominated (total time) | Noise dominated (detector-on time) | Marked lightcurve |
|---|---|---|---|---|---|---|---|
| A | 7044 | 5552 | 152 | 152 | 2.16% | 2.74% | 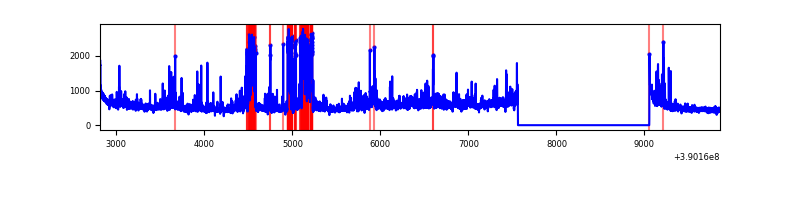 |
| B | 7044 | 5552 | 96 | 96 | 1.36% | 1.73% | 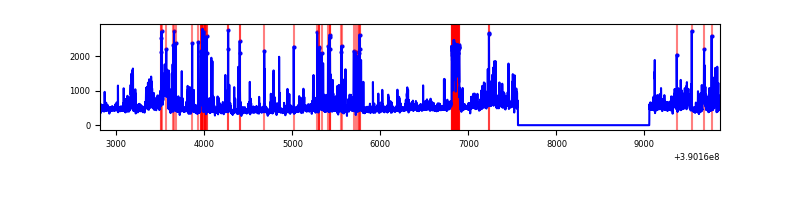 |
| C | 7044 | 5552 | 129 | 129 | 1.83% | 2.32% | 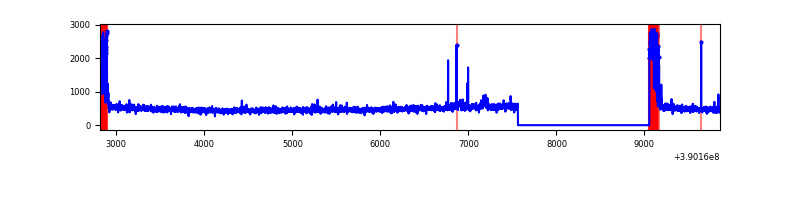 |
| D | 7044 | 5552 | 442 | 442 | 6.27% | 7.96% | 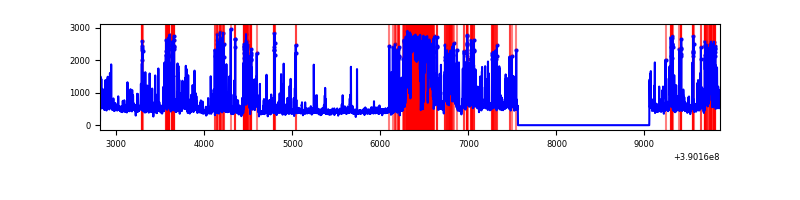 |
Top three noisy pixels from each quadrant. If the there are fewer than three noisy pixels in the level2.evt file, extra rows are filled as -1
| Pixel properties | Quadrant properties | ||||||
|---|---|---|---|---|---|---|---|
| Quadrant | DetID | PixID | Counts | Sigma | Mean | Median | Sigma |
| A | 15 | 169 | 1046249 | 8340.99 | 622 | 609 | 125.4 |
| A | 10 | 83 | 159289 | 1265.78 | 622 | 609 | 125.4 |
| A | 13 | 6 | 12874 | 97.84 | 622 | 609 | 125.4 |
| B | 5 | 255 | 388219 | 3256.91 | 622 | 605 | 119.0 |
| B | 0 | 213 | 227271 | 1904.55 | 622 | 605 | 119.0 |
| B | 5 | 172 | 226385 | 1897.11 | 622 | 605 | 119.0 |
| C | 0 | 10 | 352764 | 2491.71 | 608 | 610 | 141.3 |
| C | 15 | 214 | 229220 | 1617.56 | 608 | 610 | 141.3 |
| C | 0 | 207 | 49252 | 344.17 | 608 | 610 | 141.3 |
| D | 2 | 250 | 998973 | 6873.89 | 596 | 579 | 145.2 |
| D | 7 | 80 | 196868 | 1351.44 | 596 | 579 | 145.2 |
| D | 7 | 223 | 191324 | 1313.27 | 596 | 579 | 145.2 |
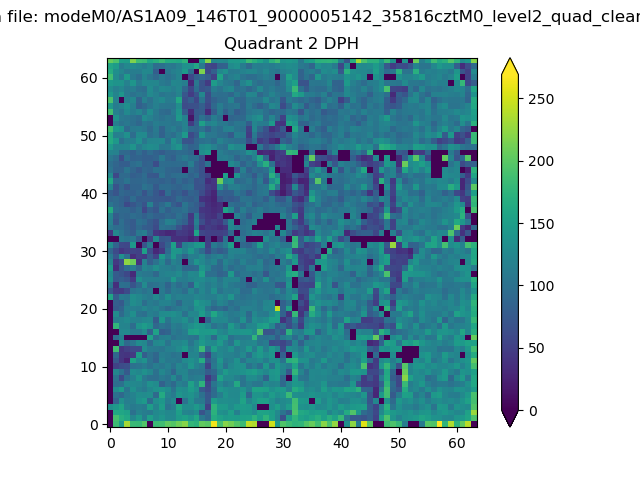
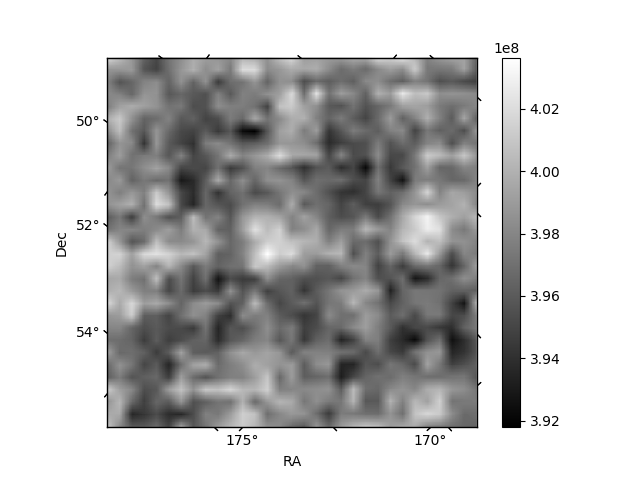
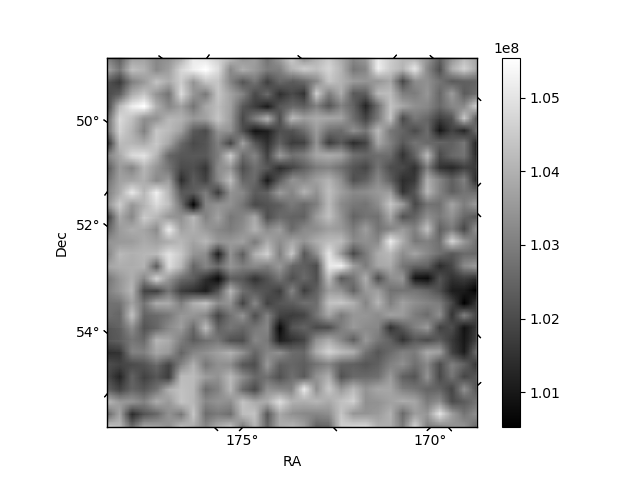
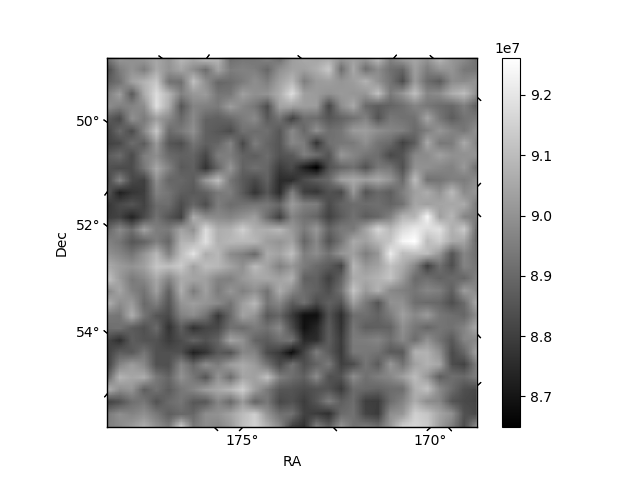
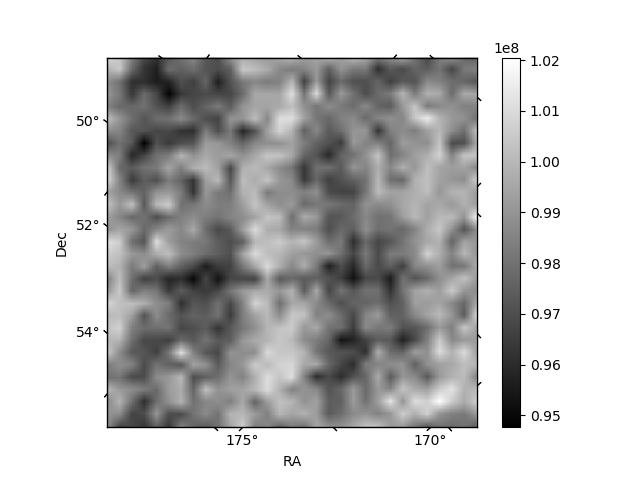
Histogram calculated using DETX and DETY for each event in the final _common_clean file
| Quadrant A | 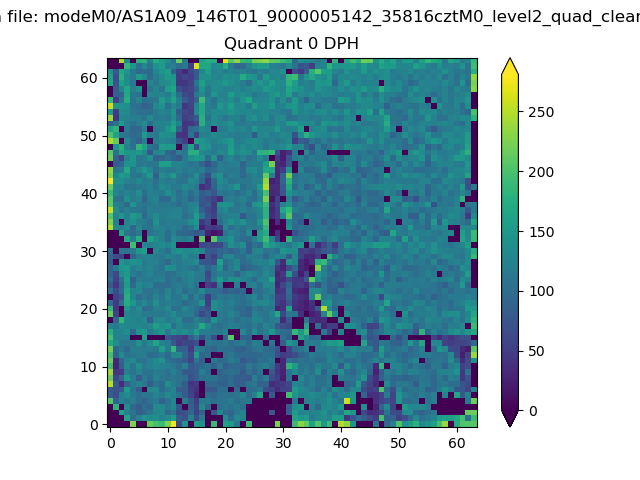 |
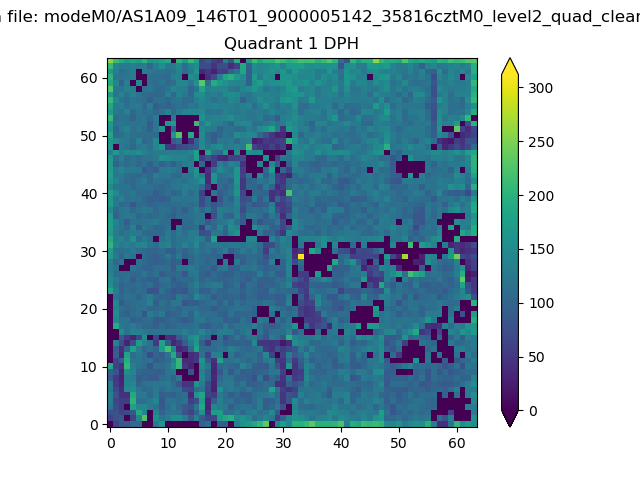 |
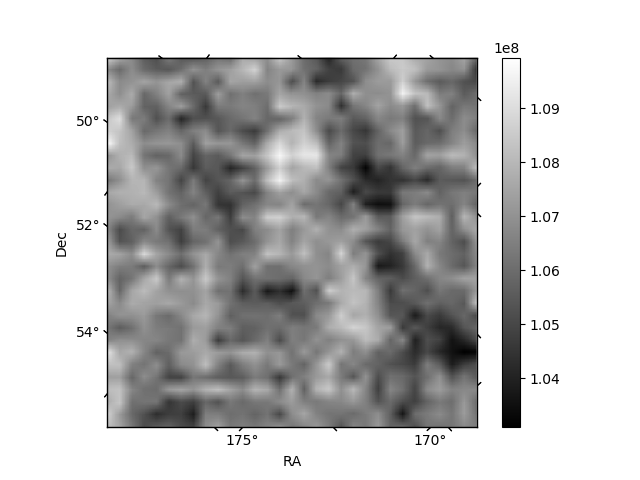
Quadrant B |
|---|---|---|---|
| Quadrant D | 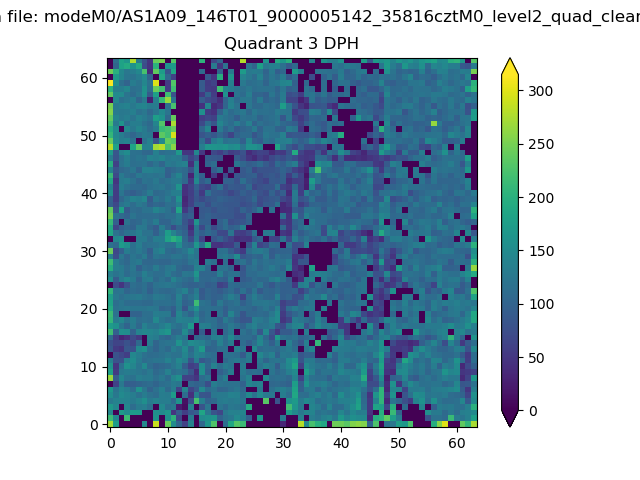 |
 |
Quadrant C |
| Plot type | Count rate plots | Images |
|---|---|---|
| Comparison with Poisson distribution Blue bars denote a histogram of data divided into 1 sec bins. Red curve is a Poisson curve with rate = median count rate of data. |
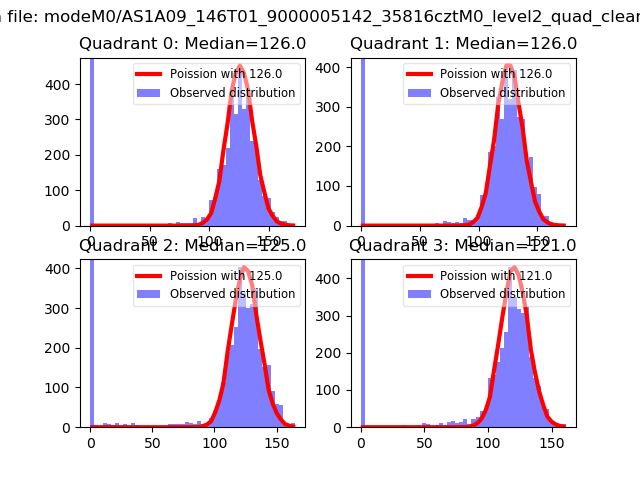 |
 |
| Quadrant-wise count rates Data is divided into 100 sec bins |
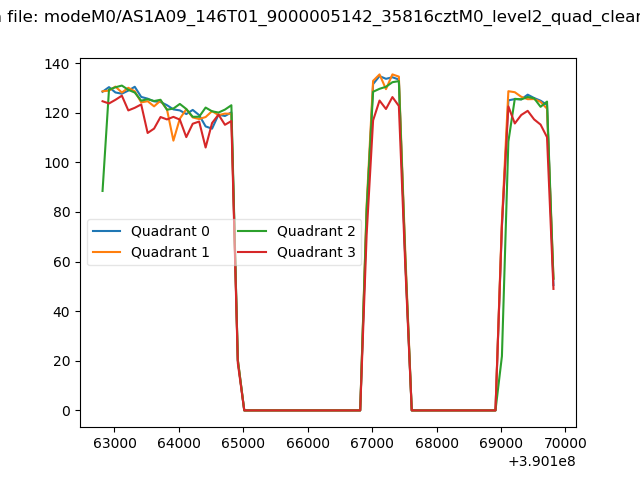 |
|
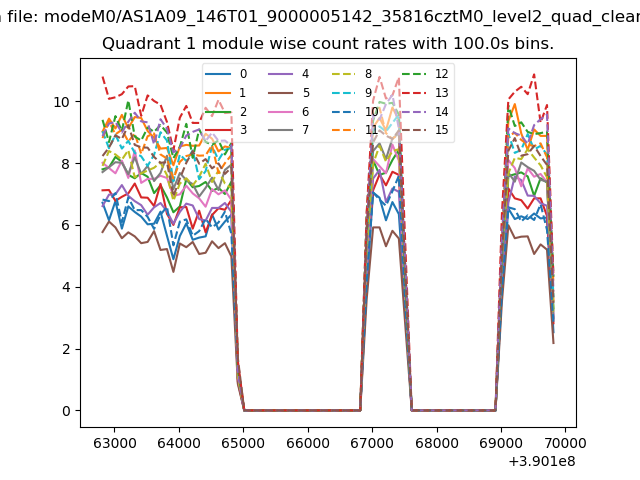
| Module-wise count rates for Quadrant A Data is divided into 100 sec bins |
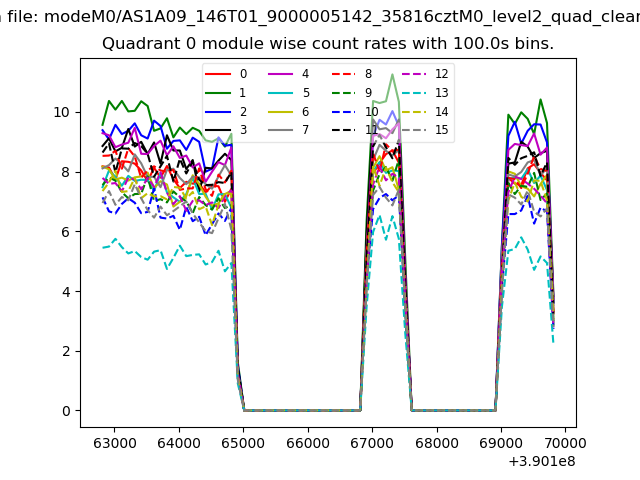 |
 |
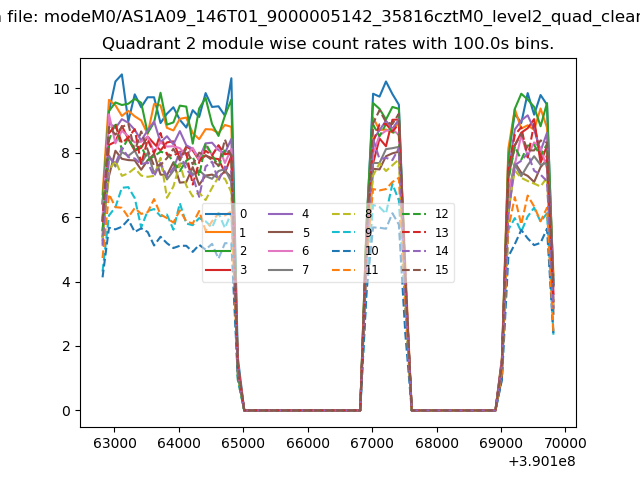
| Module-wise count rates for Quadrant B Data is divided into 100 sec bins |
 |
 |
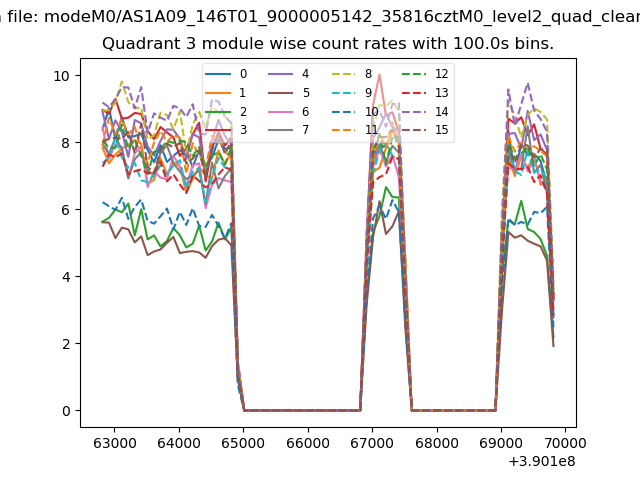
| Module-wise count rates for Quadrant C Data is divided into 100 sec bins |
 |
 |
| Module-wise count rates for Quadrant D Data is divided into 100 sec bins |
 |
 |
| Parameter | Plot |
|---|---|
| CZT HV Monitor | 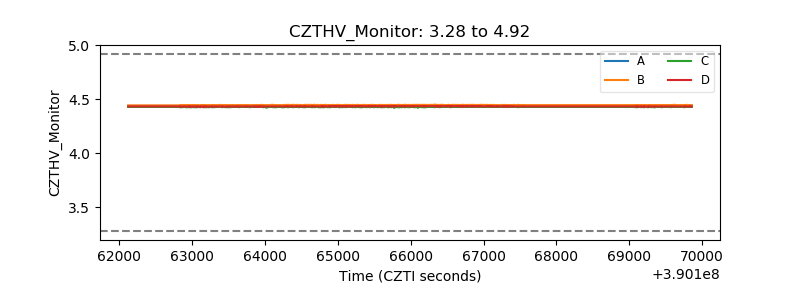 |
| D_VDD | 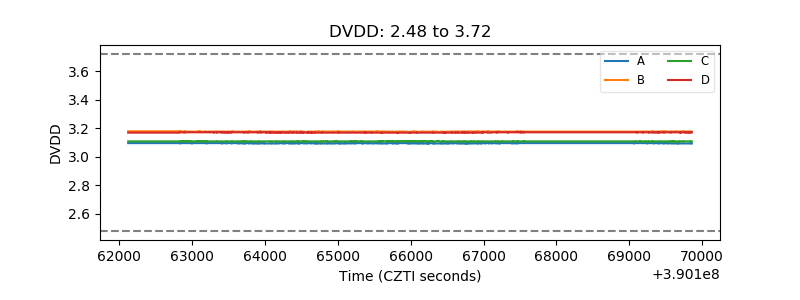 |
| Temperature 1 | 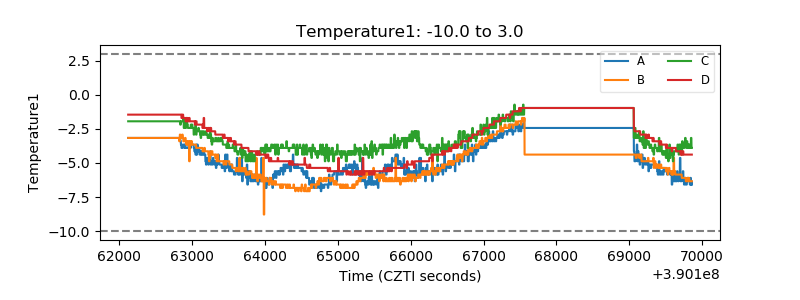 |
| Veto HV Monitor | 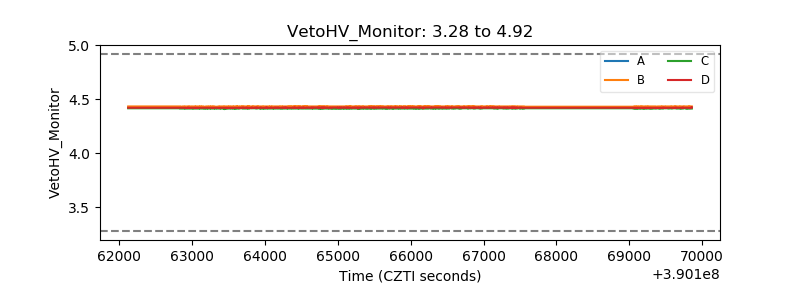 |
| Veto LLD | 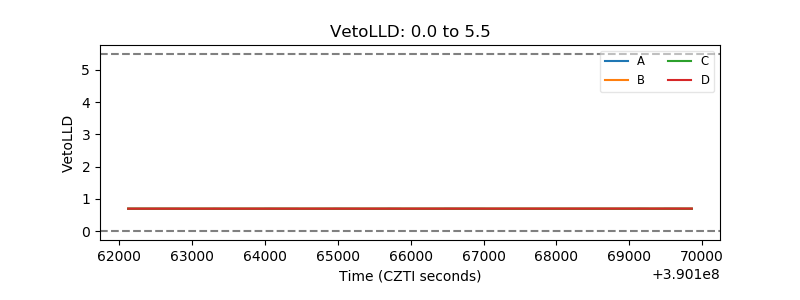 |
| Alpha Counter | 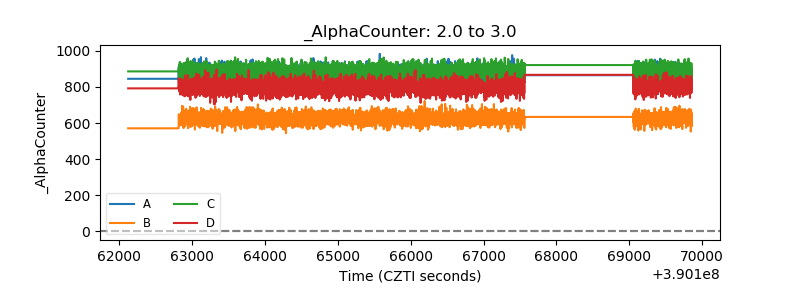 |
| _CPM_Rate | 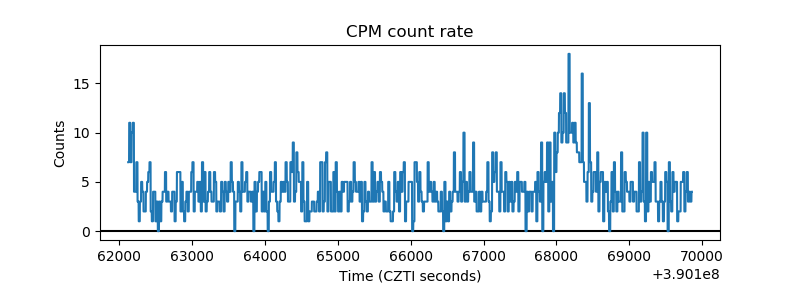 |
| CZT Counter | 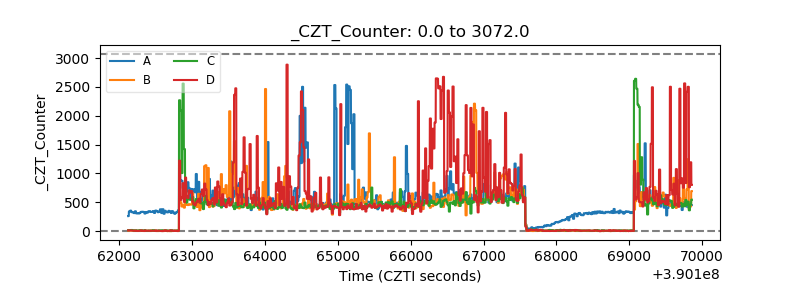 |
| +2.5 Volts monitor | 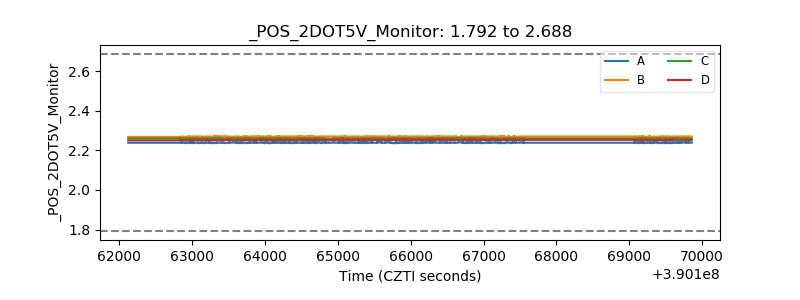 |
| +5 Volts monitor | 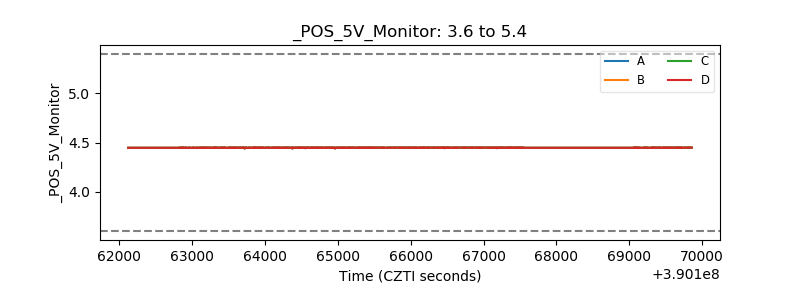 |
| _ROLL_ROT | 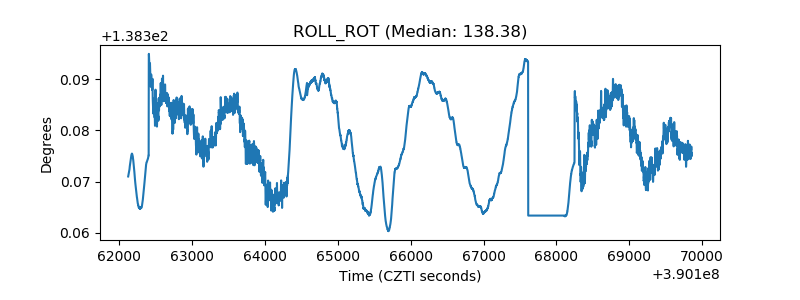 |
| _Roll_DEC | 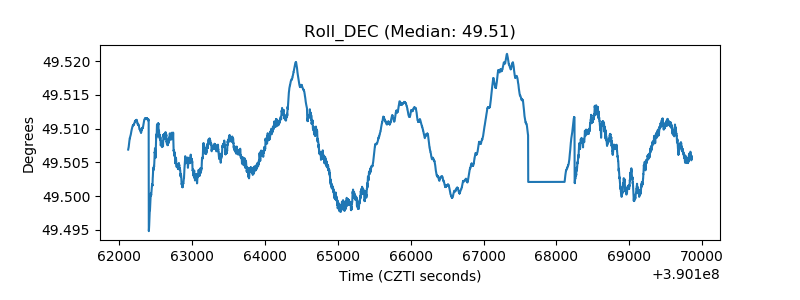 |
| _Roll_RA | 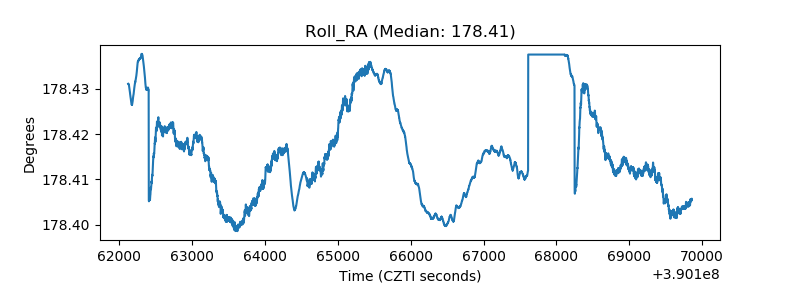 |
| Veto Counter | 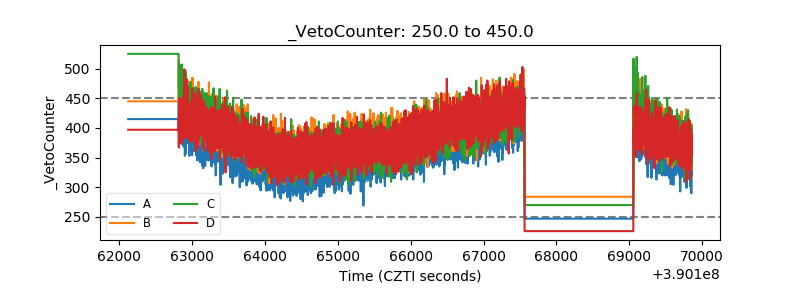 |