| Param | Original file | Final file |
|---|---|---|
| Filename | modeM0/AS1A09_146T01_9000005142_35813cztM0_level2.evt | modeM0/AS1A09_146T01_9000005142_35813cztM0_level2_quad_clean.evt |
| Size (bytes) | 390,922,560 | 90,469,440 |
| Size | 372.8 MB | 86.3 MB |
| Events in quadrant A | 2,693,915 | 614,652 |
| Events in quadrant B | 2,917,630 | 607,445 |
| Events in quadrant C | 2,753,532 | 595,325 |
| Events in quadrant D | 3,140,053 | 577,711 |
| Mode SS | |||
|---|---|---|---|
| Quadrant | BADHDUFLAG | Total packets | Discarded packets |
| A | 0 | 100 | 0 |
| B | 0 | 100 | 0 |
| C | 0 | 100 | 0 |
| D | 0 | 100 | 0 |
| Mode M0 | |||
|---|---|---|---|
| Quadrant | BADHDUFLAG | Total packets | Discarded packets |
| A | 0 | 11072 | 2 |
| B | 0 | 11697 | 1 |
| C | 0 | 10915 | 1 |
| D | 0 | 12540 | 1 |
| Mode M9 | |||
|---|---|---|---|
| Quadrant | BADHDUFLAG | Total packets | Discarded packets |
| A | 0 | 21 | 0 |
| B | 0 | 21 | 0 |
| C | 0 | 21 | 0 |
| D | 0 | 21 | 0 |
| Quadrant | Total seconds | Saturated seconds | Saturation percentage |
|---|---|---|---|
| A | 4915 | 27 | 0.549339% |
| B | 4915 | 101 | 2.054934% |
| C | 4915 | 79 | 1.607325% |
| D | 4915 | 56 | 1.139369% |
Noise dominated data is calculated using 1-second bins in cleaned event files. If a bin has >2000 counts, and if more than 50% of those come from <1% of pixels, then it is considered to be noise-dominated and hence unusable.
| Quadrant | # 1 sec bins | Bins with >0 counts | Bins with >2000 counts | High rate bins dominated by noise | Noise dominated (total time) | Noise dominated (detector-on time) | Marked lightcurve |
|---|---|---|---|---|---|---|---|
| A | 7068 | 4916 | 21 | 21 | 0.30% | 0.43% | 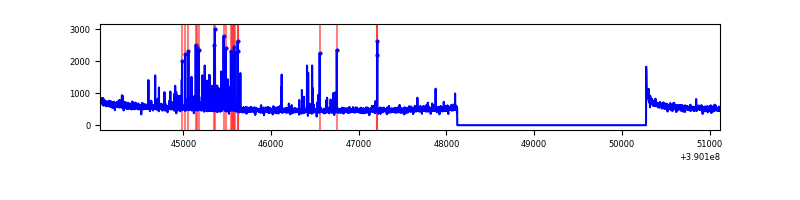 |
| B | 7068 | 4916 | 81 | 81 | 1.15% | 1.65% | 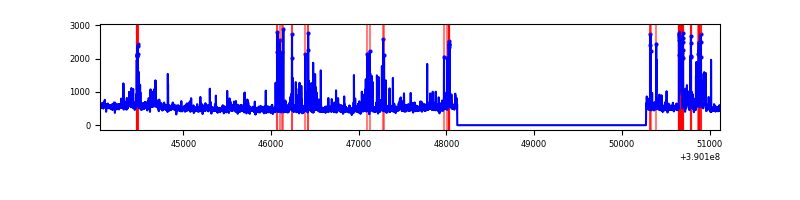 |
| C | 7068 | 4916 | 58 | 58 | 0.82% | 1.18% | 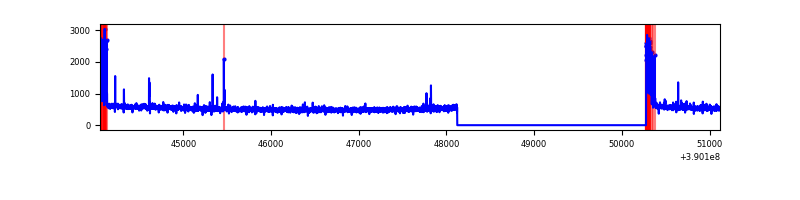 |
| D | 7068 | 4916 | 66 | 66 | 0.93% | 1.34% | 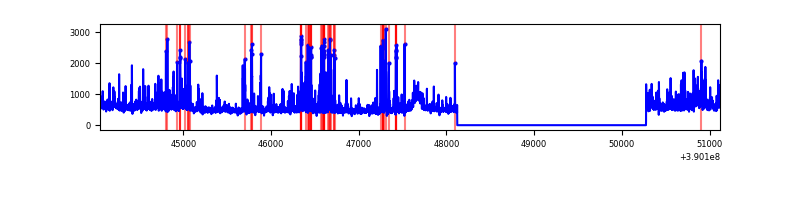 |
Top three noisy pixels from each quadrant. If the there are fewer than three noisy pixels in the level2.evt file, extra rows are filled as -1
| Pixel properties | Quadrant properties | ||||||
|---|---|---|---|---|---|---|---|
| Quadrant | DetID | PixID | Counts | Sigma | Mean | Median | Sigma |
| A | 15 | 169 | 170380 | 1396.46 | 611 | 601 | 121.6 |
| A | 10 | 83 | 139907 | 1145.82 | 611 | 601 | 121.6 |
| A | 13 | 6 | 13677 | 107.55 | 611 | 601 | 121.6 |
| B | 5 | 255 | 277890 | 2493.36 | 597 | 582 | 111.2 |
| B | 5 | 172 | 115410 | 1032.45 | 597 | 582 | 111.2 |
| B | 4 | 232 | 65100 | 580.1 | 597 | 582 | 111.2 |
| C | 0 | 10 | 232923 | 1700.45 | 591 | 598 | 136.6 |
| C | 15 | 214 | 205737 | 1501.47 | 591 | 598 | 136.6 |
| C | 13 | 61 | 3984 | 24.78 | 591 | 598 | 136.6 |
| D | 7 | 223 | 186512 | 1274.47 | 599 | 586 | 145.9 |
| D | 13 | 249 | 150931 | 1030.57 | 599 | 586 | 145.9 |
| D | 2 | 250 | 144971 | 989.72 | 599 | 586 | 145.9 |
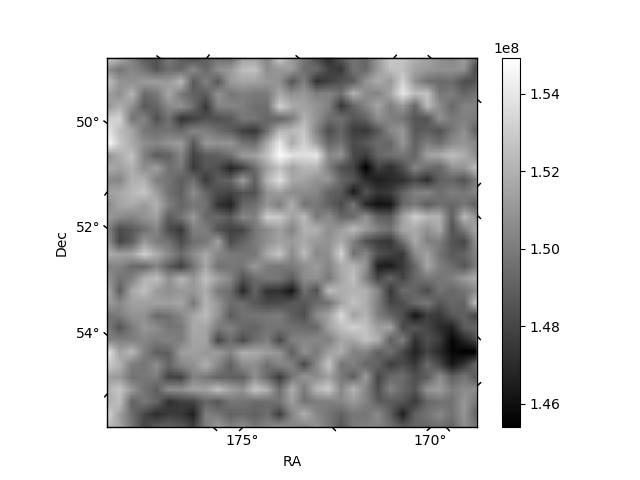
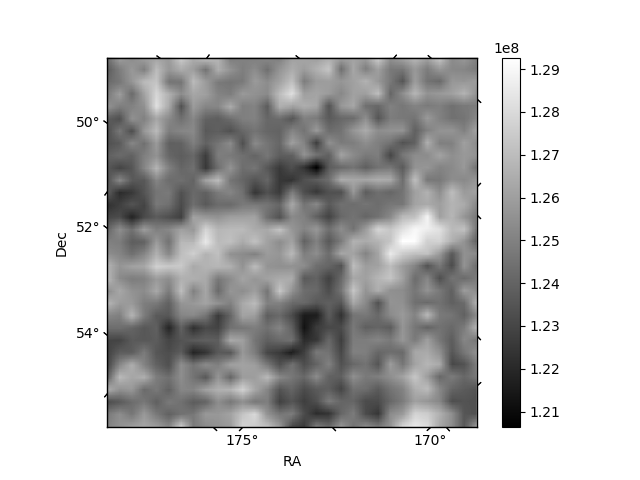
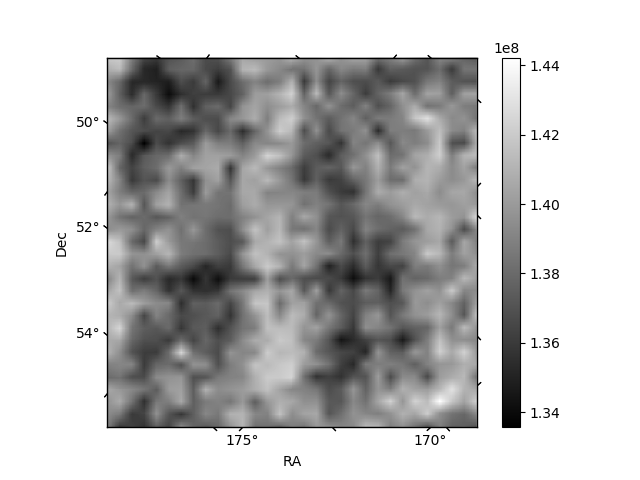
Histogram calculated using DETX and DETY for each event in the final _common_clean file
| Quadrant A | 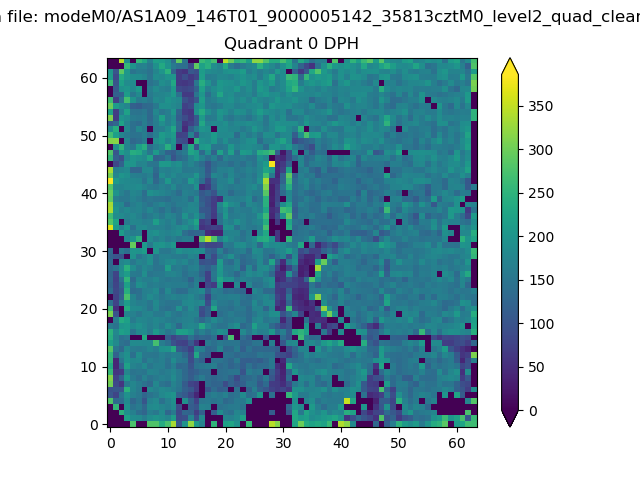 |
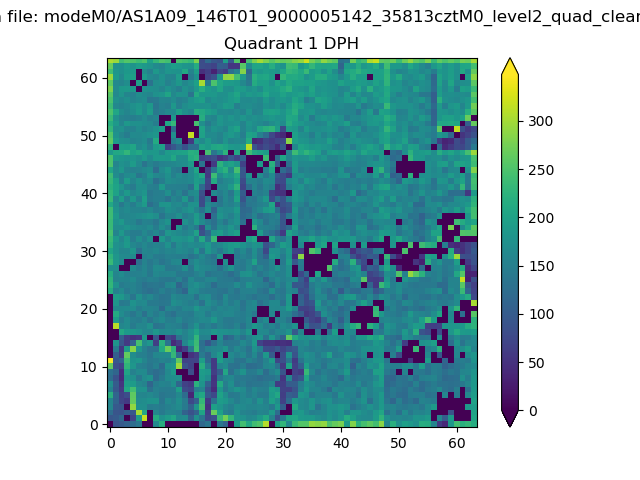 |
Quadrant B |
|---|---|---|---|
| Quadrant D | 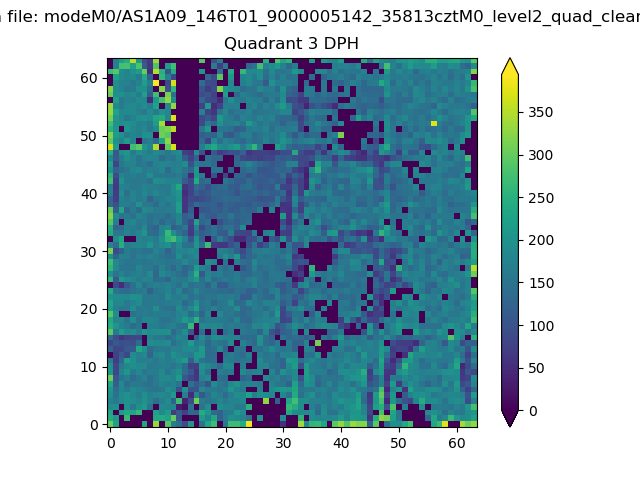 |
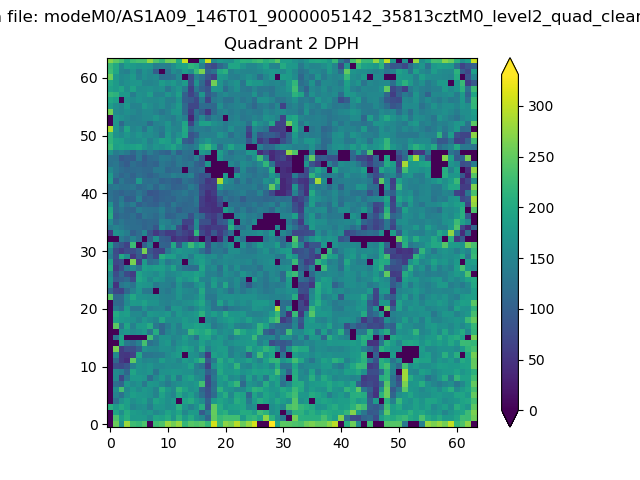 |
Quadrant C |
| Plot type | Count rate plots | Images |
|---|---|---|
| Comparison with Poisson distribution Blue bars denote a histogram of data divided into 1 sec bins. Red curve is a Poisson curve with rate = median count rate of data. |
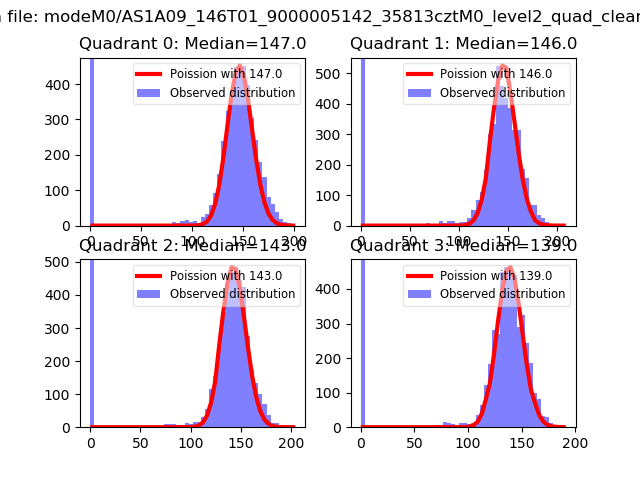 |
 |
| Quadrant-wise count rates Data is divided into 100 sec bins |
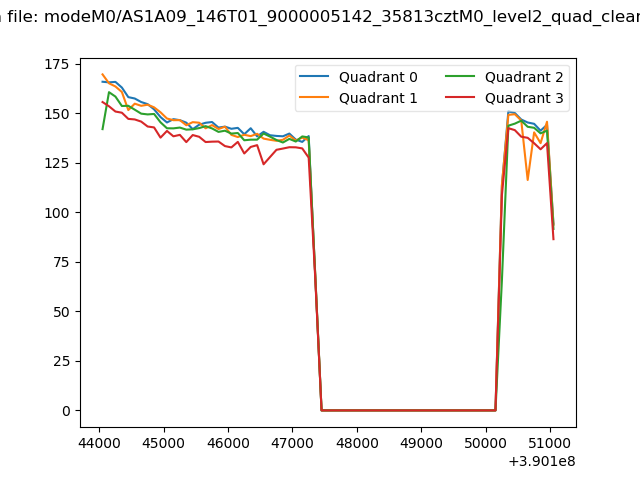 |
|
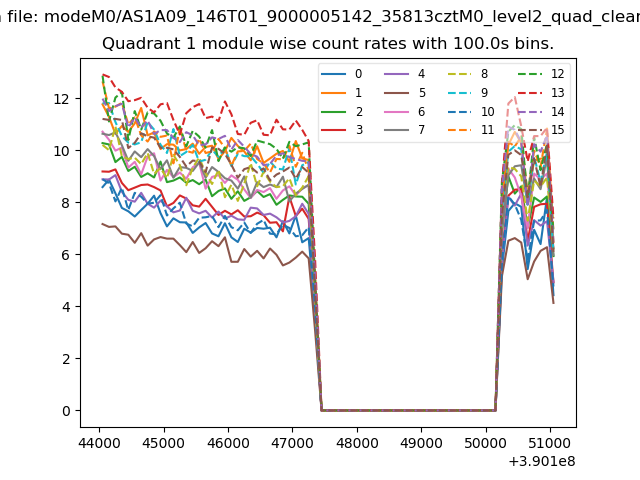
| Module-wise count rates for Quadrant A Data is divided into 100 sec bins |
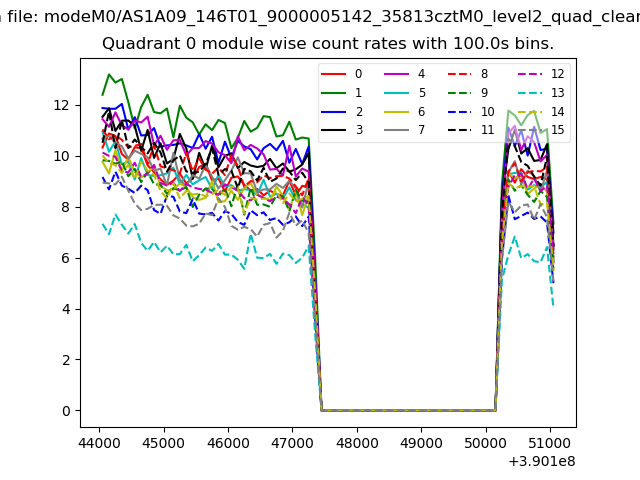 |
 |
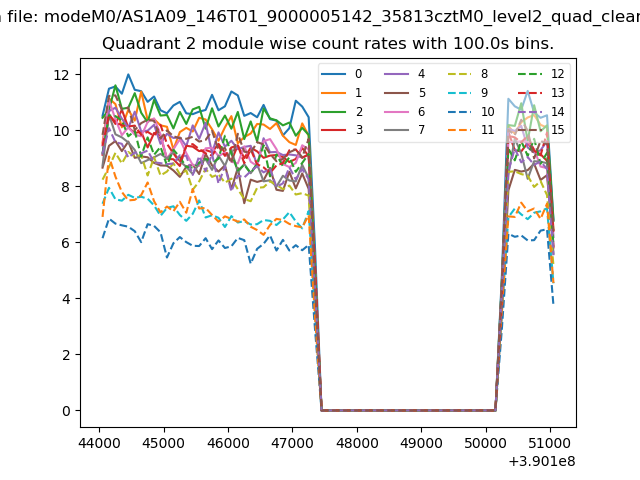
| Module-wise count rates for Quadrant B Data is divided into 100 sec bins |
 |
 |
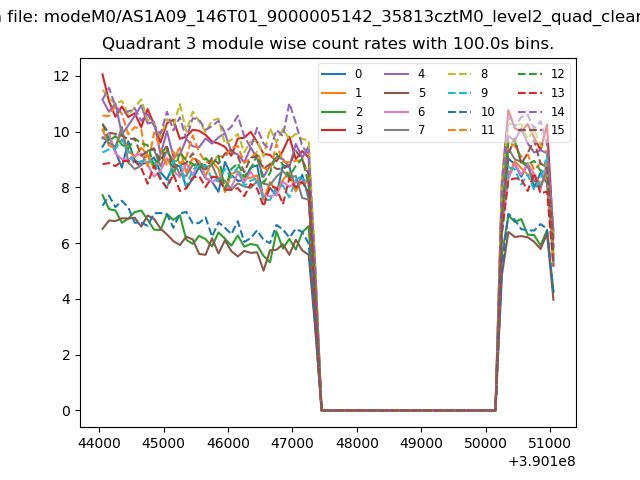
| Module-wise count rates for Quadrant C Data is divided into 100 sec bins |
 |
 |
| Module-wise count rates for Quadrant D Data is divided into 100 sec bins |
 |
 |
| Parameter | Plot |
|---|---|
| CZT HV Monitor |  |
| D_VDD | 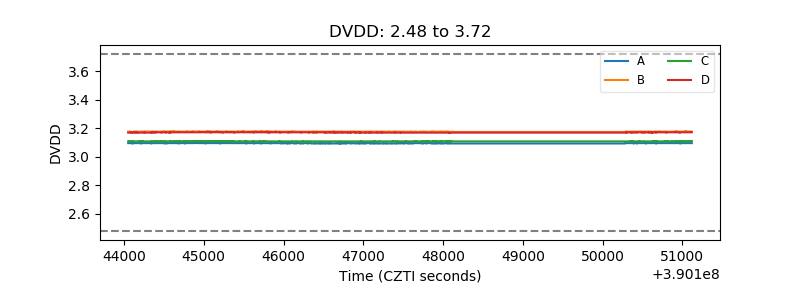 |
| Temperature 1 | 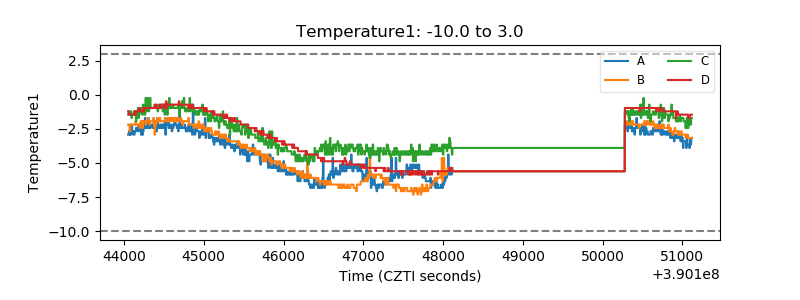 |
| Veto HV Monitor | 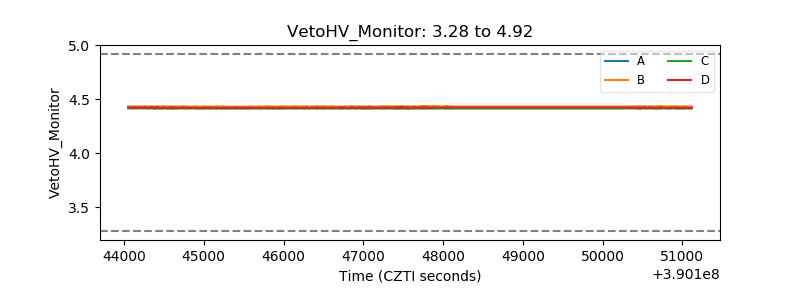 |
| Veto LLD | 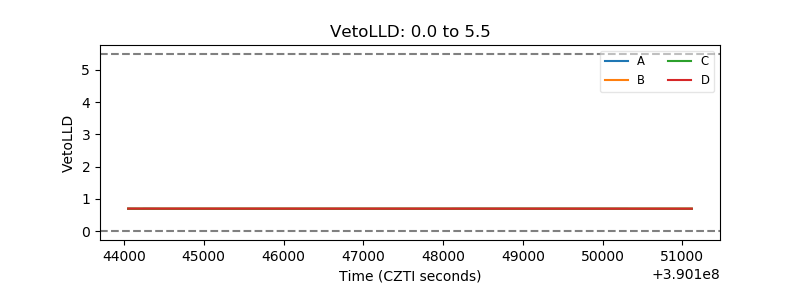 |
| Alpha Counter |  |
| _CPM_Rate | 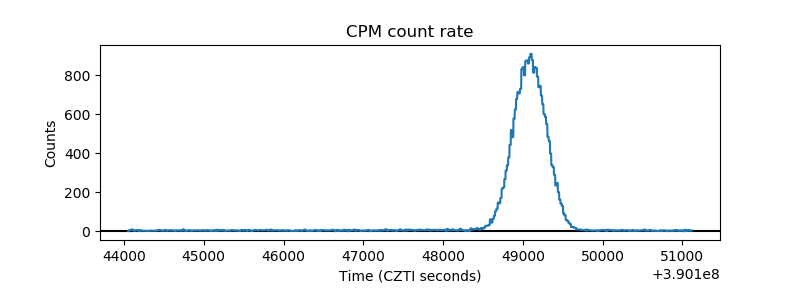 |
| CZT Counter | 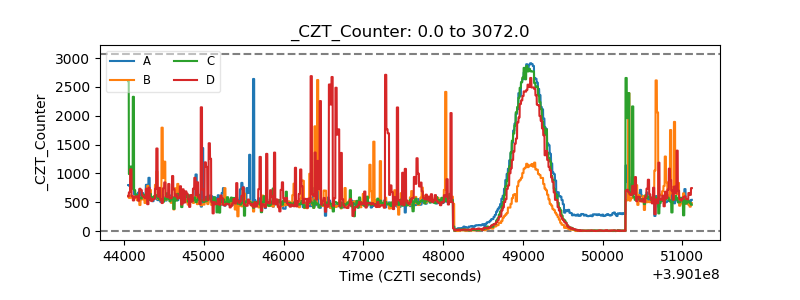 |
| +2.5 Volts monitor | 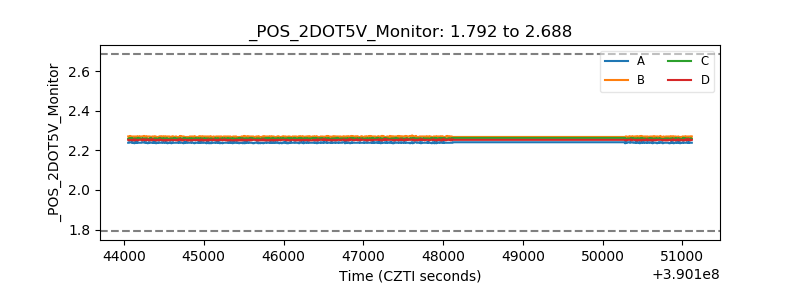 |
| +5 Volts monitor | 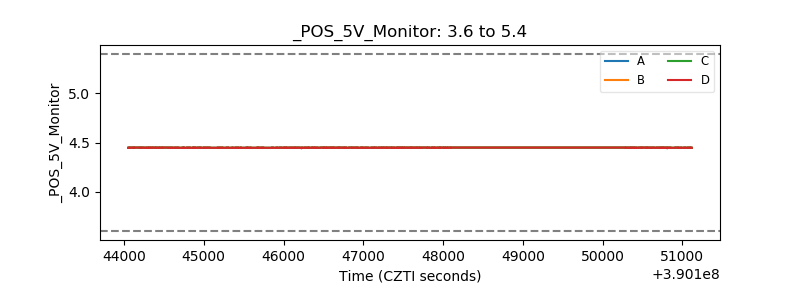 |
| _ROLL_ROT | 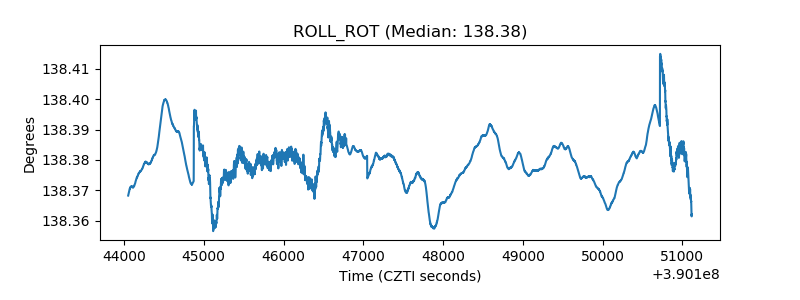 |
| _Roll_DEC | 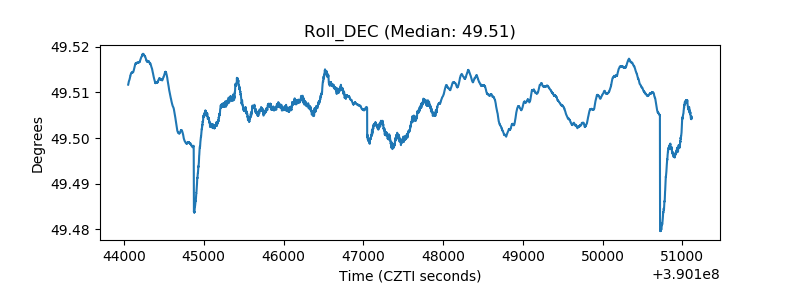 |
| _Roll_RA | 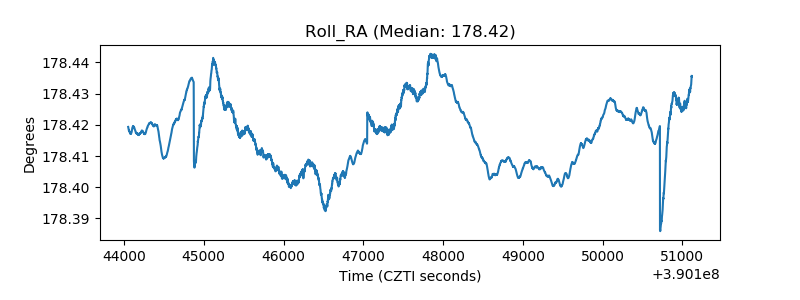 |
| Veto Counter | 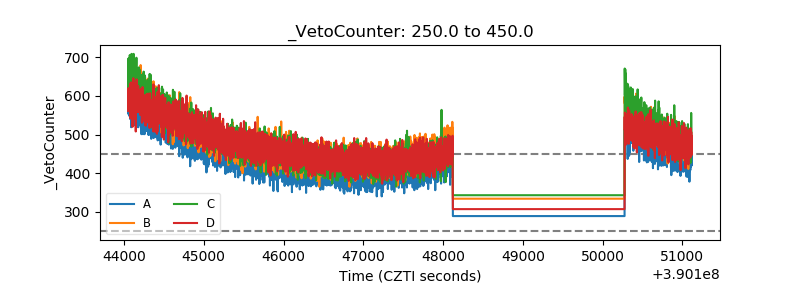 |