| Param | Original file | Final file |
|---|---|---|
| Filename | modeM0/AS1A09_029T10_9000005140_35801cztM0_level2.evt | modeM0/AS1A09_029T10_9000005140_35801cztM0_level2_quad_clean.evt |
| Size (bytes) | 448,211,520 | 70,162,560 |
| Size | 427.4 MB | 66.9 MB |
| Events in quadrant A | 2,555,823 | 453,556 |
| Events in quadrant B | 3,602,901 | 448,834 |
| Events in quadrant C | 3,713,865 | 427,438 |
| Events in quadrant D | 3,331,351 | 413,124 |
| Mode M0 | |||
|---|---|---|---|
| Quadrant | BADHDUFLAG | Total packets | Discarded packets |
| A | 0 | 11172 | 3 |
| B | 0 | 14237 | 2 |
| C | 0 | 14641 | 2 |
| D | 0 | 13721 | 2 |
| Mode M9 | |||
|---|---|---|---|
| Quadrant | BADHDUFLAG | Total packets | Discarded packets |
| A | 0 | 27 | 0 |
| B | 0 | 27 | 0 |
| C | 0 | 27 | 0 |
| D | 0 | 28 | 0 |
| Mode SS | |||
|---|---|---|---|
| Quadrant | BADHDUFLAG | Total packets | Discarded packets |
| A | 0 | 112 | 0 |
| B | 0 | 112 | 0 |
| C | 0 | 112 | 0 |
| D | 0 | 112 | 0 |
| Quadrant | Total seconds | Saturated seconds | Saturation percentage |
|---|---|---|---|
| A | 5446 | 5 | 0.091811% |
| B | 5446 | 239 | 4.388542% |
| C | 5446 | 197 | 3.617334% |
| D | 5446 | 234 | 4.296732% |
Noise dominated data is calculated using 1-second bins in cleaned event files. If a bin has >2000 counts, and if more than 50% of those come from <1% of pixels, then it is considered to be noise-dominated and hence unusable.
| Quadrant | # 1 sec bins | Bins with >0 counts | Bins with >2000 counts | High rate bins dominated by noise | Noise dominated (total time) | Noise dominated (detector-on time) | Marked lightcurve |
|---|---|---|---|---|---|---|---|
| A | 7118 | 5447 | 0 | 0 | 0.00% | 0.00% | 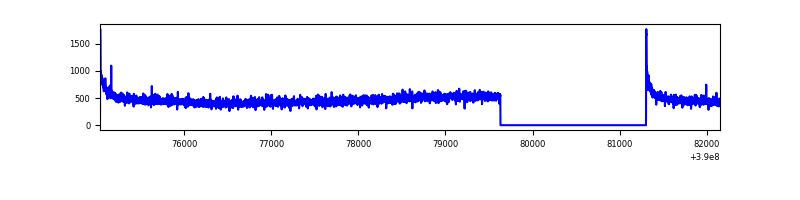 |
| B | 7118 | 5447 | 186 | 186 | 2.61% | 3.41% | 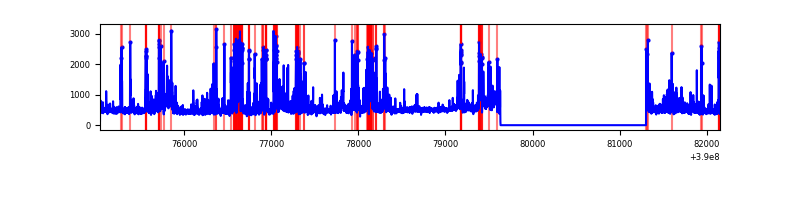 |
| C | 7118 | 5447 | 200 | 200 | 2.81% | 3.67% | 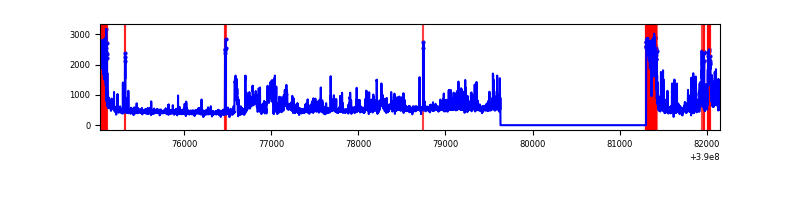 |
| D | 7118 | 5447 | 227 | 227 | 3.19% | 4.17% | 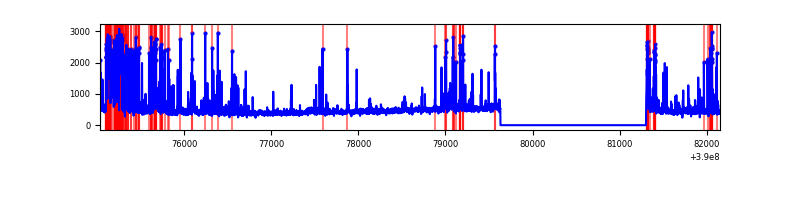 |
Top three noisy pixels from each quadrant. If the there are fewer than three noisy pixels in the level2.evt file, extra rows are filled as -1
| Pixel properties | Quadrant properties | ||||||
|---|---|---|---|---|---|---|---|
| Quadrant | DetID | PixID | Counts | Sigma | Mean | Median | Sigma |
| A | 10 | 83 | 160051 | 1274.42 | 616 | 604 | 125.1 |
| A | 13 | 6 | 13942 | 106.61 | 616 | 604 | 125.1 |
| A | 3 | 137 | 6585 | 47.8 | 616 | 604 | 125.1 |
| B | 5 | 172 | 693619 | 5941.08 | 604 | 588 | 116.7 |
| B | 5 | 255 | 192587 | 1645.93 | 604 | 588 | 116.7 |
| B | 0 | 213 | 148894 | 1271.37 | 604 | 588 | 116.7 |
| C | 0 | 207 | 692436 | 5116.54 | 581 | 585 | 135.2 |
| C | 0 | 10 | 427225 | 3155.19 | 581 | 585 | 135.2 |
| C | 15 | 214 | 225957 | 1666.73 | 581 | 585 | 135.2 |
| D | 13 | 249 | 762439 | 5301.77 | 581 | 565 | 143.7 |
| D | 2 | 250 | 114154 | 790.45 | 581 | 565 | 143.7 |
| D | 10 | 199 | 52522 | 361.56 | 581 | 565 | 143.7 |
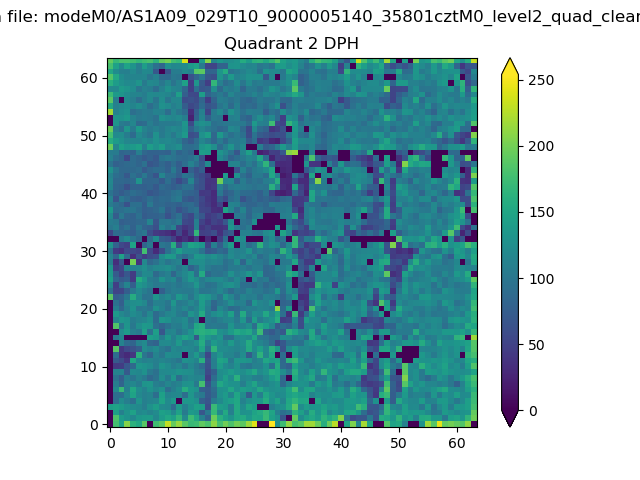
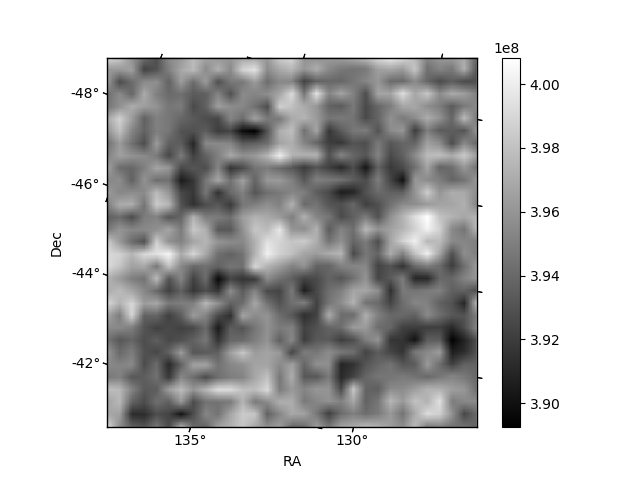
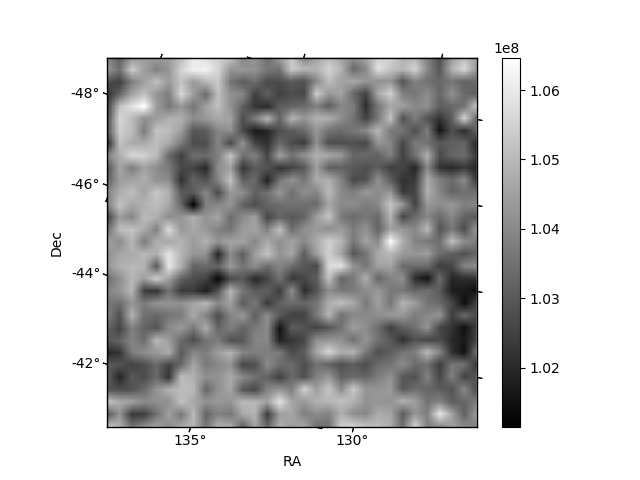
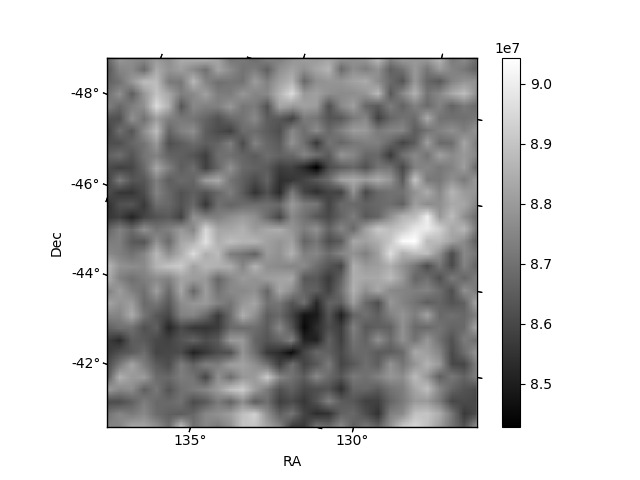
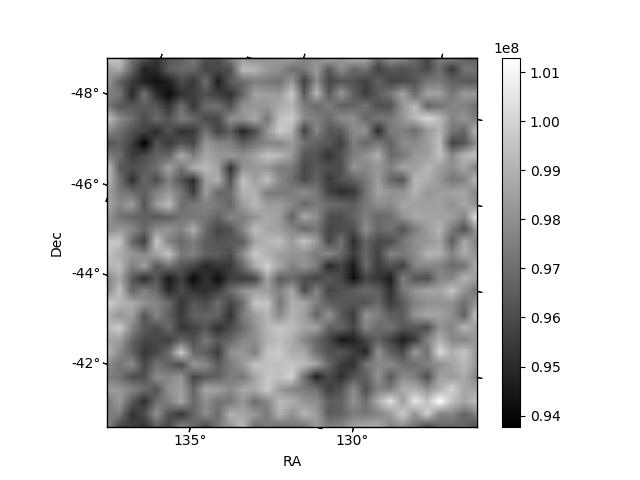
Histogram calculated using DETX and DETY for each event in the final _common_clean file
| Quadrant A | 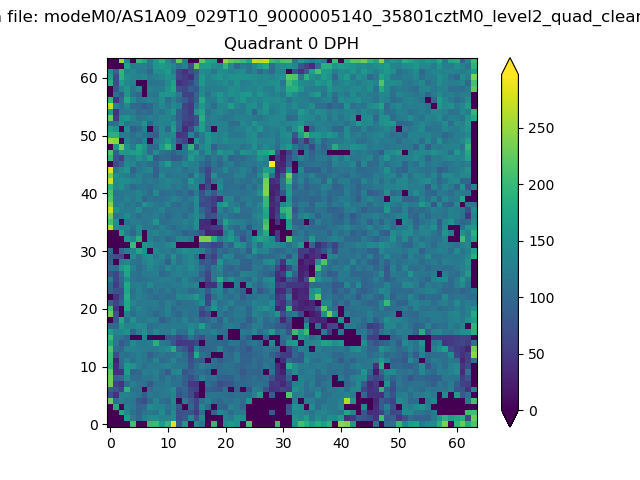 |
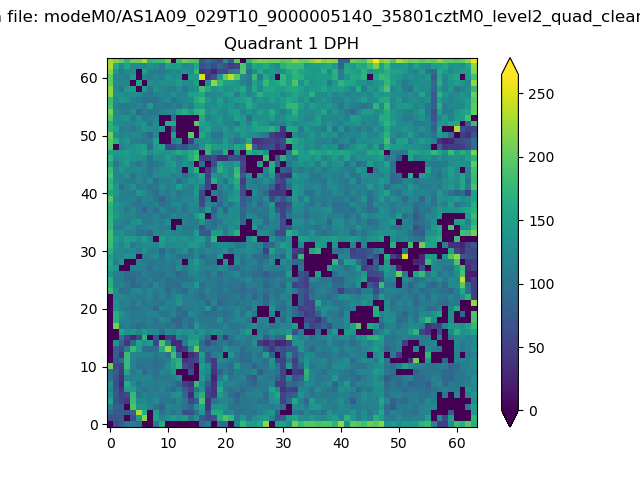 |
Quadrant B |
|---|---|---|---|
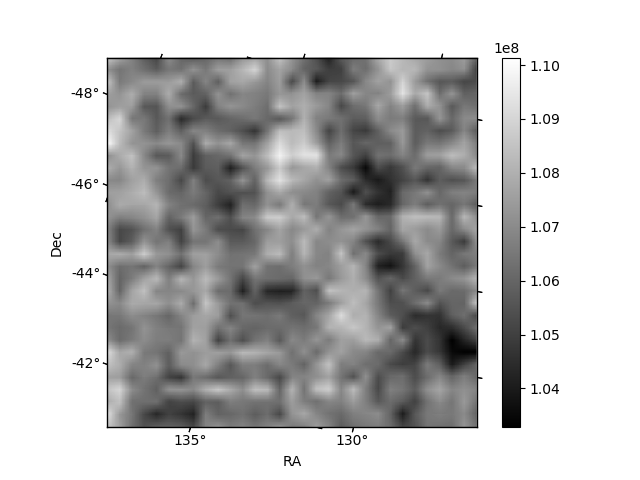
| Quadrant D | 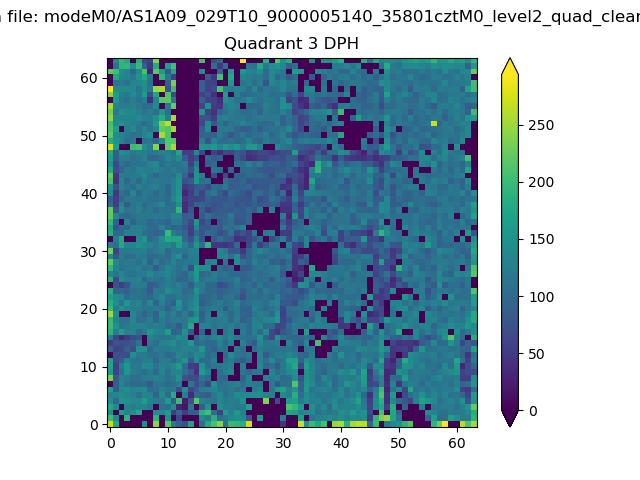 |
 |
Quadrant C |
| Plot type | Count rate plots | Images |
|---|---|---|
| Comparison with Poisson distribution Blue bars denote a histogram of data divided into 1 sec bins. Red curve is a Poisson curve with rate = median count rate of data. |
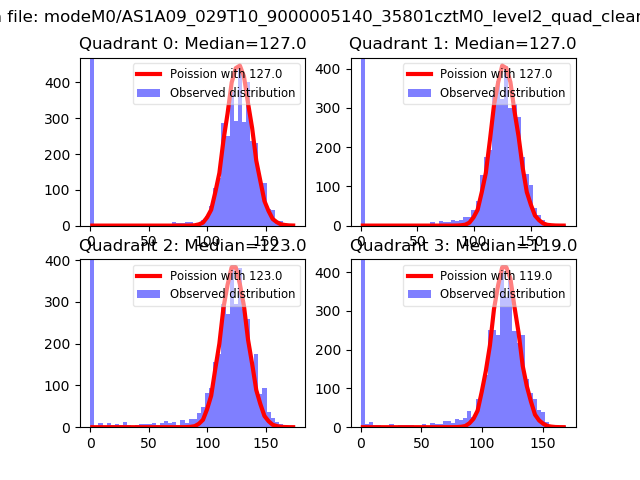 |
 |
| Quadrant-wise count rates Data is divided into 100 sec bins |
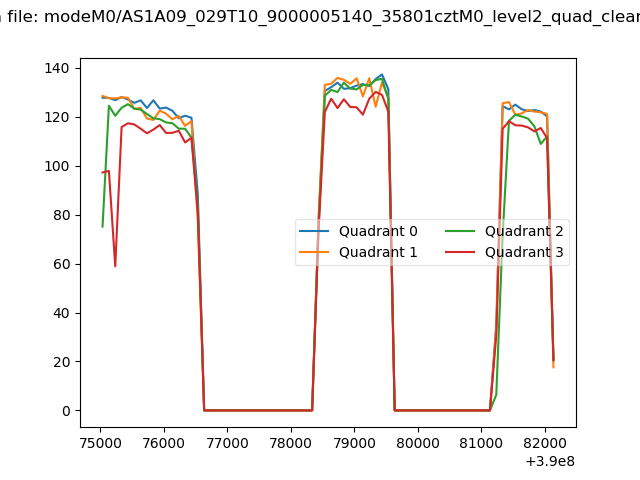 |
|
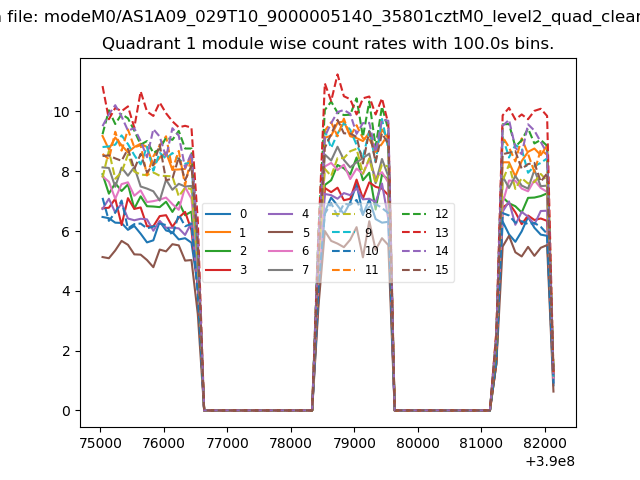
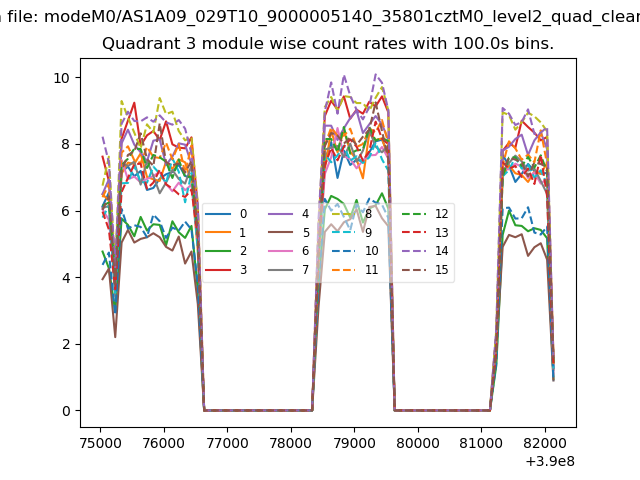
| Module-wise count rates for Quadrant A Data is divided into 100 sec bins |
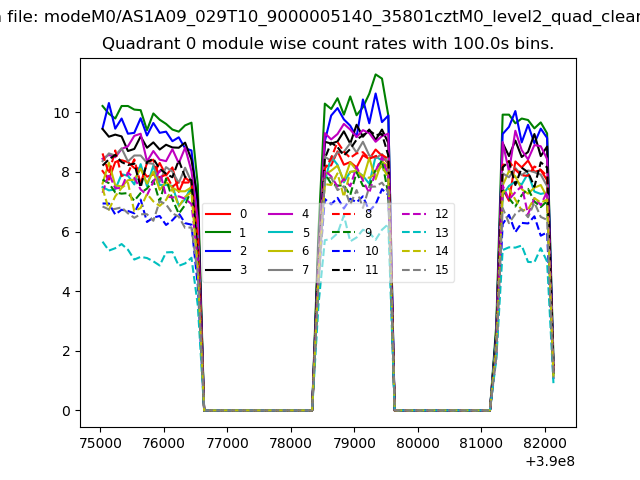 |
 |
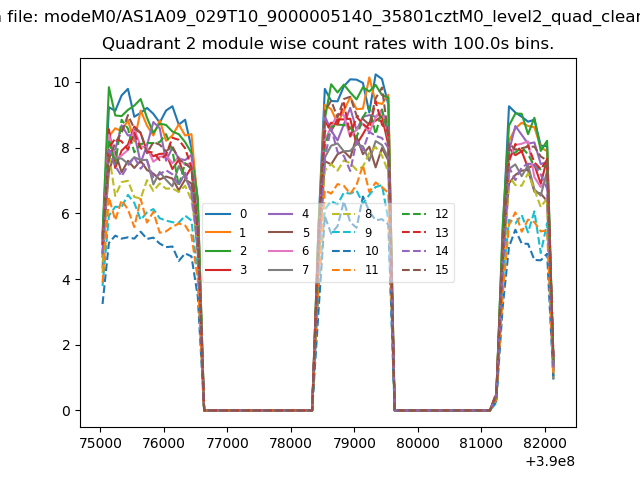
| Module-wise count rates for Quadrant B Data is divided into 100 sec bins |
 |
 |
| Module-wise count rates for Quadrant C Data is divided into 100 sec bins |
 |
 |
| Module-wise count rates for Quadrant D Data is divided into 100 sec bins |
 |
 |
| Parameter | Plot |
|---|---|
| CZT HV Monitor | 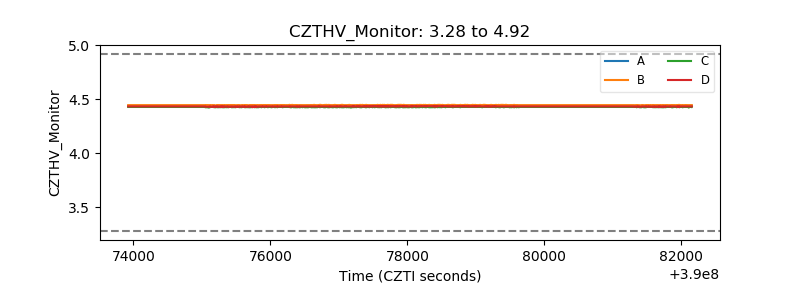 |
| D_VDD | 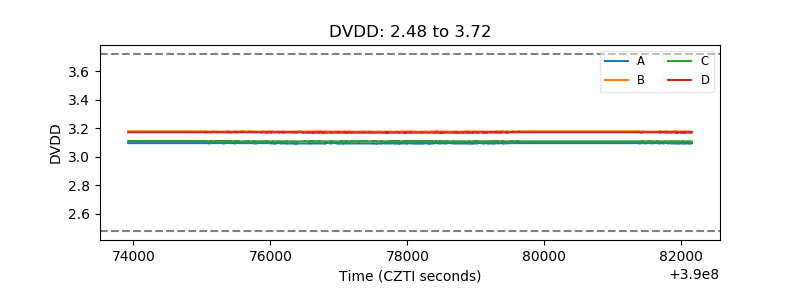 |
| Temperature 1 | 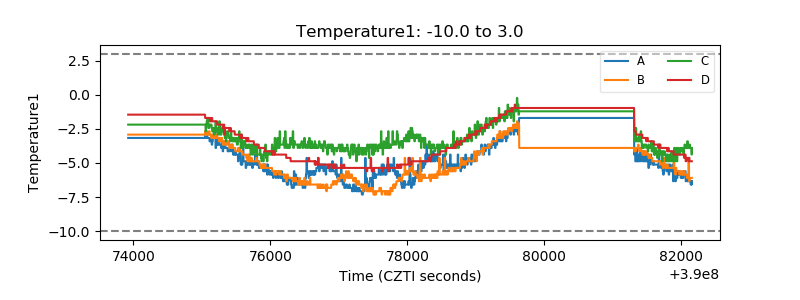 |
| Veto HV Monitor | 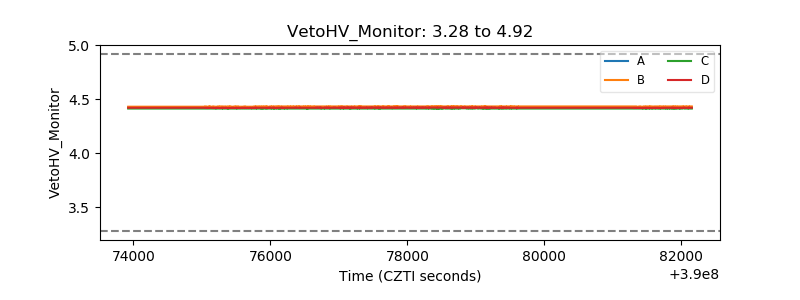 |
| Veto LLD | 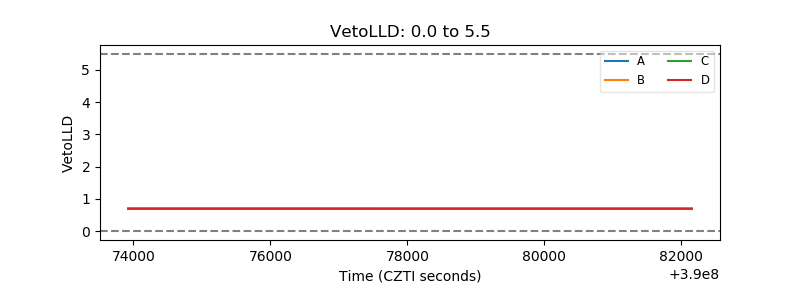 |
| Alpha Counter | 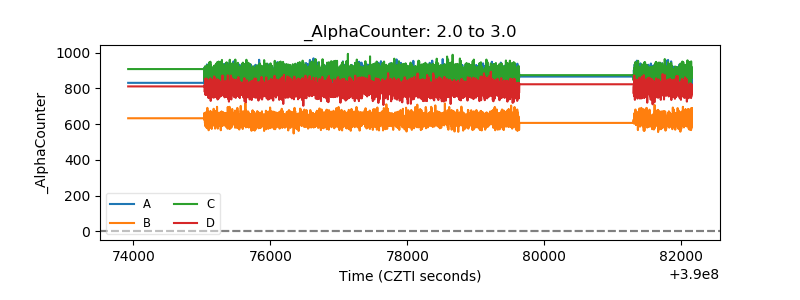 |
| _CPM_Rate | 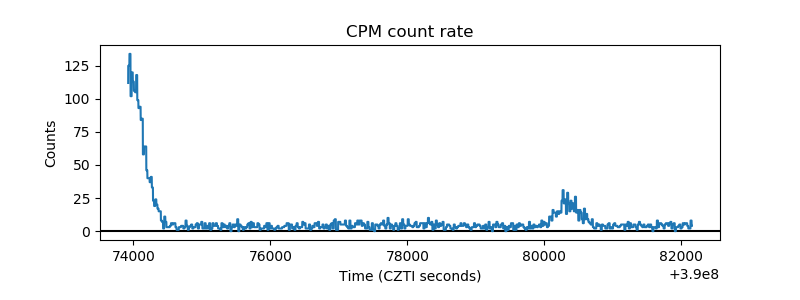 |
| CZT Counter | 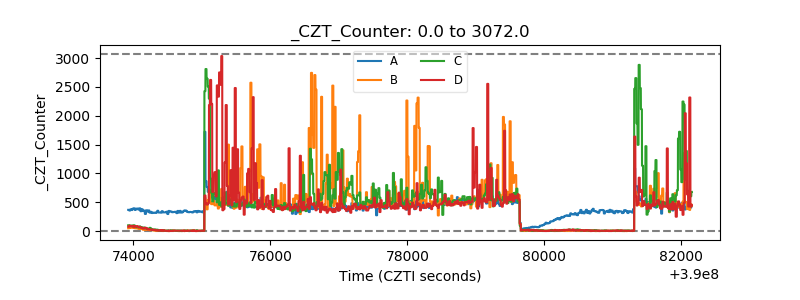 |
| +2.5 Volts monitor | 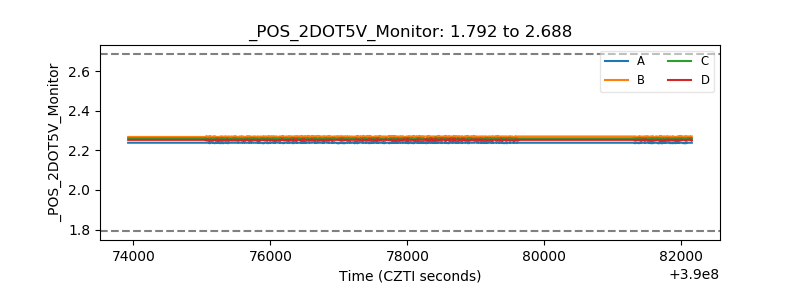 |
| +5 Volts monitor | 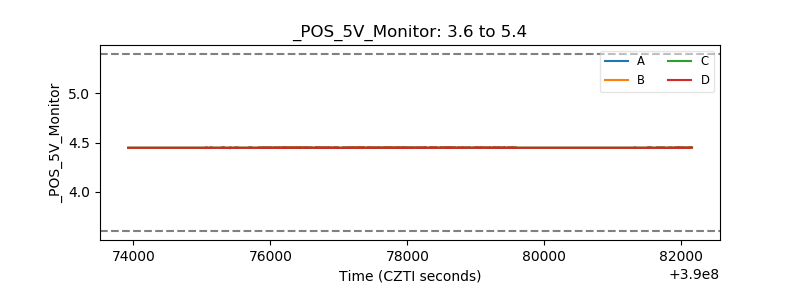 |
| _ROLL_ROT | 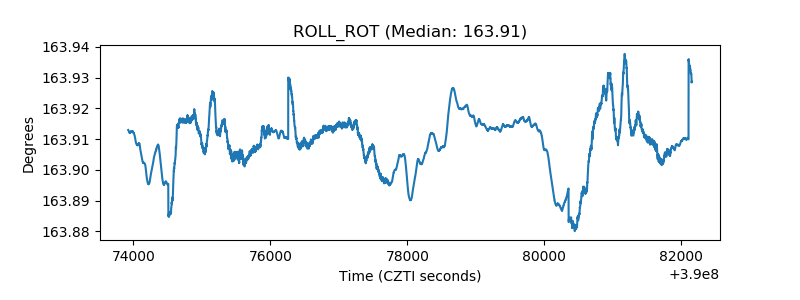 |
| _Roll_DEC | 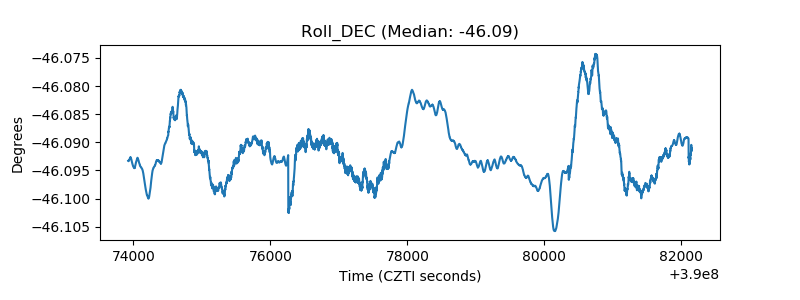 |
| _Roll_RA | 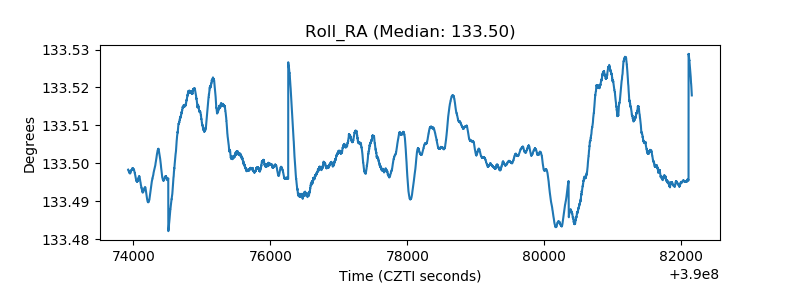 |
| Veto Counter | 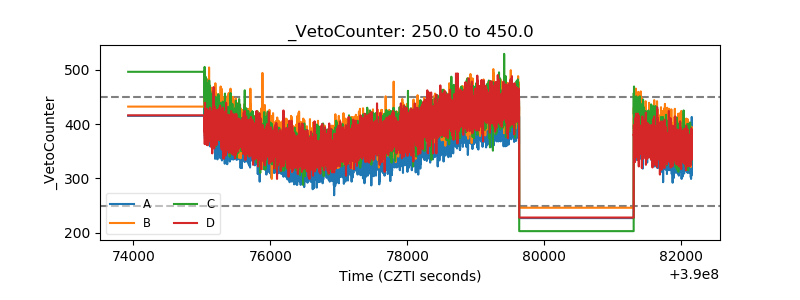 |