| Param | Original file | Final file |
|---|---|---|
| Filename | modeM0/AS1A09_029T10_9000005140_35796cztM0_level2.evt | modeM0/AS1A09_029T10_9000005140_35796cztM0_level2_quad_clean.evt |
| Size (bytes) | 150,557,760 | 26,009,280 |
| Size | 143.6 MB | 24.8 MB |
| Events in quadrant A | 1,023,718 | 173,227 |
| Events in quadrant B | 1,179,889 | 168,620 |
| Events in quadrant C | 1,065,381 | 161,379 |
| Events in quadrant D | 1,172,703 | 158,997 |
| Mode M0 | |||
|---|---|---|---|
| Quadrant | BADHDUFLAG | Total packets | Discarded packets |
| A | 0 | 4135 | 2 |
| B | 0 | 4583 | 1 |
| C | 0 | 4210 | 1 |
| D | 0 | 4598 | 1 |
| Mode M9 | |||
|---|---|---|---|
| Quadrant | BADHDUFLAG | Total packets | Discarded packets |
| A | 0 | 20 | 0 |
| B | 0 | 20 | 0 |
| C | 0 | 20 | 0 |
| D | 0 | 20 | 0 |
| Mode SS | |||
|---|---|---|---|
| Quadrant | BADHDUFLAG | Total packets | Discarded packets |
| A | 0 | 34 | 0 |
| B | 0 | 34 | 0 |
| C | 0 | 34 | 0 |
| D | 0 | 34 | 0 |
| Quadrant | Total seconds | Saturated seconds | Saturation percentage |
|---|---|---|---|
| A | 1707 | 5 | 0.292912% |
| B | 1707 | 77 | 4.510838% |
| C | 1707 | 57 | 3.339192% |
| D | 1707 | 74 | 4.335091% |
Noise dominated data is calculated using 1-second bins in cleaned event files. If a bin has >2000 counts, and if more than 50% of those come from <1% of pixels, then it is considered to be noise-dominated and hence unusable.
| Quadrant | # 1 sec bins | Bins with >0 counts | Bins with >2000 counts | High rate bins dominated by noise | Noise dominated (total time) | Noise dominated (detector-on time) | Marked lightcurve |
|---|---|---|---|---|---|---|---|
| A | 3650 | 1708 | 0 | 0 | 0.00% | 0.00% | 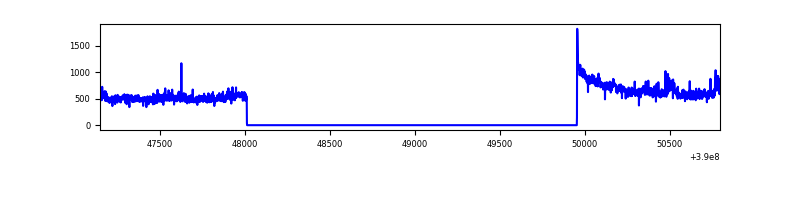 |
| B | 3650 | 1708 | 50 | 50 | 1.37% | 2.93% | 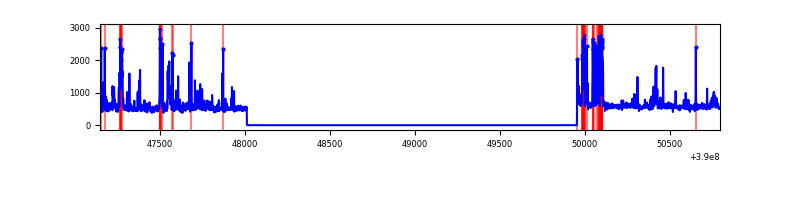 |
| C | 3650 | 1708 | 42 | 42 | 1.15% | 2.46% | 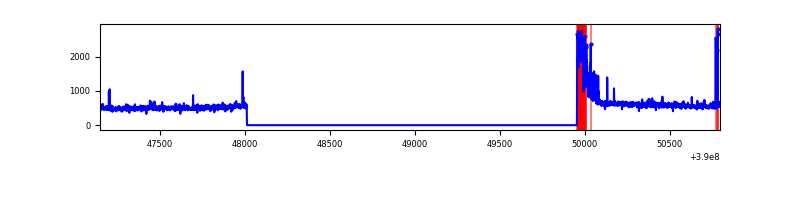 |
| D | 3650 | 1708 | 74 | 74 | 2.03% | 4.33% | 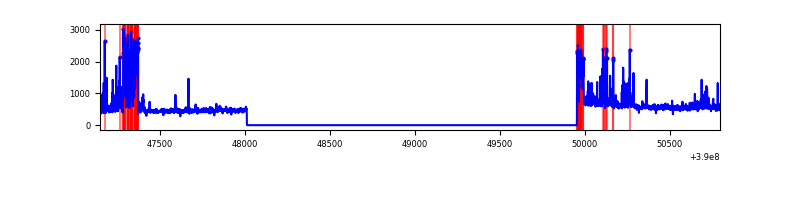 |
Top three noisy pixels from each quadrant. If the there are fewer than three noisy pixels in the level2.evt file, extra rows are filled as -1
| Pixel properties | Quadrant properties | ||||||
|---|---|---|---|---|---|---|---|
| Quadrant | DetID | PixID | Counts | Sigma | Mean | Median | Sigma |
| A | 15 | 169 | 78885 | 1674.82 | 228 | 224 | 47.0 |
| A | 10 | 83 | 63236 | 1341.63 | 228 | 224 | 47.0 |
| A | 13 | 6 | 3543 | 70.67 | 228 | 224 | 47.0 |
| B | 5 | 255 | 156845 | 3608.33 | 220 | 215 | 43.4 |
| B | 5 | 172 | 96129 | 2209.6 | 220 | 215 | 43.4 |
| B | 4 | 171 | 22004 | 501.96 | 220 | 215 | 43.4 |
| C | 0 | 10 | 142522 | 2821.93 | 212 | 214 | 50.4 |
| C | 15 | 214 | 73150 | 1446.3 | 212 | 214 | 50.4 |
| C | 0 | 207 | 19273 | 377.94 | 212 | 214 | 50.4 |
| D | 13 | 249 | 148601 | 2759.17 | 217 | 211 | 53.8 |
| D | 12 | 6 | 115669 | 2146.83 | 217 | 211 | 53.8 |
| D | 2 | 250 | 22907 | 422.01 | 217 | 211 | 53.8 |
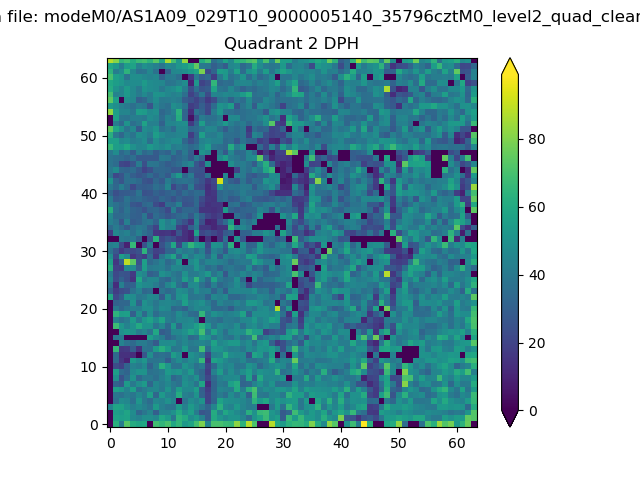
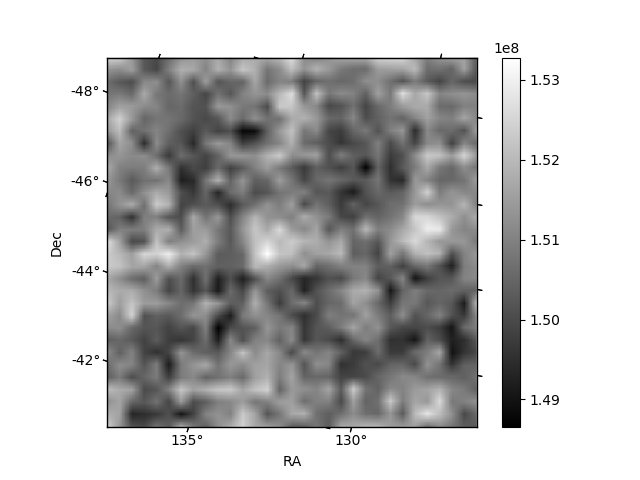
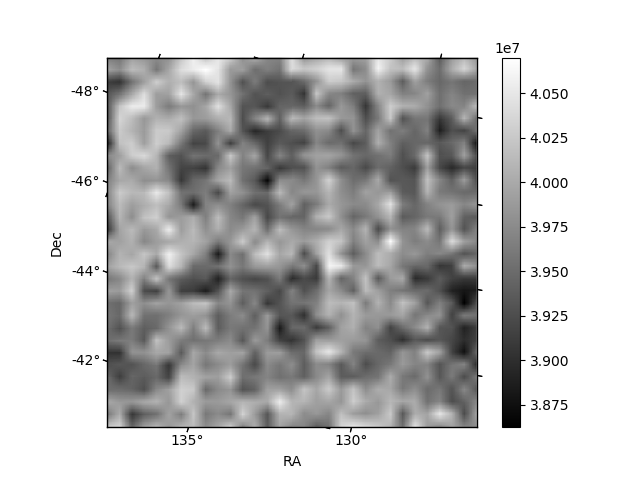
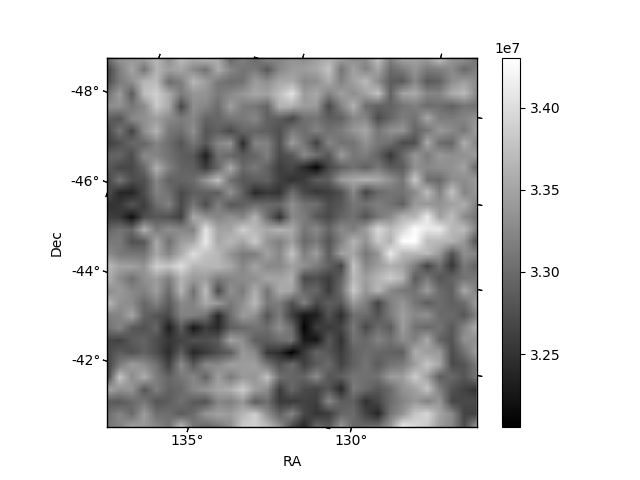
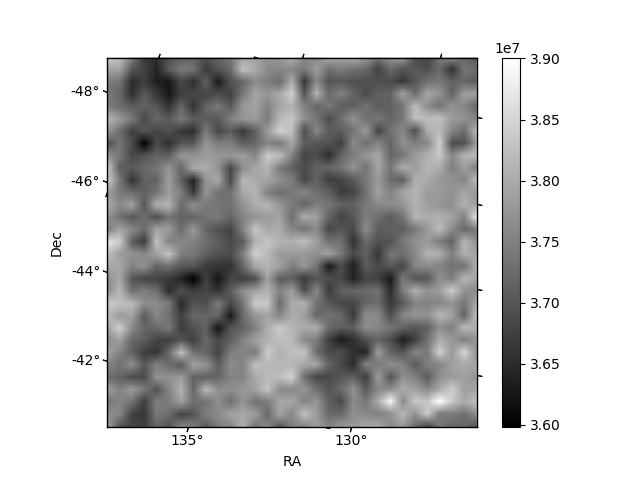
Histogram calculated using DETX and DETY for each event in the final _common_clean file
| Quadrant A | 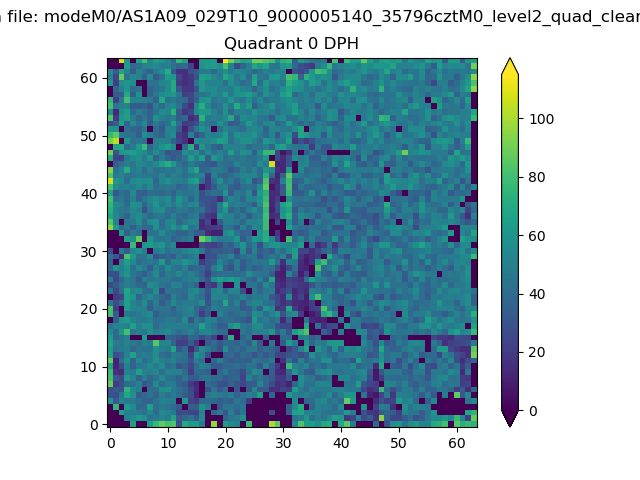 |
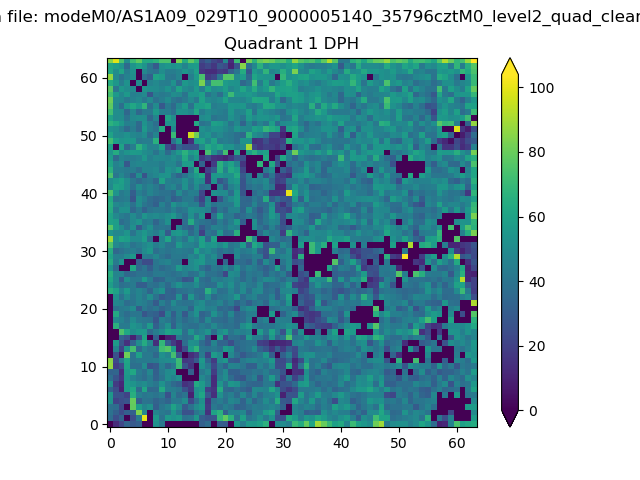 |
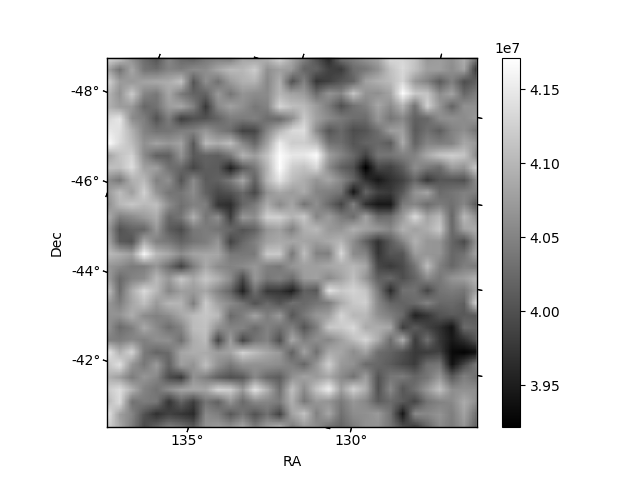
Quadrant B |
|---|---|---|---|
| Quadrant D | 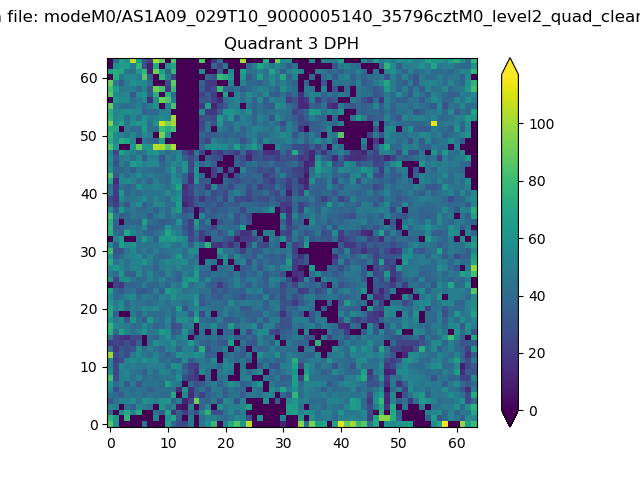 |
 |
Quadrant C |
| Plot type | Count rate plots | Images |
|---|---|---|
| Comparison with Poisson distribution Blue bars denote a histogram of data divided into 1 sec bins. Red curve is a Poisson curve with rate = median count rate of data. |
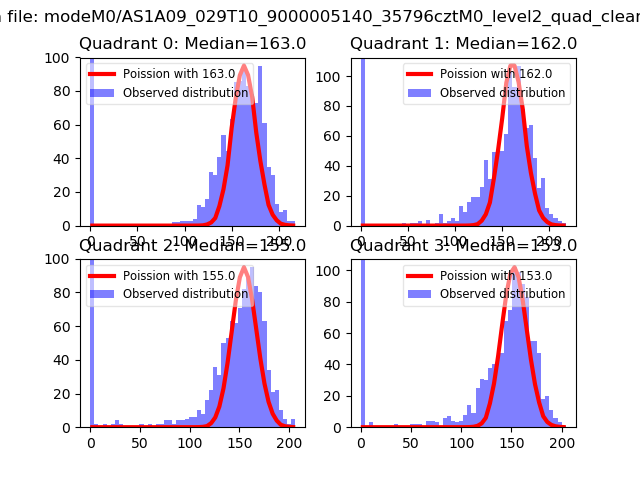 |
 |
| Quadrant-wise count rates Data is divided into 100 sec bins |
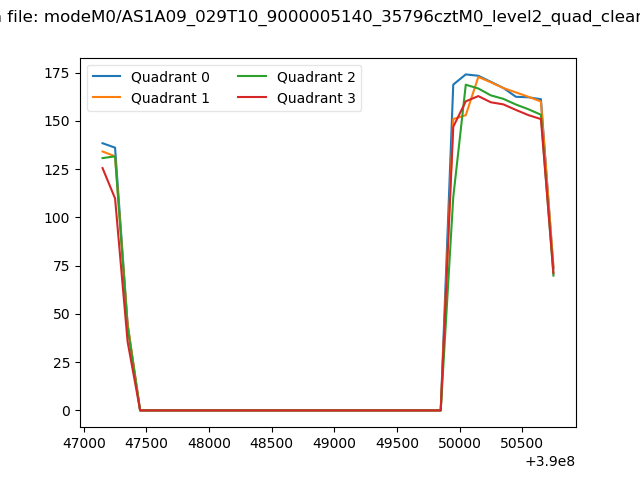 |
|
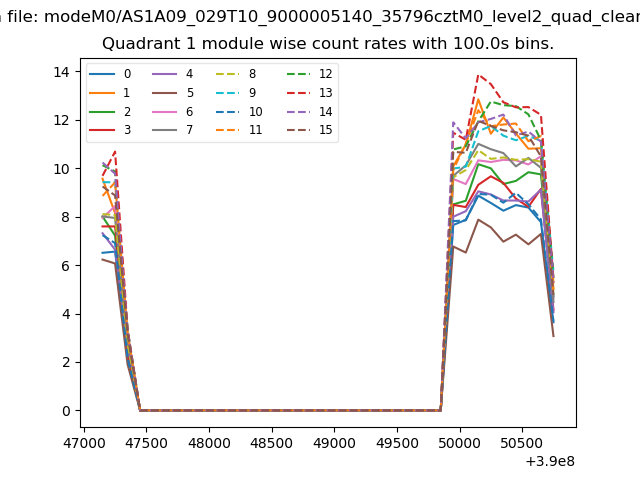
| Module-wise count rates for Quadrant A Data is divided into 100 sec bins |
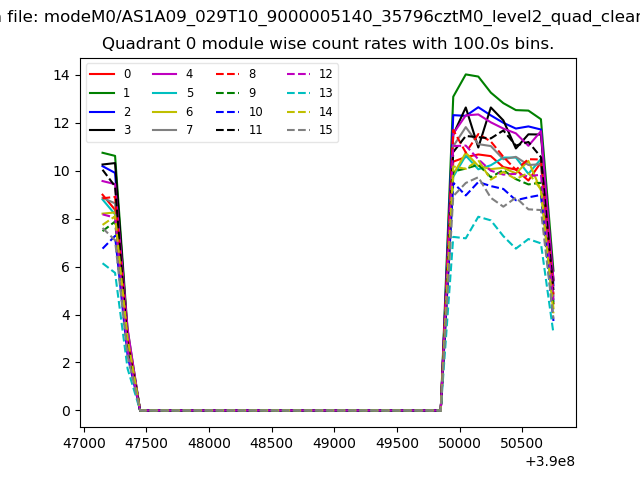 |
 |
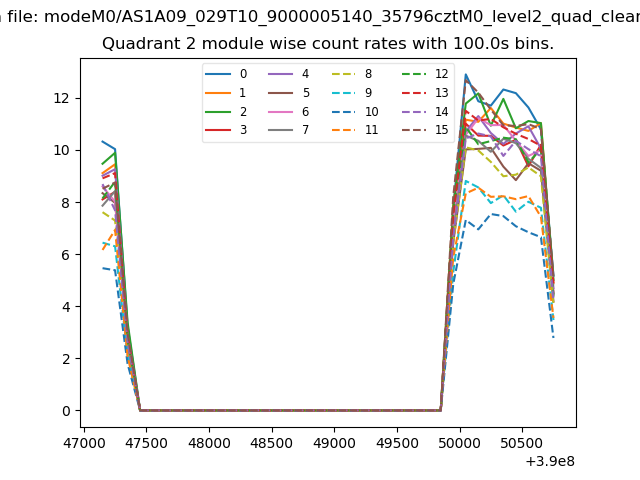
| Module-wise count rates for Quadrant B Data is divided into 100 sec bins |
 |
 |
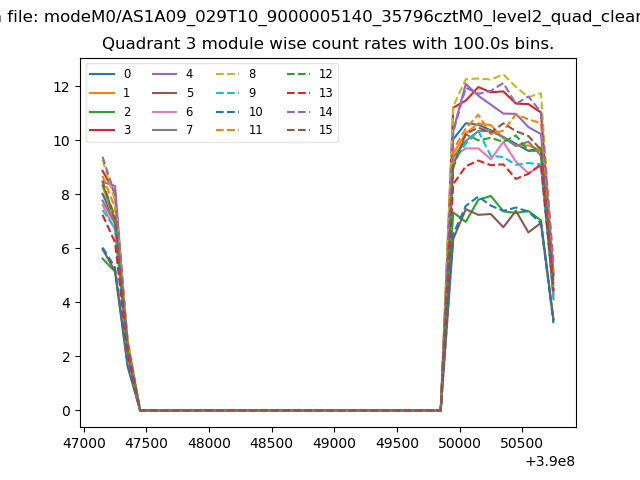
| Module-wise count rates for Quadrant C Data is divided into 100 sec bins |
 |
 |
| Module-wise count rates for Quadrant D Data is divided into 100 sec bins |
 |
 |
| Parameter | Plot |
|---|---|
| CZT HV Monitor | 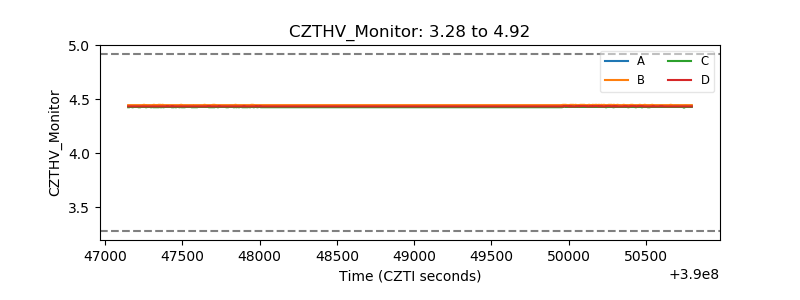 |
| D_VDD | 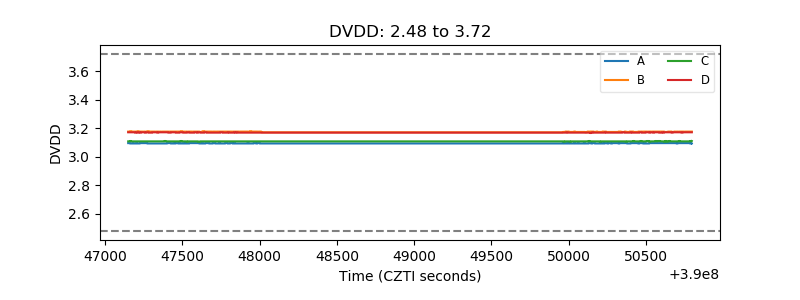 |
| Temperature 1 | 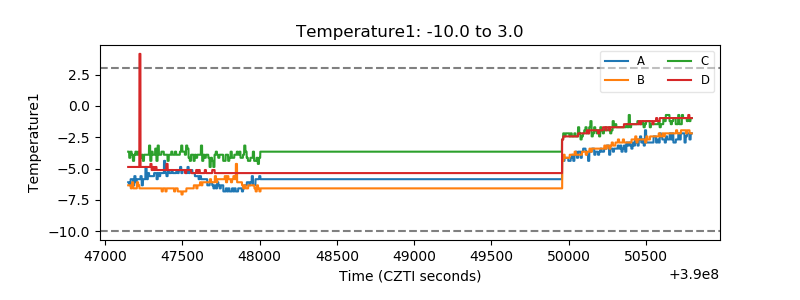 |
| Veto HV Monitor | 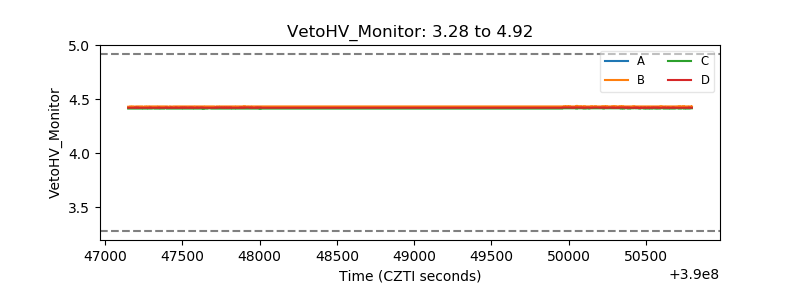 |
| Veto LLD | 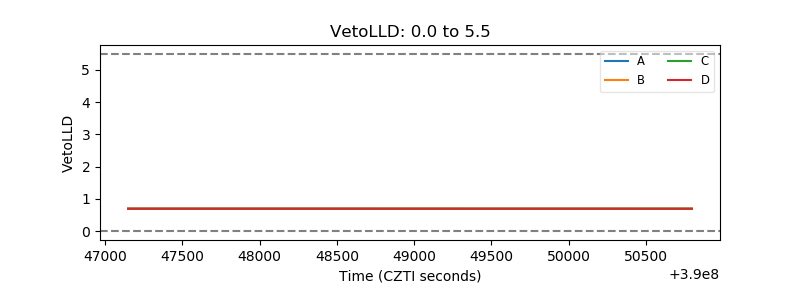 |
| Alpha Counter | 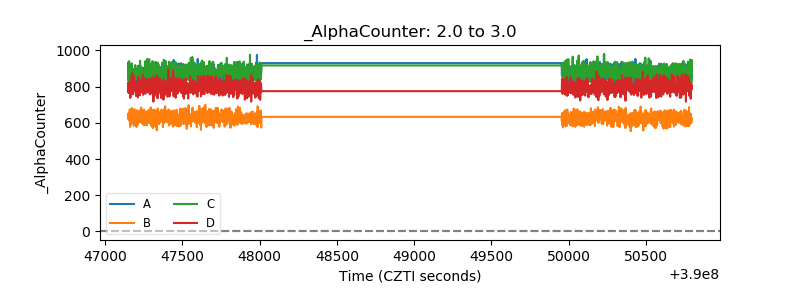 |
| _CPM_Rate | 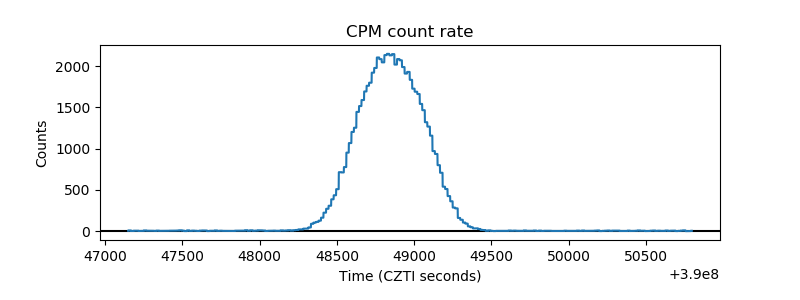 |
| CZT Counter | 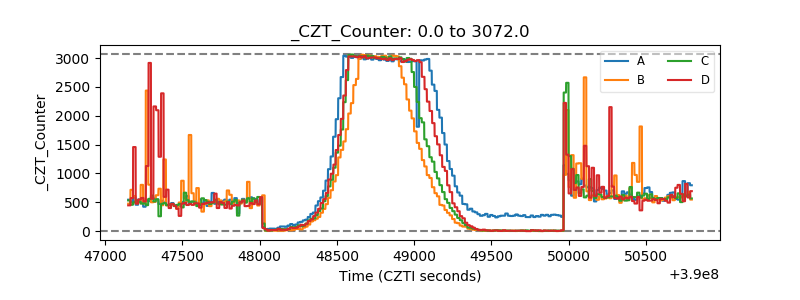 |
| +2.5 Volts monitor | 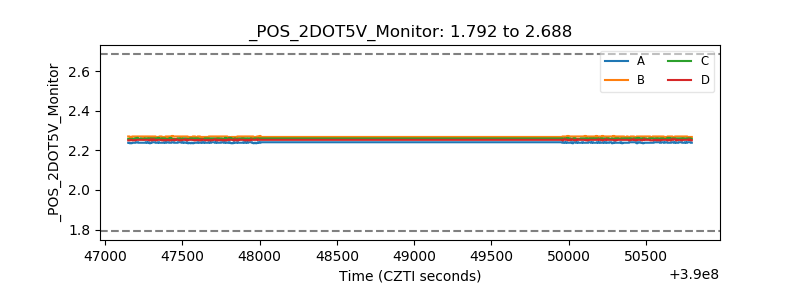 |
| +5 Volts monitor | 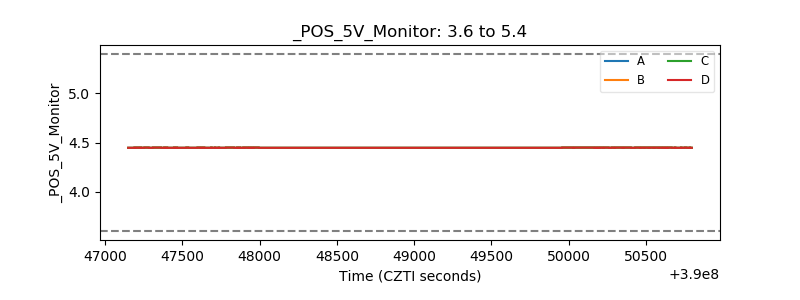 |
| _ROLL_ROT | 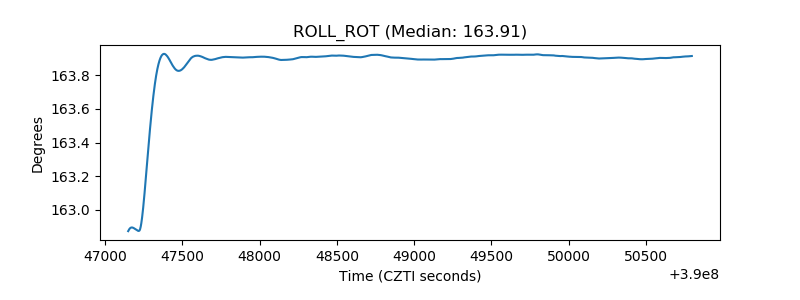 |
| _Roll_DEC | 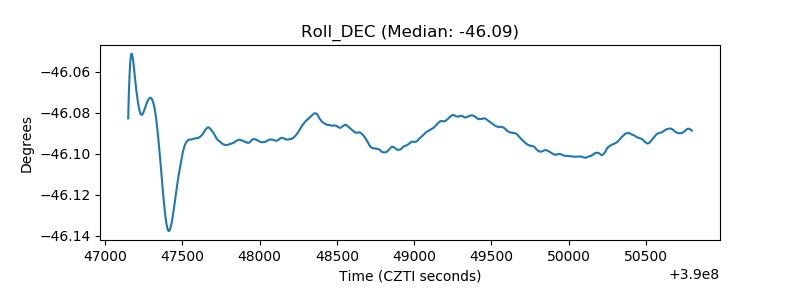 |
| _Roll_RA | 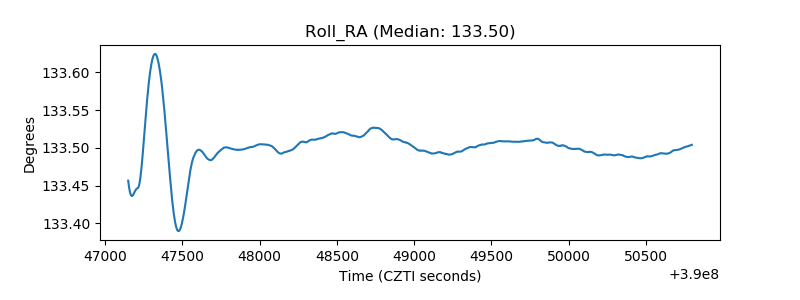 |
| Veto Counter | 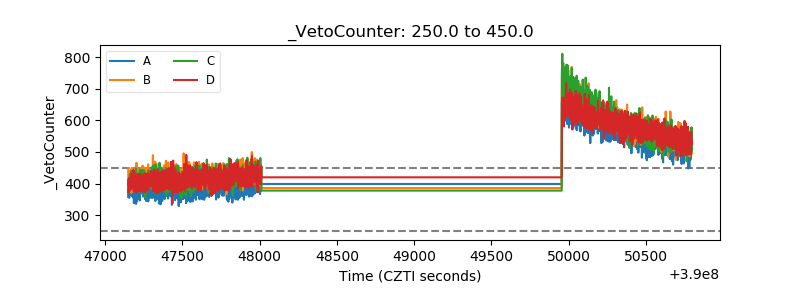 |