| Param | Original file | Final file |
|---|---|---|
| Filename | modeM0/AS1A09_029T09_9000005138_35793cztM0_level2.evt | modeM0/AS1A09_029T09_9000005138_35793cztM0_level2_quad_clean.evt |
| Size (bytes) | 510,197,760 | 91,094,400 |
| Size | 486.6 MB | 86.9 MB |
| Events in quadrant A | 4,547,365 | 597,412 |
| Events in quadrant B | 3,864,890 | 603,107 |
| Events in quadrant C | 2,906,668 | 606,710 |
| Events in quadrant D | 3,759,363 | 566,158 |
| Mode SS | |||
|---|---|---|---|
| Quadrant | BADHDUFLAG | Total packets | Discarded packets |
| A | 0 | 112 | 0 |
| B | 0 | 112 | 0 |
| C | 0 | 112 | 0 |
| D | 0 | 112 | 0 |
| Mode M0 | |||
|---|---|---|---|
| Quadrant | BADHDUFLAG | Total packets | Discarded packets |
| A | 0 | 17260 | 3 |
| B | 0 | 15132 | 2 |
| C | 0 | 12003 | 2 |
| D | 0 | 14543 | 2 |
| Mode M9 | |||
|---|---|---|---|
| Quadrant | BADHDUFLAG | Total packets | Discarded packets |
| A | 0 | 18 | 0 |
| B | 0 | 18 | 0 |
| C | 0 | 18 | 0 |
| D | 0 | 19 | 0 |
| Quadrant | Total seconds | Saturated seconds | Saturation percentage |
|---|---|---|---|
| A | 5504 | 293 | 5.323401% |
| B | 5504 | 322 | 5.850291% |
| C | 5504 | 62 | 1.126453% |
| D | 5504 | 238 | 4.324128% |
Noise dominated data is calculated using 1-second bins in cleaned event files. If a bin has >2000 counts, and if more than 50% of those come from <1% of pixels, then it is considered to be noise-dominated and hence unusable.
| Quadrant | # 1 sec bins | Bins with >0 counts | Bins with >2000 counts | High rate bins dominated by noise | Noise dominated (total time) | Noise dominated (detector-on time) | Marked lightcurve |
|---|---|---|---|---|---|---|---|
| A | 7207 | 5505 | 245 | 245 | 3.40% | 4.45% | 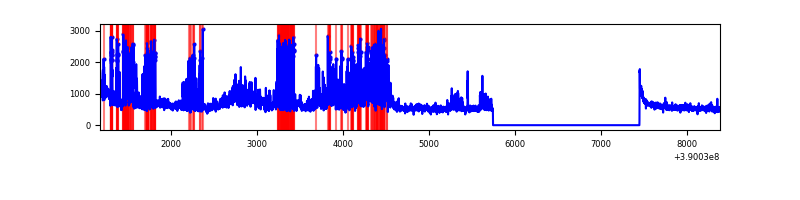 |
| B | 7207 | 5505 | 220 | 220 | 3.05% | 4.00% | 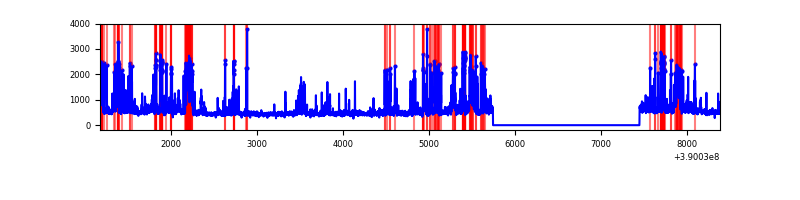 |
| C | 7207 | 5505 | 38 | 38 | 0.53% | 0.69% | 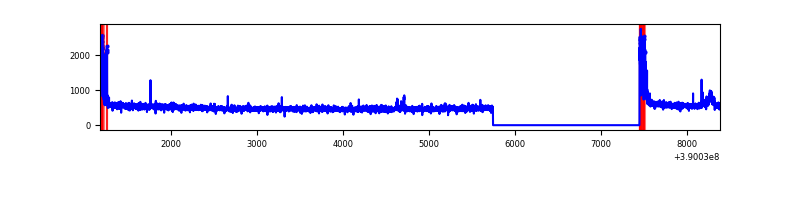 |
| D | 7207 | 5505 | 194 | 194 | 2.69% | 3.52% | 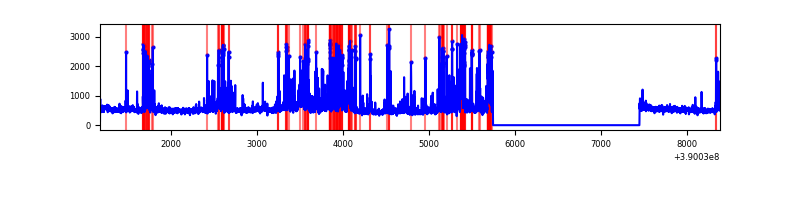 |
Top three noisy pixels from each quadrant. If the there are fewer than three noisy pixels in the level2.evt file, extra rows are filled as -1
| Pixel properties | Quadrant properties | ||||||
|---|---|---|---|---|---|---|---|
| Quadrant | DetID | PixID | Counts | Sigma | Mean | Median | Sigma |
| A | 15 | 169 | 1893754 | 14550.82 | 645 | 631 | 130.1 |
| A | 10 | 83 | 157603 | 1206.51 | 645 | 631 | 130.1 |
| A | 3 | 137 | 6331 | 43.81 | 645 | 631 | 130.1 |
| B | 5 | 172 | 649595 | 5348.9 | 635 | 620 | 121.3 |
| B | 4 | 171 | 371978 | 3060.76 | 635 | 620 | 121.3 |
| B | 5 | 255 | 182768 | 1501.28 | 635 | 620 | 121.3 |
| C | 15 | 214 | 231176 | 1584.8 | 631 | 634 | 145.5 |
| C | 0 | 10 | 167938 | 1150.09 | 631 | 634 | 145.5 |
| C | 10 | 49 | 35300 | 238.3 | 631 | 634 | 145.5 |
| D | 13 | 249 | 719875 | 4686.95 | 627 | 609 | 153.5 |
| D | 8 | 195 | 266215 | 1730.77 | 627 | 609 | 153.5 |
| D | 7 | 223 | 93129 | 602.89 | 627 | 609 | 153.5 |
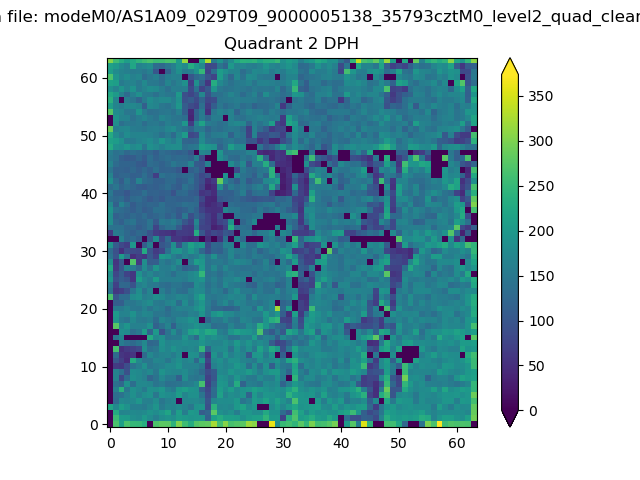
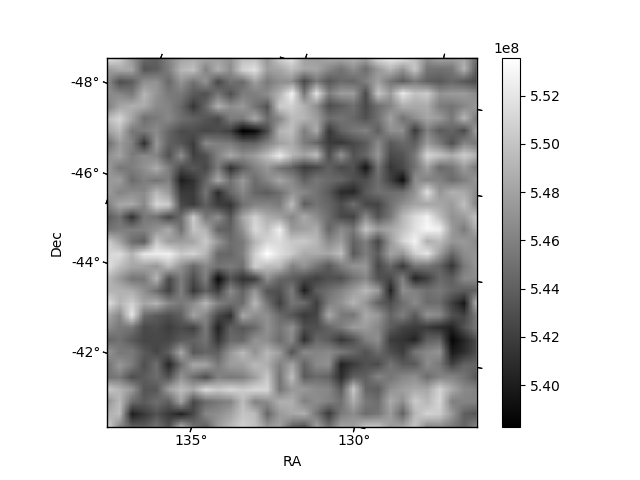
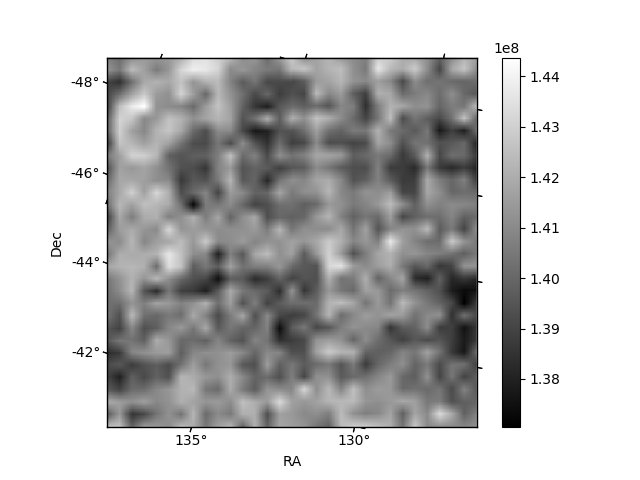
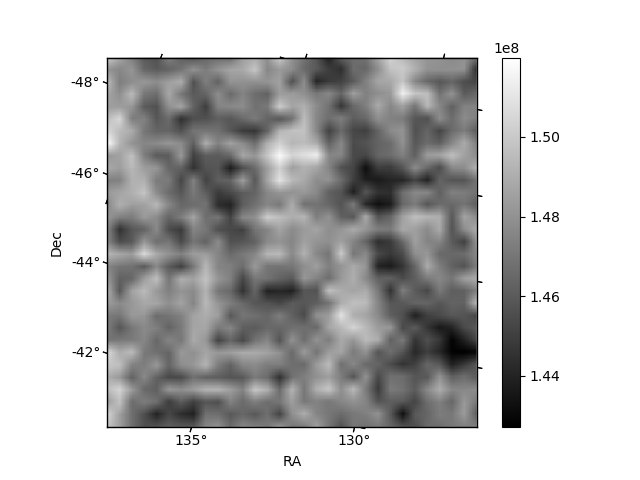
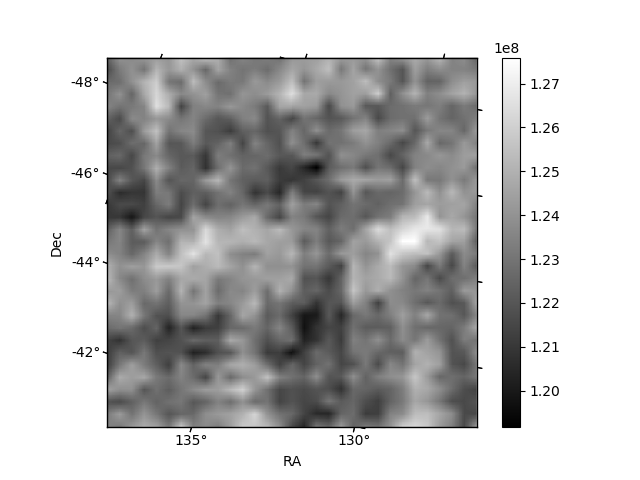
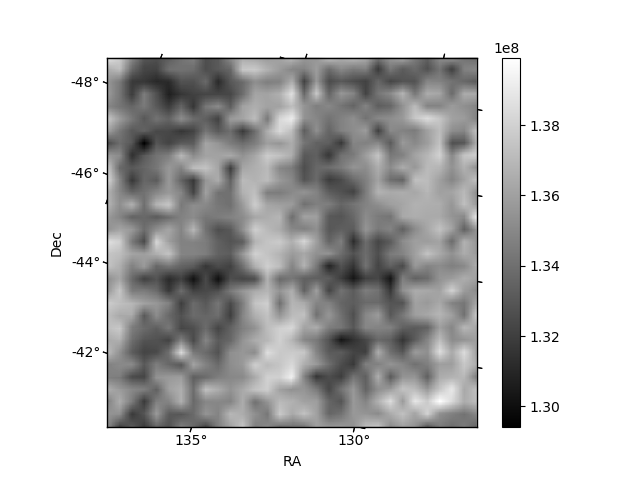
Histogram calculated using DETX and DETY for each event in the final _common_clean file
| Quadrant A |  |
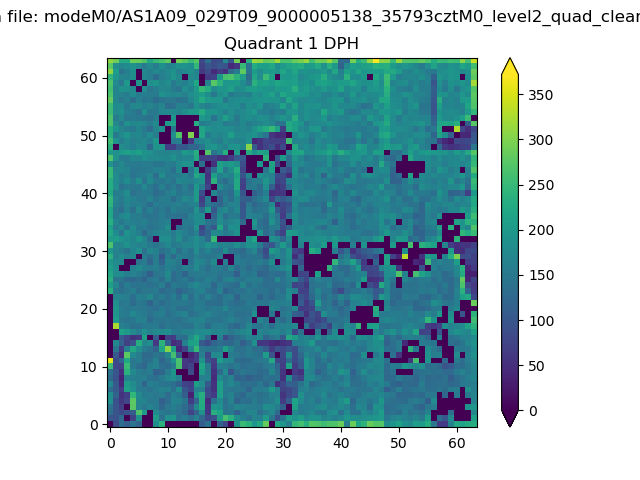 |
Quadrant B |
|---|---|---|---|
| Quadrant D | 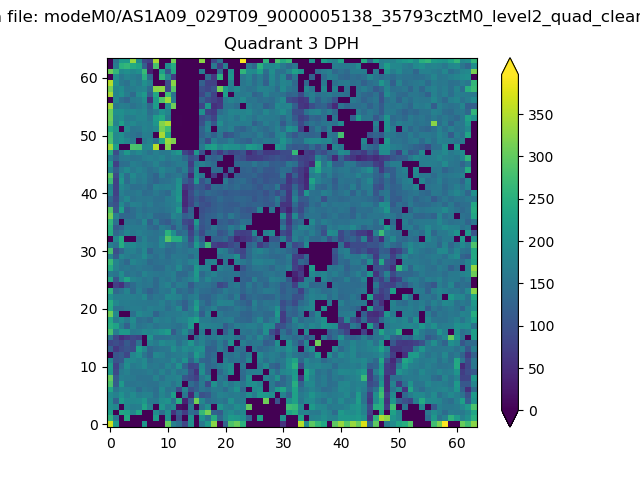 |
 |
Quadrant C |
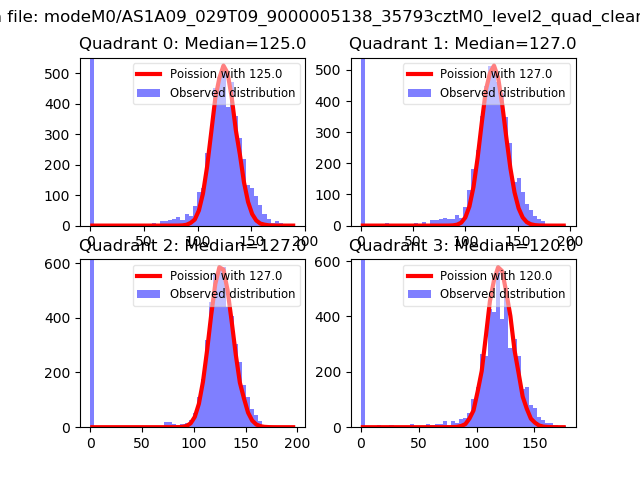
| Plot type | Count rate plots | Images |
|---|---|---|
| Comparison with Poisson distribution Blue bars denote a histogram of data divided into 1 sec bins. Red curve is a Poisson curve with rate = median count rate of data. |
 |
 |
| Quadrant-wise count rates Data is divided into 100 sec bins |
 |
|
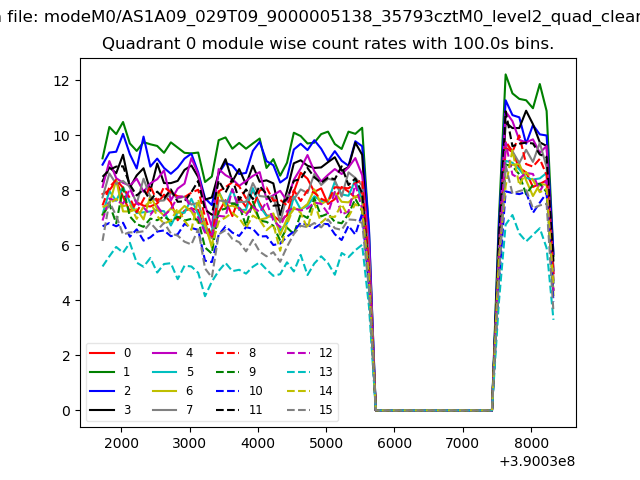
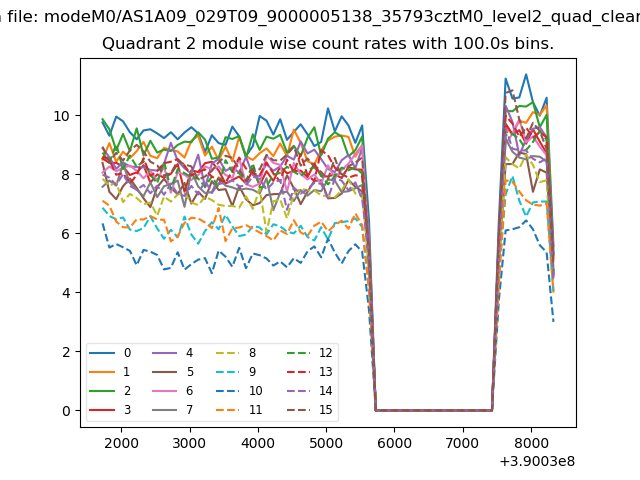
| Module-wise count rates for Quadrant A Data is divided into 100 sec bins |
 |
 |
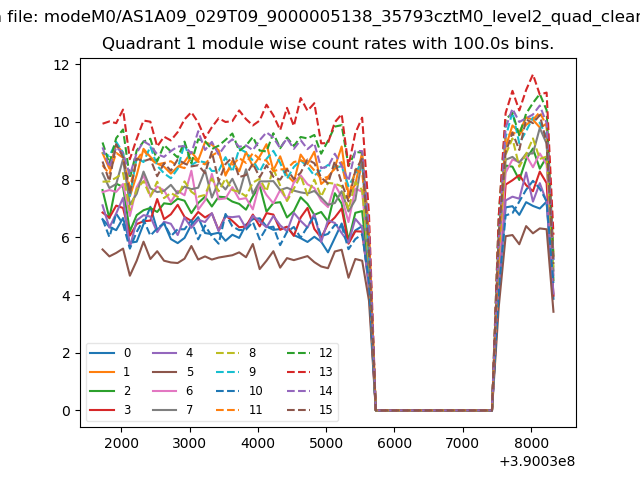
| Module-wise count rates for Quadrant B Data is divided into 100 sec bins |
 |
 |
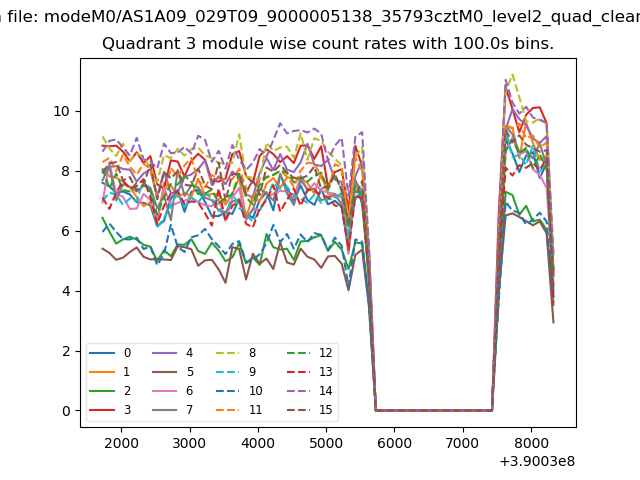
| Module-wise count rates for Quadrant C Data is divided into 100 sec bins |
 |
 |
| Module-wise count rates for Quadrant D Data is divided into 100 sec bins |
 |
 |
| Parameter | Plot |
|---|---|
| CZT HV Monitor | 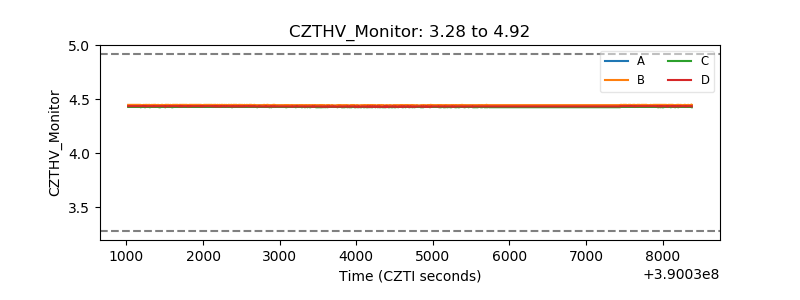 |
| D_VDD | 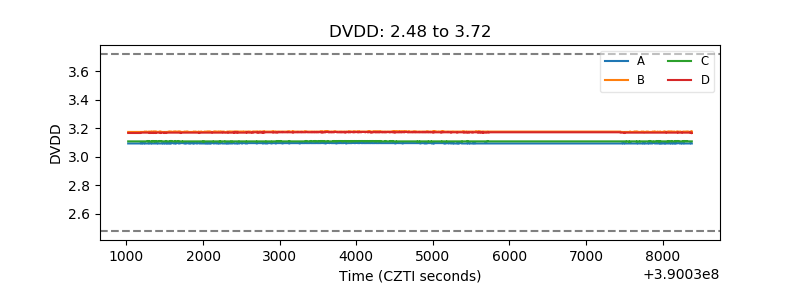 |
| Temperature 1 | 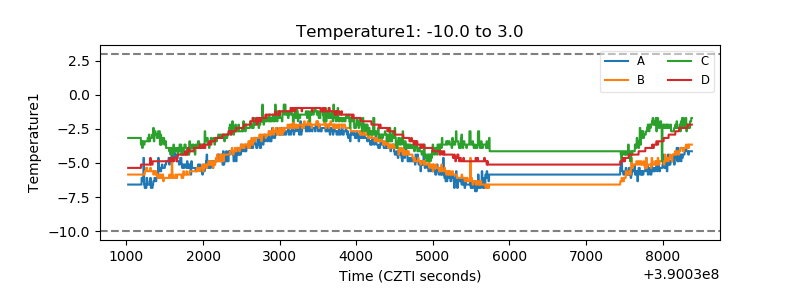 |
| Veto HV Monitor |  |
| Veto LLD | 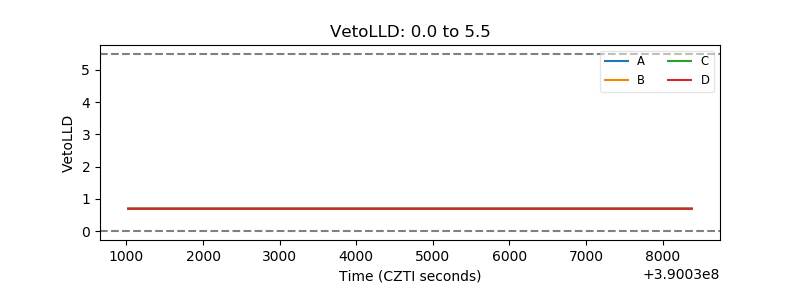 |
| Alpha Counter | 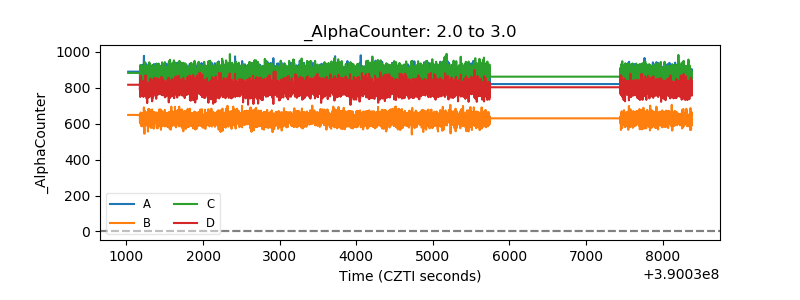 |
| _CPM_Rate | 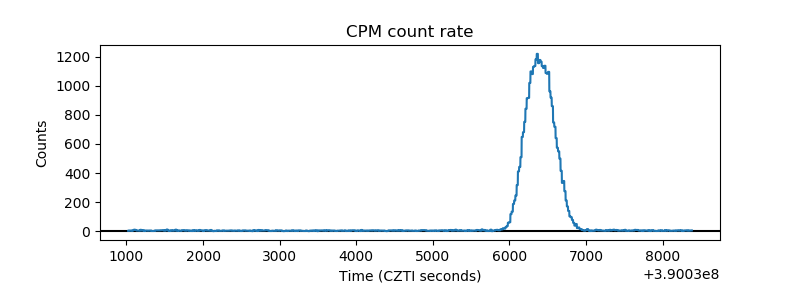 |
| CZT Counter | 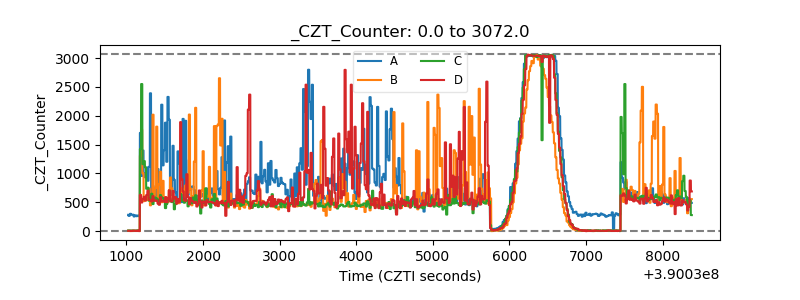 |
| +2.5 Volts monitor | 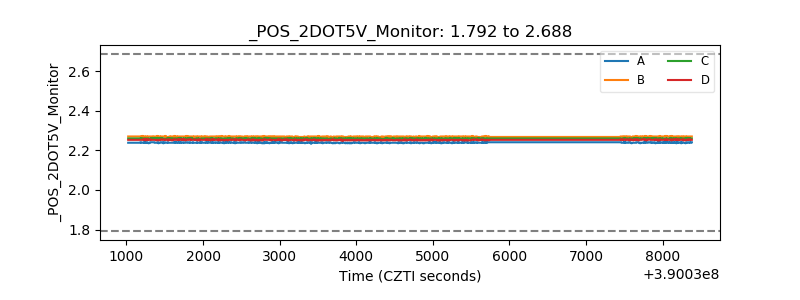 |
| +5 Volts monitor | 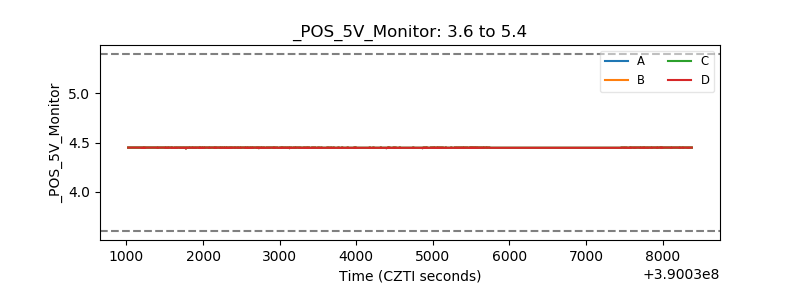 |
| _ROLL_ROT | 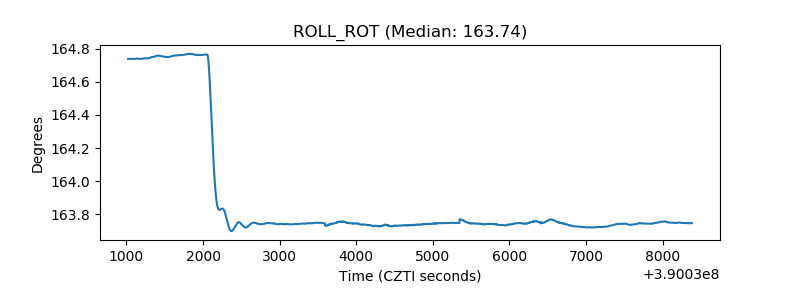 |
| _Roll_DEC | 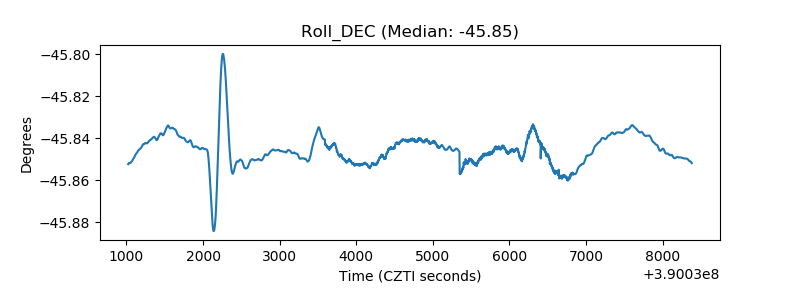 |
| _Roll_RA | 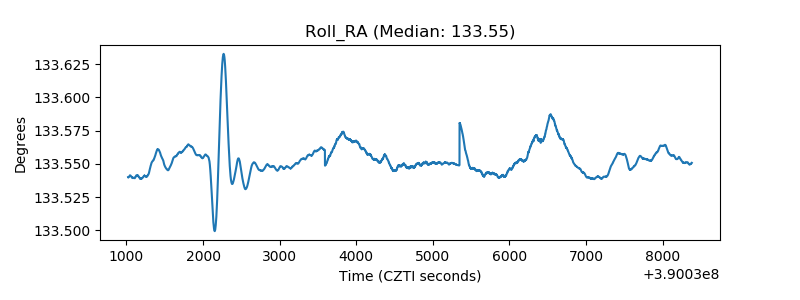 |
| Veto Counter | 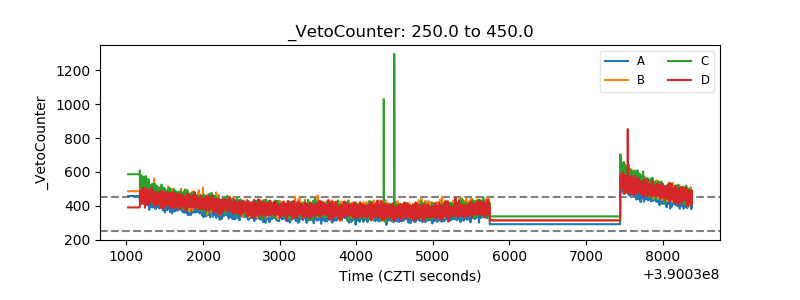 |