| Param | Original file | Final file |
|---|---|---|
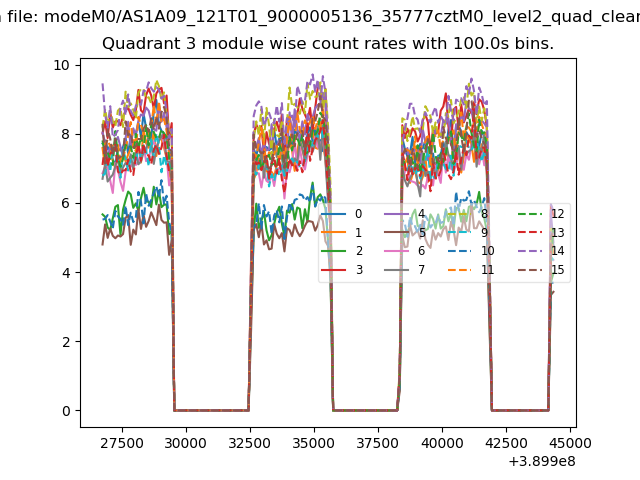
| Filename | modeM0/AS1A09_121T01_9000005136_35777cztM0_level2.evt | modeM0/AS1A09_121T01_9000005136_35777cztM0_level2_quad_clean.evt |
| Size (bytes) | 1,250,046,720 | 188,743,680 |
| Size | 1.2 GB | 180.0 MB |
| Events in quadrant A | 8,257,273 | 1,167,364 |
| Events in quadrant B | 8,782,978 | 1,184,885 |
| Events in quadrant C | 9,299,365 | 1,167,408 |
| Events in quadrant D | 10,463,806 | 1,118,784 |
| Mode M9 | |||
|---|---|---|---|
| Quadrant | BADHDUFLAG | Total packets | Discarded packets |
| A | 0 | 52 | 0 |
| B | 0 | 52 | 0 |
| C | 0 | 52 | 0 |
| D | 0 | 53 | 0 |
| Mode M0 | |||
|---|---|---|---|
| Quadrant | BADHDUFLAG | Total packets | Discarded packets |
| A | 0 | 34227 | 5 |
| B | 0 | 35983 | 4 |
| C | 0 | 36712 | 4 |
| D | 0 | 40917 | 4 |
| Mode SS | |||
|---|---|---|---|
| Quadrant | BADHDUFLAG | Total packets | Discarded packets |
| A | 0 | 318 | 0 |
| B | 0 | 318 | 0 |
| C | 0 | 318 | 0 |
| D | 0 | 318 | 0 |
| Quadrant | Total seconds | Saturated seconds | Saturation percentage |
|---|---|---|---|
| A | 15621 | 287 | 1.837270% |
| B | 15621 | 194 | 1.241918% |
| C | 15621 | 375 | 2.400615% |
| D | 15621 | 700 | 4.481147% |
Noise dominated data is calculated using 1-second bins in cleaned event files. If a bin has >2000 counts, and if more than 50% of those come from <1% of pixels, then it is considered to be noise-dominated and hence unusable.
| Quadrant | # 1 sec bins | Bins with >0 counts | Bins with >2000 counts | High rate bins dominated by noise | Noise dominated (total time) | Noise dominated (detector-on time) | Marked lightcurve |
|---|---|---|---|---|---|---|---|
| A | 19830 | 15624 | 218 | 218 | 1.10% | 1.40% | 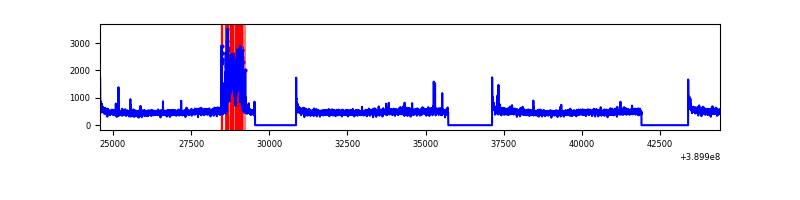 |
| B | 19830 | 15624 | 113 | 113 | 0.57% | 0.72% | 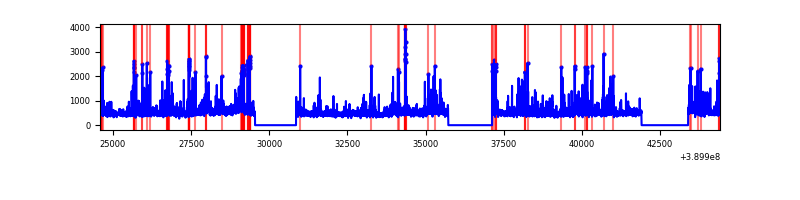 |
| C | 19830 | 15624 | 279 | 279 | 1.41% | 1.79% | 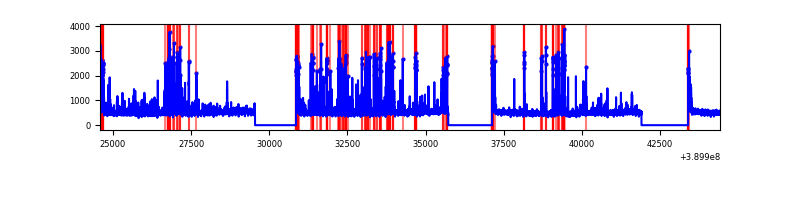 |
| D | 19830 | 15624 | 641 | 641 | 3.23% | 4.10% | 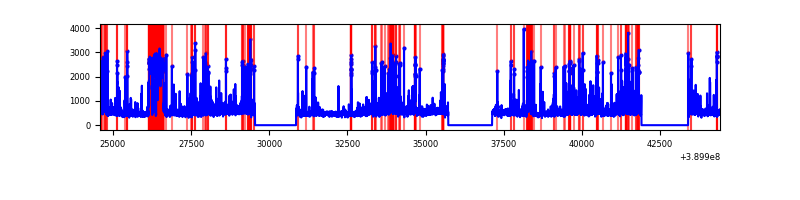 |
Top three noisy pixels from each quadrant. If the there are fewer than three noisy pixels in the level2.evt file, extra rows are filled as -1
| Pixel properties | Quadrant properties | ||||||
|---|---|---|---|---|---|---|---|
| Quadrant | DetID | PixID | Counts | Sigma | Mean | Median | Sigma |
| A | 15 | 237 | 789333 | 2154.5 | 1813 | 1773 | 365.5 |
| A | 10 | 83 | 402459 | 1096.14 | 1813 | 1773 | 365.5 |
| A | 13 | 6 | 32608 | 84.35 | 1813 | 1773 | 365.5 |
| B | 5 | 172 | 483790 | 1405.23 | 1807 | 1760 | 343.0 |
| B | 5 | 255 | 347935 | 1009.18 | 1807 | 1760 | 343.0 |
| B | 4 | 232 | 236819 | 685.25 | 1807 | 1760 | 343.0 |
| C | 1 | 23 | 1140107 | 2781.07 | 1758 | 1770 | 409.3 |
| C | 15 | 214 | 661213 | 1611.09 | 1758 | 1770 | 409.3 |
| C | 0 | 10 | 557920 | 1358.73 | 1758 | 1770 | 409.3 |
| D | 10 | 118 | 1255757 | 2947.42 | 1746 | 1697 | 425.5 |
| D | 8 | 195 | 687267 | 1611.3 | 1746 | 1697 | 425.5 |
| D | 13 | 249 | 521777 | 1222.35 | 1746 | 1697 | 425.5 |
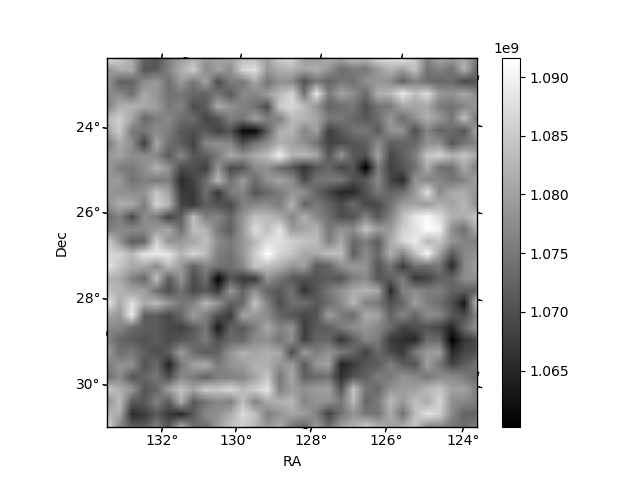
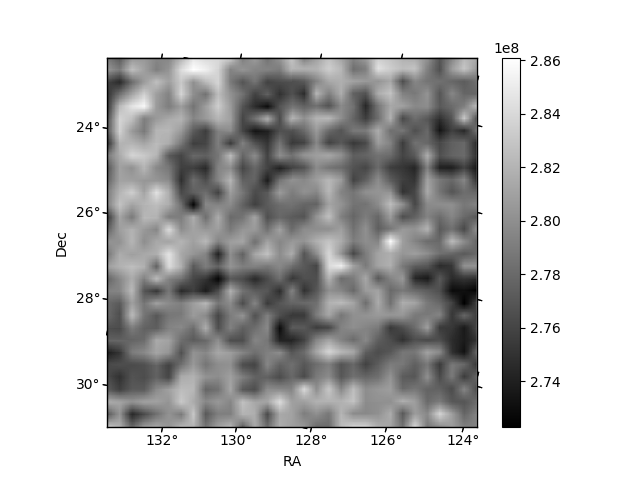
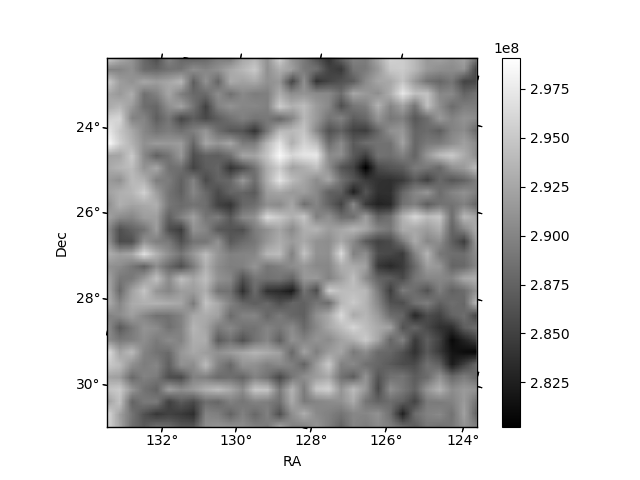
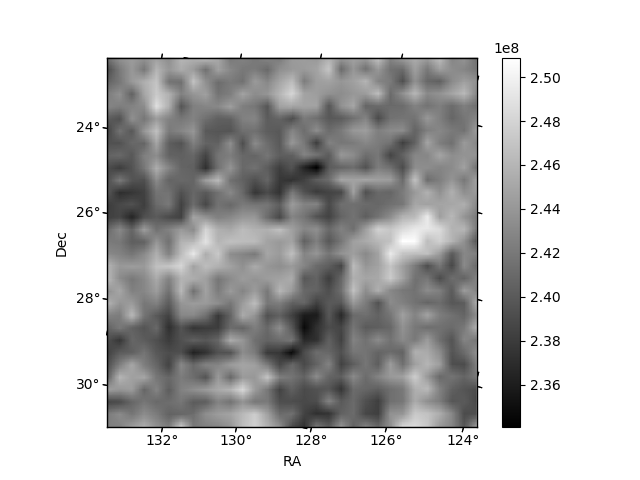
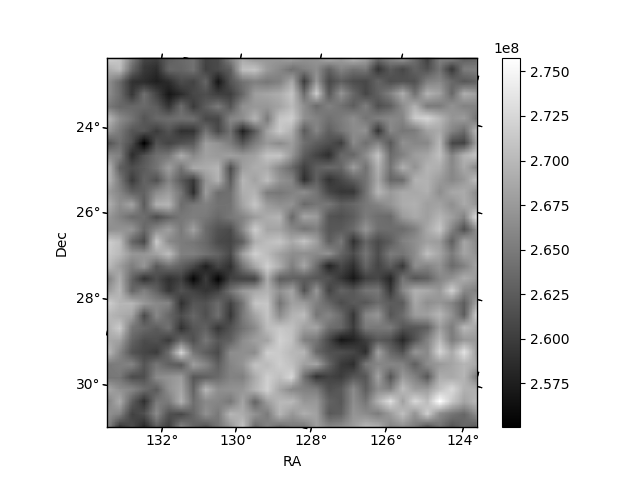
Histogram calculated using DETX and DETY for each event in the final _common_clean file
| Quadrant A | 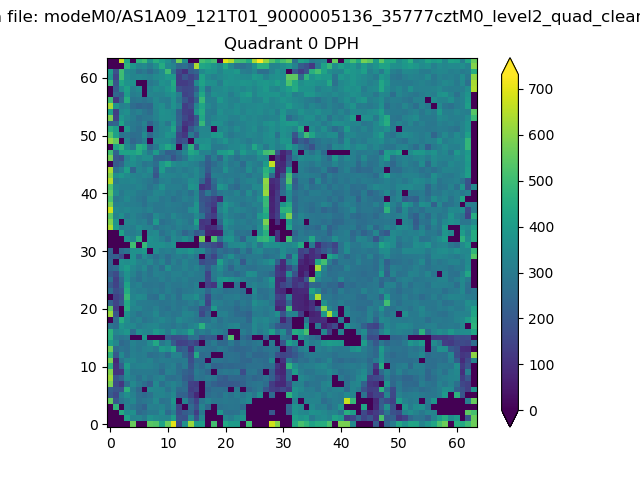 |
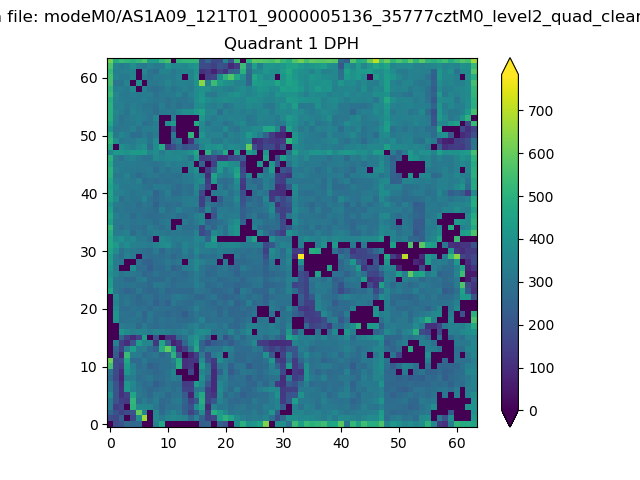 |
Quadrant B |
|---|---|---|---|
| Quadrant D | 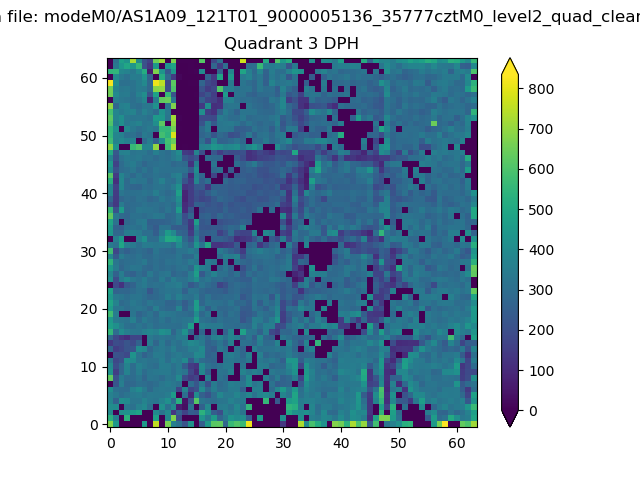 |
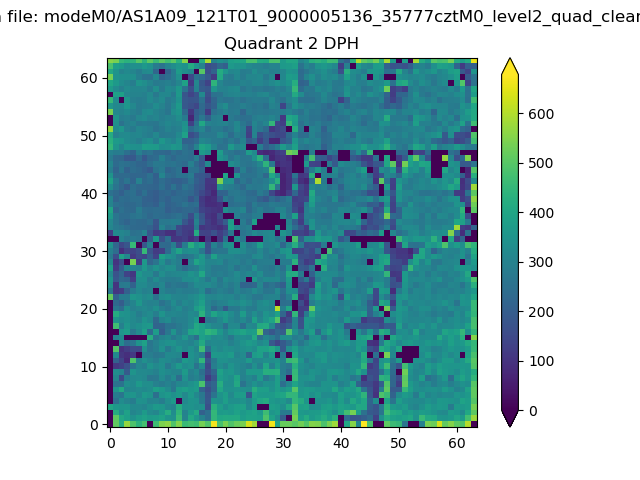 |
Quadrant C |
| Plot type | Count rate plots | Images |
|---|---|---|
| Comparison with Poisson distribution Blue bars denote a histogram of data divided into 1 sec bins. Red curve is a Poisson curve with rate = median count rate of data. |
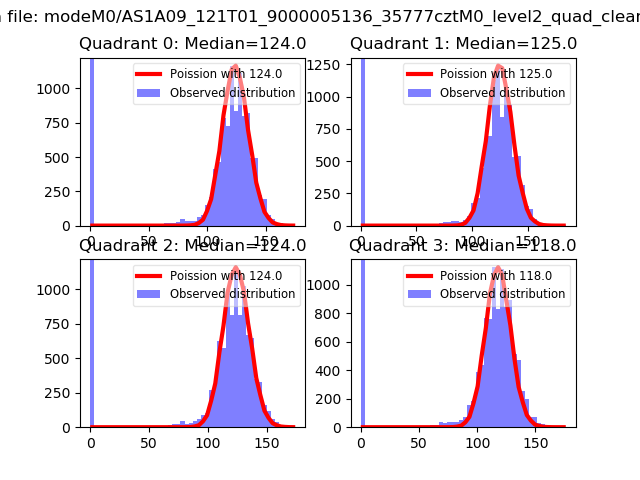 |
 |
| Quadrant-wise count rates Data is divided into 100 sec bins |
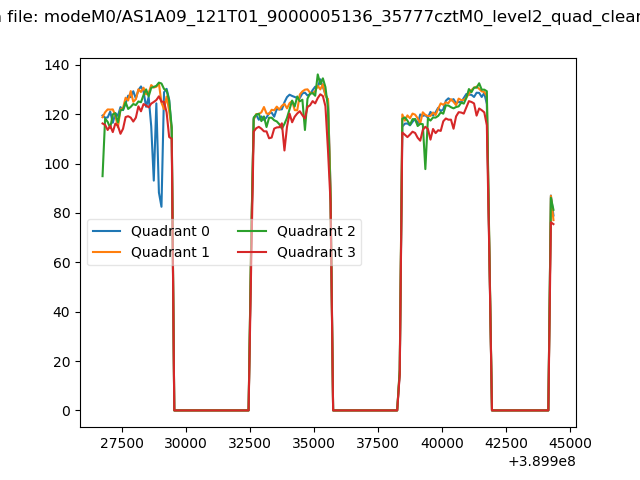 |
|
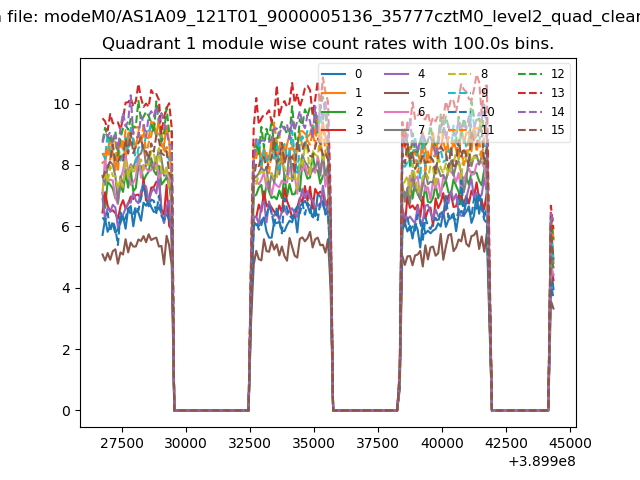
| Module-wise count rates for Quadrant A Data is divided into 100 sec bins |
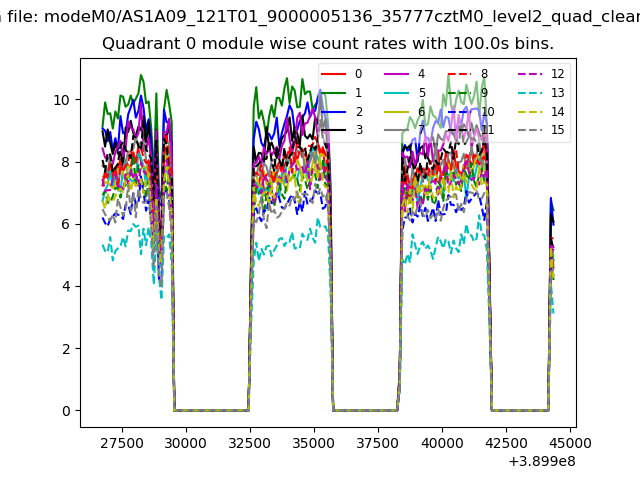 |
 |
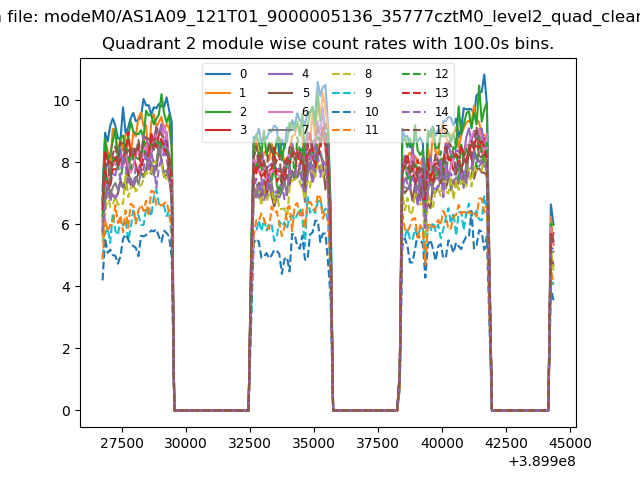
| Module-wise count rates for Quadrant B Data is divided into 100 sec bins |
 |
 |
| Module-wise count rates for Quadrant C Data is divided into 100 sec bins |
 |
 |
| Module-wise count rates for Quadrant D Data is divided into 100 sec bins |
 |
 |
| Parameter | Plot |
|---|---|
| CZT HV Monitor | 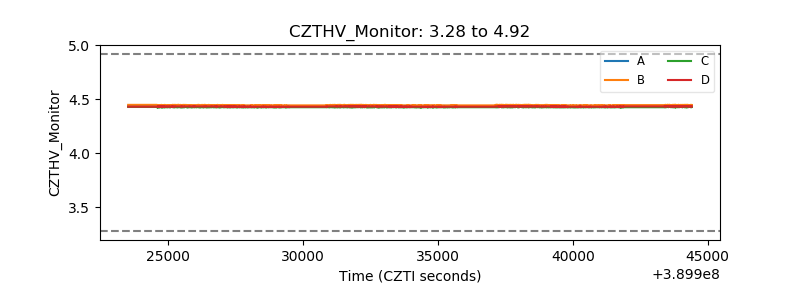 |
| D_VDD | 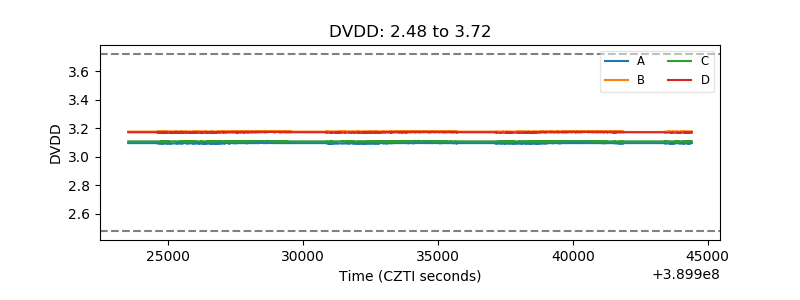 |
| Temperature 1 | 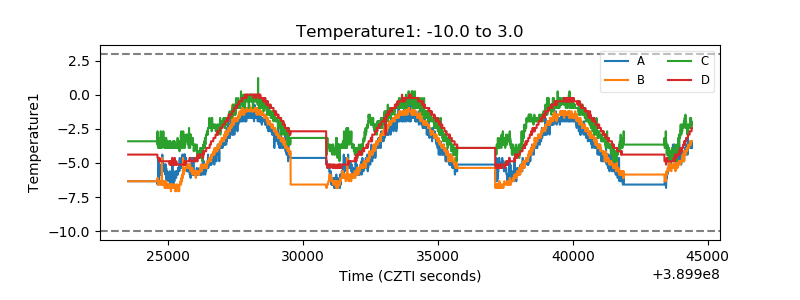 |
| Veto HV Monitor | 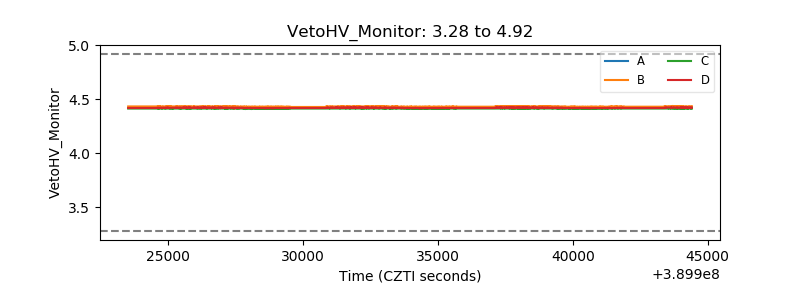 |
| Veto LLD | 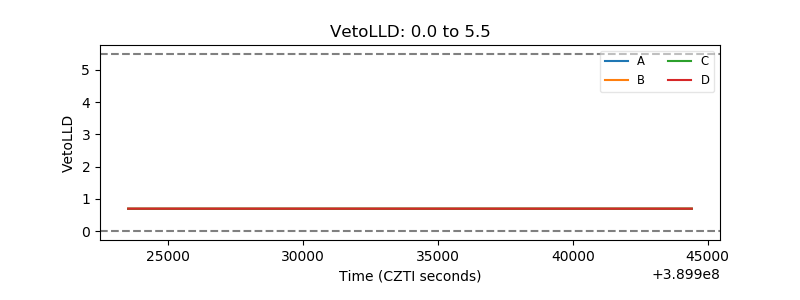 |
| Alpha Counter | 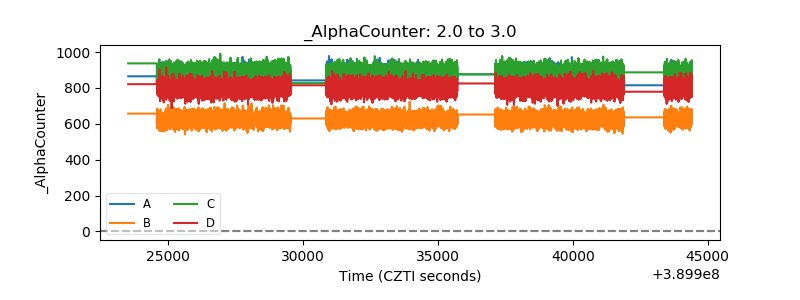 |
| _CPM_Rate | 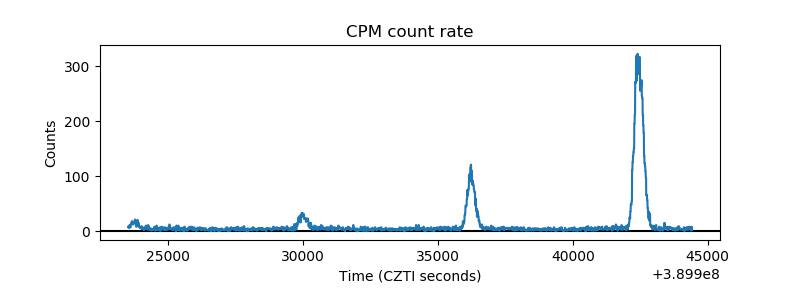 |
| CZT Counter | 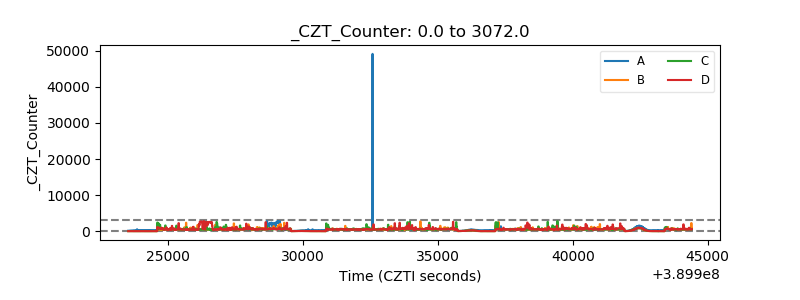 |
| +2.5 Volts monitor | 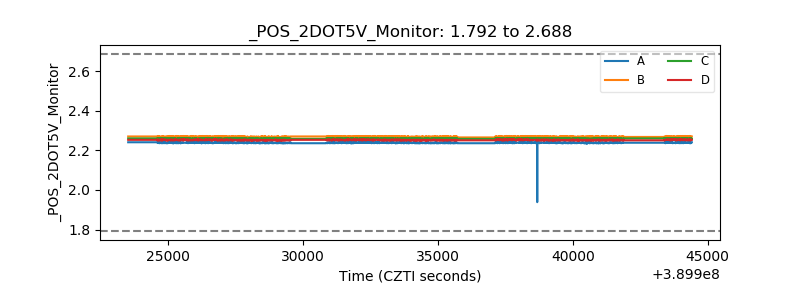 |
| +5 Volts monitor | 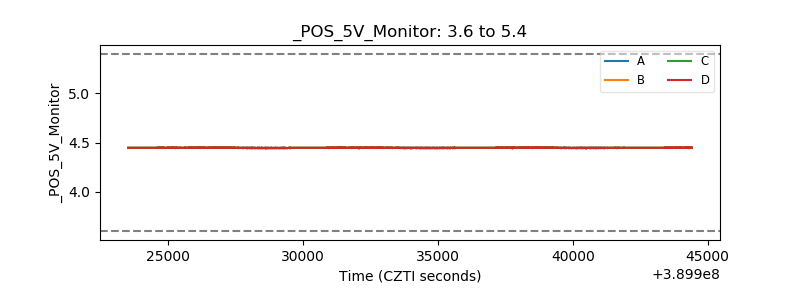 |
| _ROLL_ROT | 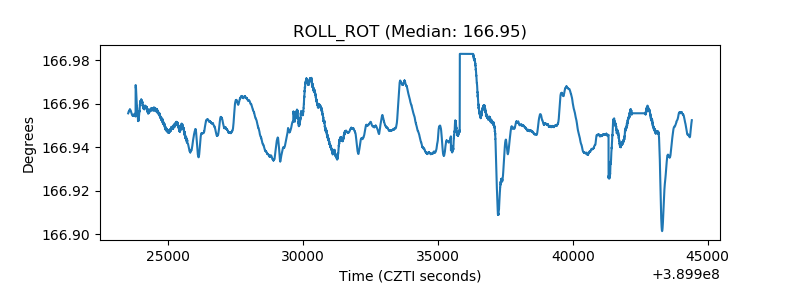 |
| _Roll_DEC | 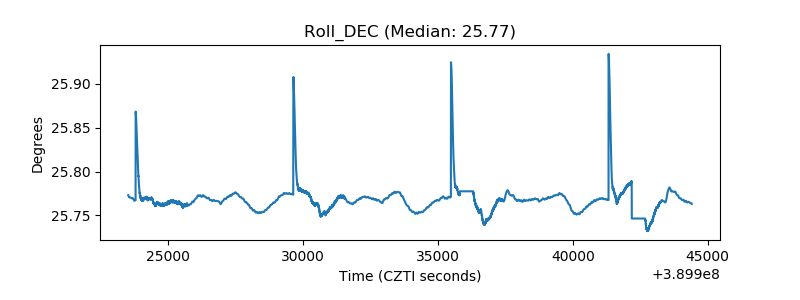 |
| _Roll_RA | 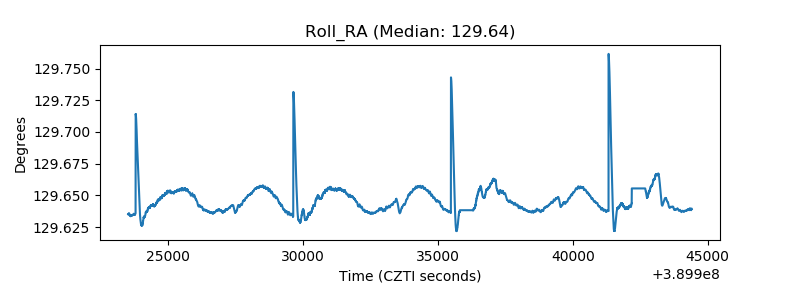 |
| Veto Counter | 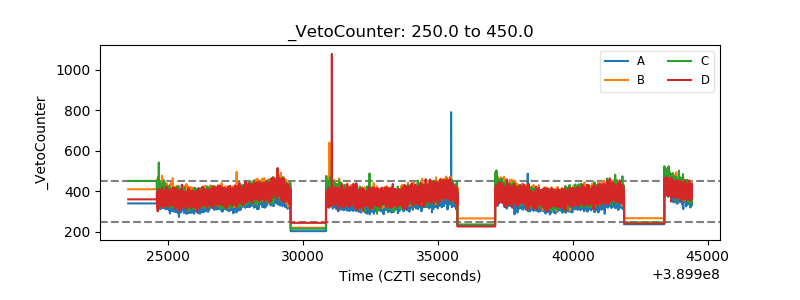 |