| Param | Original file | Final file |
|---|---|---|
| Filename | modeM0/AS1A09_121T01_9000005136_35774cztM0_level2.evt | modeM0/AS1A09_121T01_9000005136_35774cztM0_level2_quad_clean.evt |
| Size (bytes) | 479,306,880 | 59,310,720 |
| Size | 457.1 MB | 56.6 MB |
| Events in quadrant A | 2,881,023 | 353,268 |
| Events in quadrant B | 3,933,358 | 348,522 |
| Events in quadrant C | 3,523,425 | 344,958 |
| Events in quadrant D | 3,772,816 | 331,843 |
| Mode M9 | |||
|---|---|---|---|
| Quadrant | BADHDUFLAG | Total packets | Discarded packets |
| A | 0 | 27 | 0 |
| B | 0 | 27 | 0 |
| C | 0 | 27 | 0 |
| D | 0 | 27 | 0 |
| Mode M0 | |||
|---|---|---|---|
| Quadrant | BADHDUFLAG | Total packets | Discarded packets |
| A | 0 | 12288 | 3 |
| B | 0 | 15600 | 2 |
| C | 0 | 14085 | 2 |
| D | 0 | 15126 | 2 |
| Mode SS | |||
|---|---|---|---|
| Quadrant | BADHDUFLAG | Total packets | Discarded packets |
| A | 0 | 124 | 0 |
| B | 0 | 124 | 0 |
| C | 0 | 124 | 0 |
| D | 0 | 124 | 0 |
| Quadrant | Total seconds | Saturated seconds | Saturation percentage |
|---|---|---|---|
| A | 5967 | 13 | 0.217865% |
| B | 5967 | 288 | 4.826546% |
| C | 5967 | 171 | 2.865762% |
| D | 5967 | 193 | 3.234456% |
Noise dominated data is calculated using 1-second bins in cleaned event files. If a bin has >2000 counts, and if more than 50% of those come from <1% of pixels, then it is considered to be noise-dominated and hence unusable.
| Quadrant | # 1 sec bins | Bins with >0 counts | Bins with >2000 counts | High rate bins dominated by noise | Noise dominated (total time) | Noise dominated (detector-on time) | Marked lightcurve |
|---|---|---|---|---|---|---|---|
| A | 8683 | 5969 | 7 | 7 | 0.08% | 0.12% | 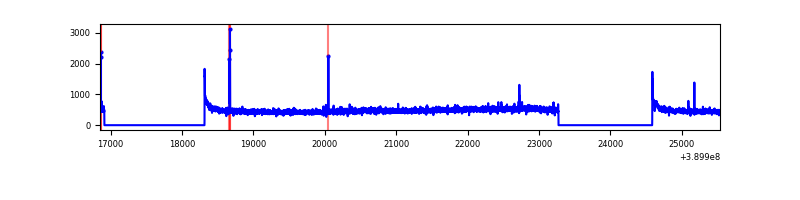 |
| B | 8683 | 5969 | 222 | 222 | 2.56% | 3.72% | 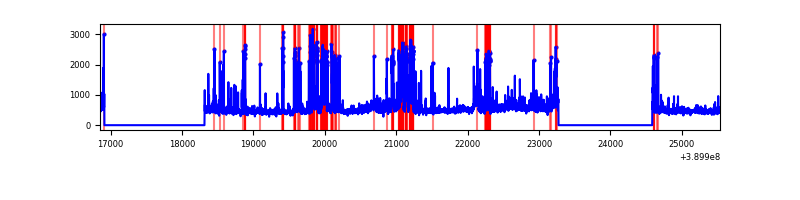 |
| C | 8683 | 5969 | 114 | 114 | 1.31% | 1.91% | 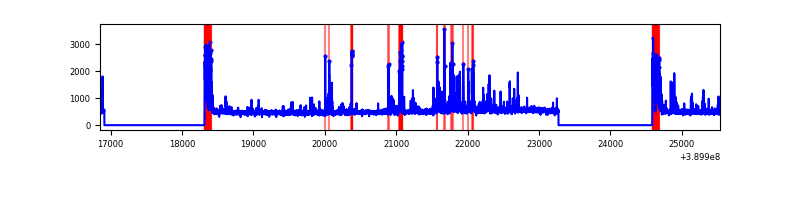 |
| D | 8683 | 5969 | 160 | 160 | 1.84% | 2.68% | 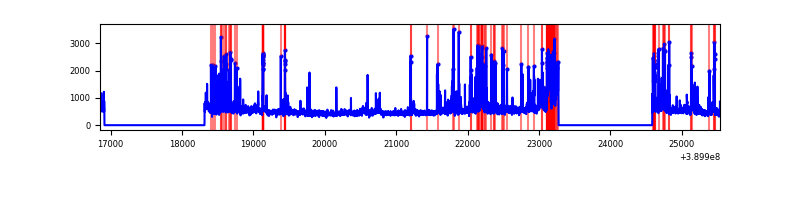 |
Top three noisy pixels from each quadrant. If the there are fewer than three noisy pixels in the level2.evt file, extra rows are filled as -1
| Pixel properties | Quadrant properties | ||||||
|---|---|---|---|---|---|---|---|
| Quadrant | DetID | PixID | Counts | Sigma | Mean | Median | Sigma |
| A | 10 | 83 | 170182 | 1210.19 | 688 | 675 | 140.1 |
| A | 10 | 248 | 14832 | 101.07 | 688 | 675 | 140.1 |
| A | 13 | 6 | 14563 | 99.15 | 688 | 675 | 140.1 |
| B | 5 | 172 | 765534 | 5844.93 | 675 | 655 | 130.9 |
| B | 0 | 213 | 142680 | 1085.3 | 675 | 655 | 130.9 |
| B | 5 | 255 | 136887 | 1041.03 | 675 | 655 | 130.9 |
| C | 0 | 10 | 369866 | 2382.89 | 662 | 667 | 154.9 |
| C | 15 | 214 | 251870 | 1621.32 | 662 | 667 | 154.9 |
| C | 1 | 23 | 246813 | 1588.68 | 662 | 667 | 154.9 |
| D | 13 | 249 | 206253 | 1220.9 | 662 | 646 | 168.4 |
| D | 2 | 249 | 186583 | 1104.1 | 662 | 646 | 168.4 |
| D | 8 | 195 | 139926 | 827.05 | 662 | 646 | 168.4 |
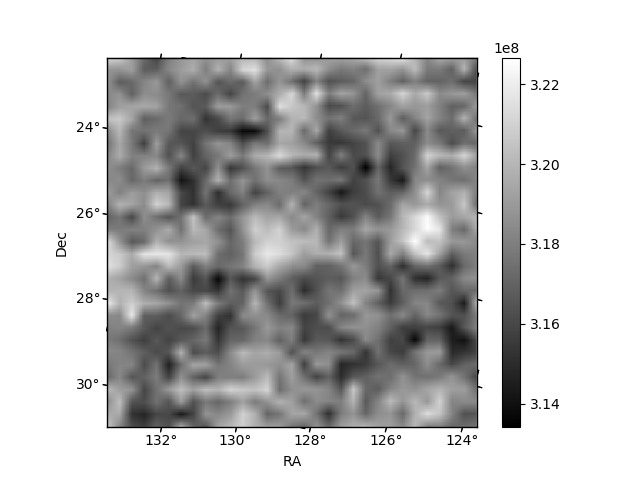
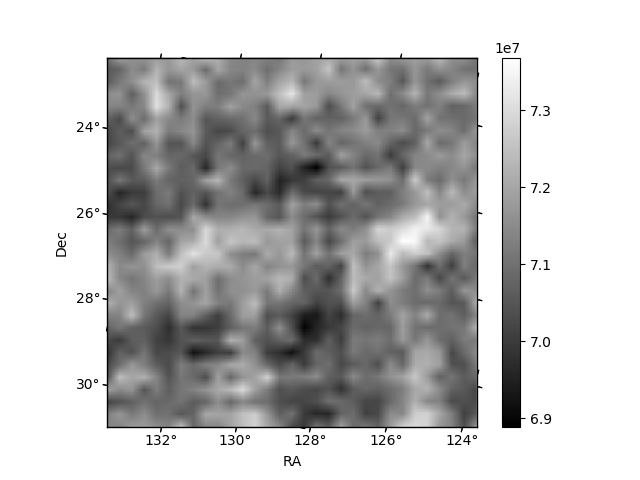
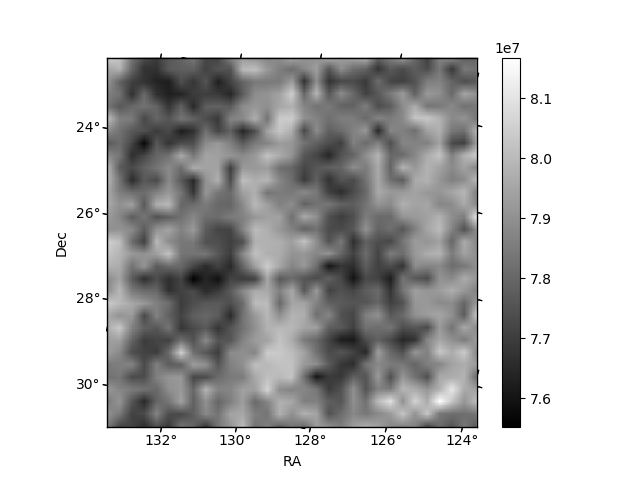
Histogram calculated using DETX and DETY for each event in the final _common_clean file
| Quadrant A | 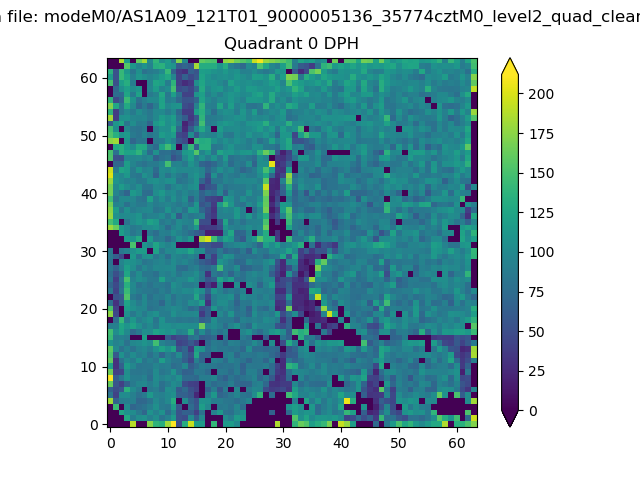 |
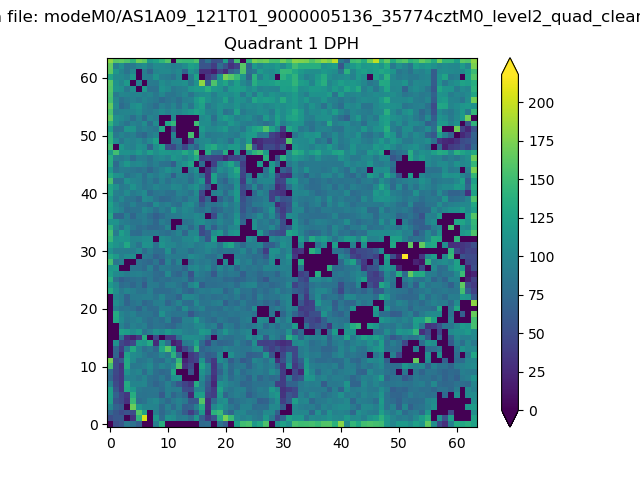 |
Quadrant B |
|---|---|---|---|
| Quadrant D | 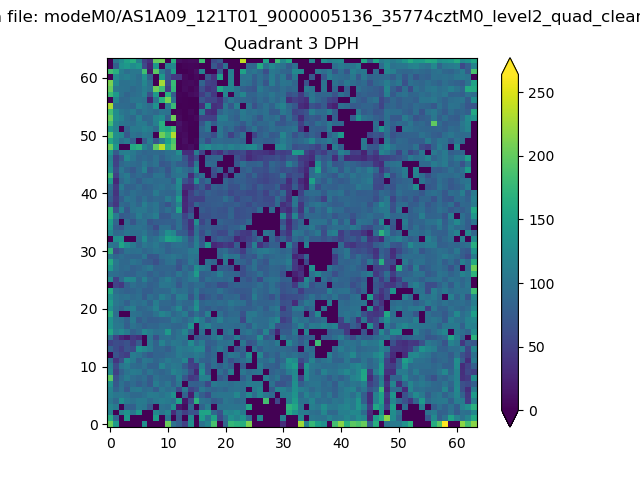 |
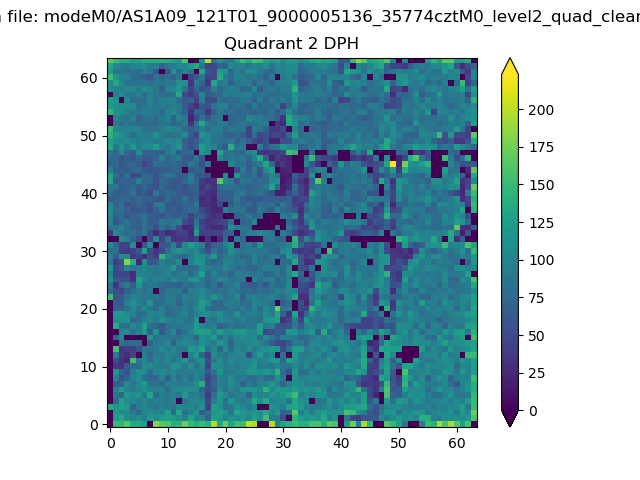 |
Quadrant C |
| Plot type | Count rate plots | Images |
|---|---|---|
| Comparison with Poisson distribution Blue bars denote a histogram of data divided into 1 sec bins. Red curve is a Poisson curve with rate = median count rate of data. |
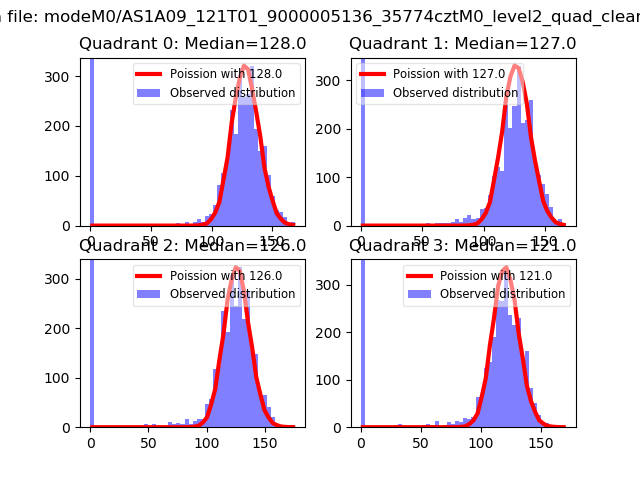 |
 |
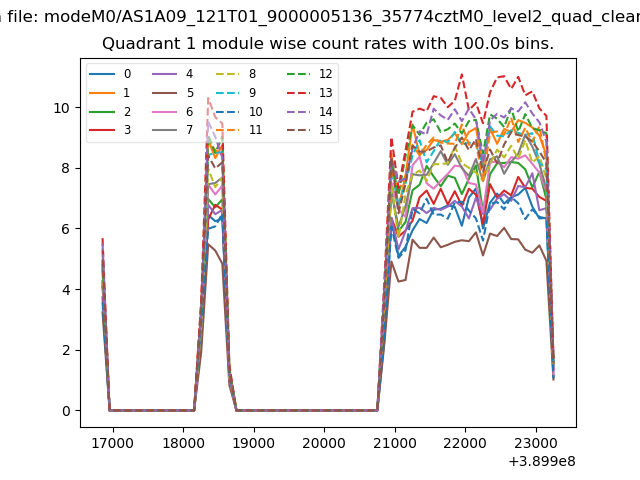
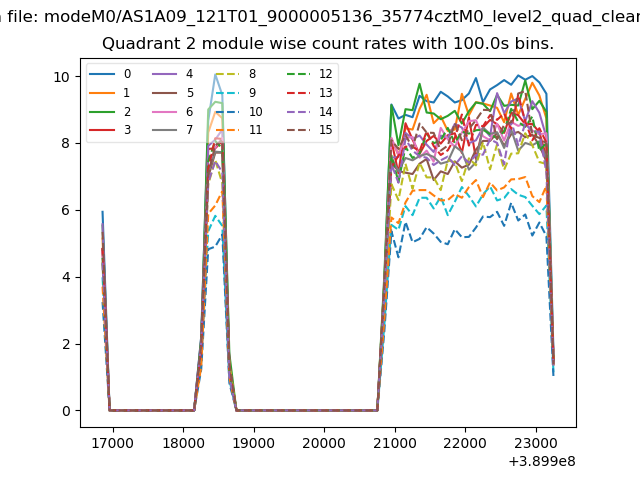
| Quadrant-wise count rates Data is divided into 100 sec bins |
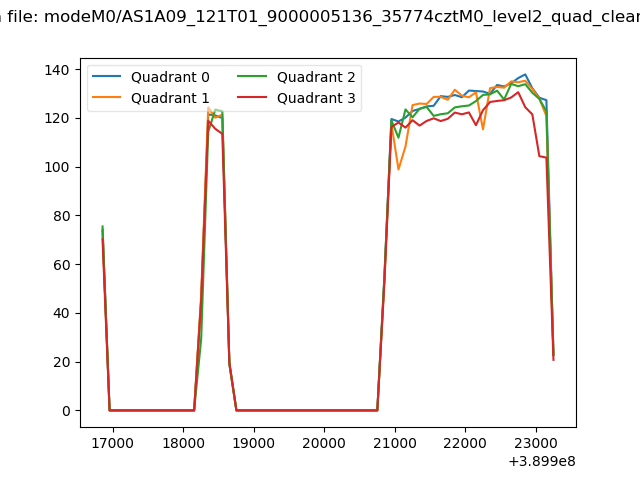 |
|
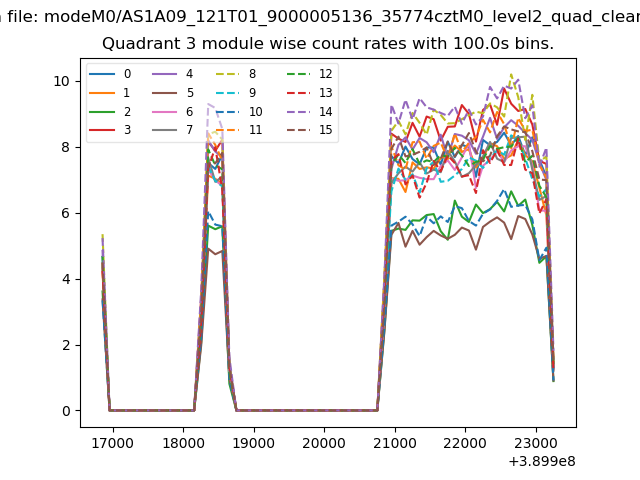
| Module-wise count rates for Quadrant A Data is divided into 100 sec bins |
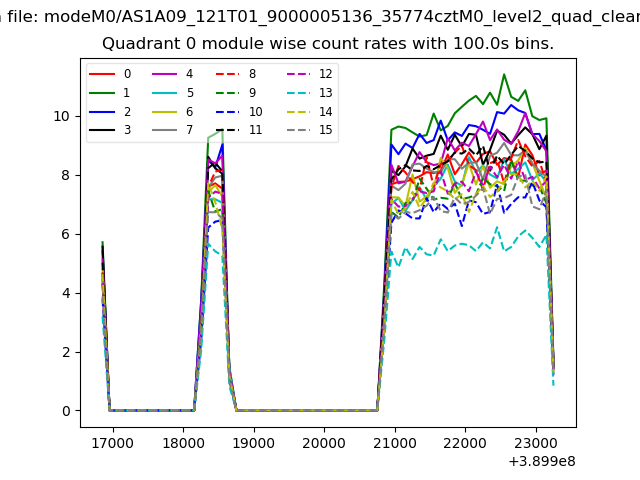 |
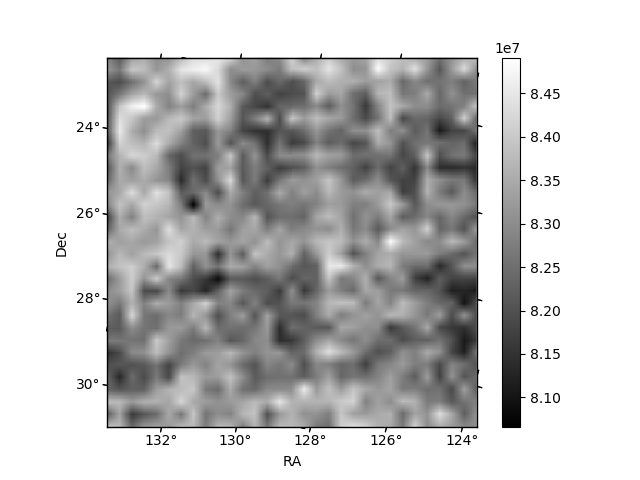 |
| Module-wise count rates for Quadrant B Data is divided into 100 sec bins |
 |
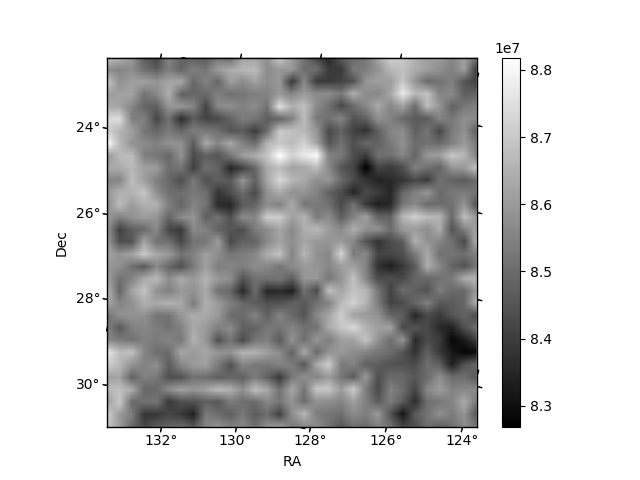 |
| Module-wise count rates for Quadrant C Data is divided into 100 sec bins |
 |
 |
| Module-wise count rates for Quadrant D Data is divided into 100 sec bins |
 |
 |
| Parameter | Plot |
|---|---|
| CZT HV Monitor | 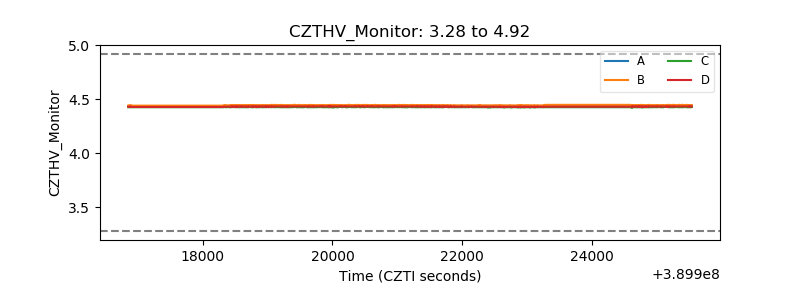 |
| D_VDD | 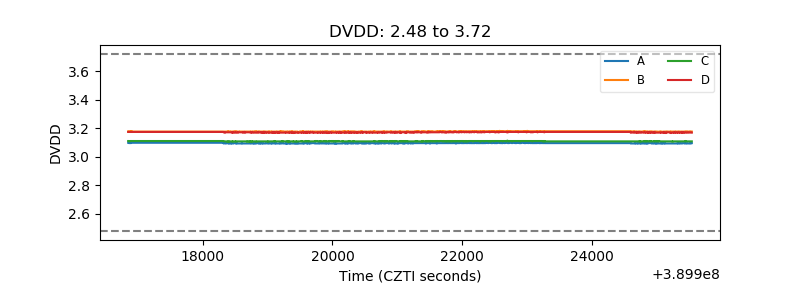 |
| Temperature 1 | 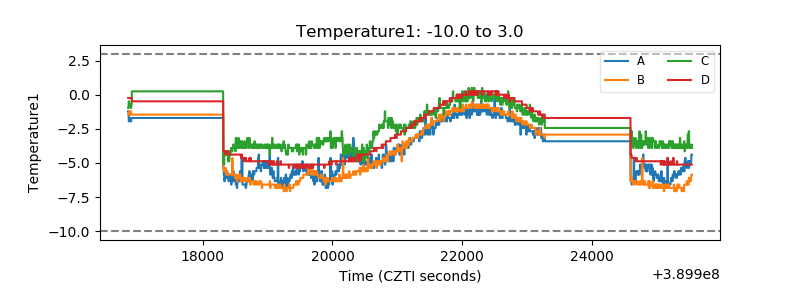 |
| Veto HV Monitor | 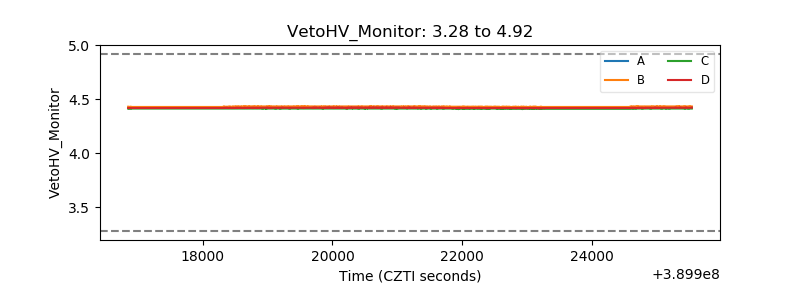 |
| Veto LLD | 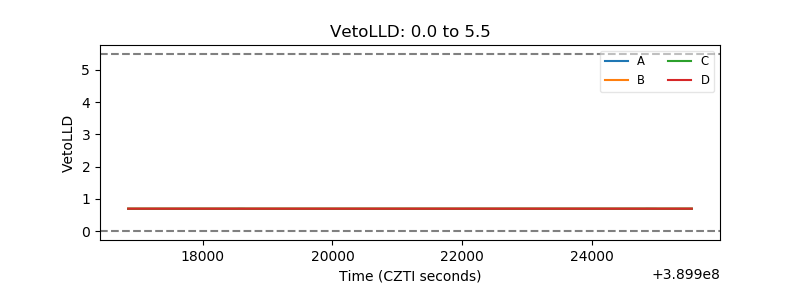 |
| Alpha Counter | 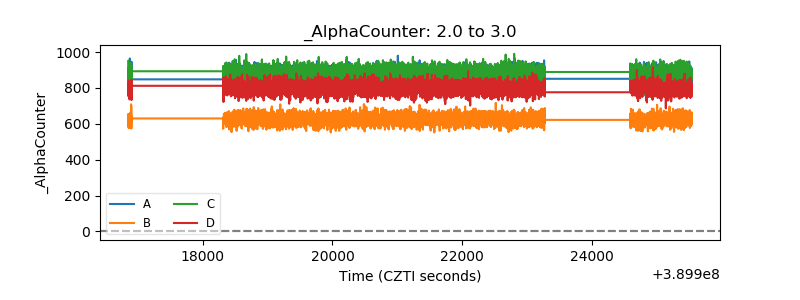 |
| _CPM_Rate | 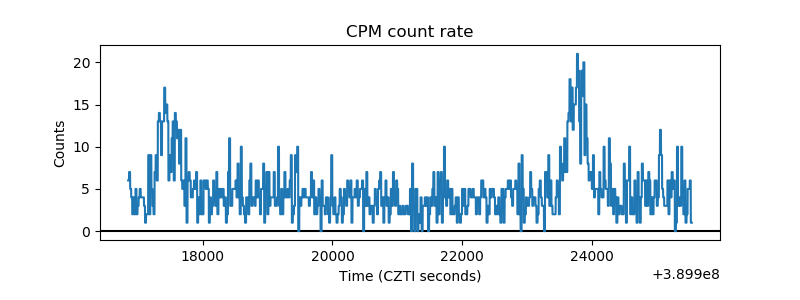 |
| CZT Counter | 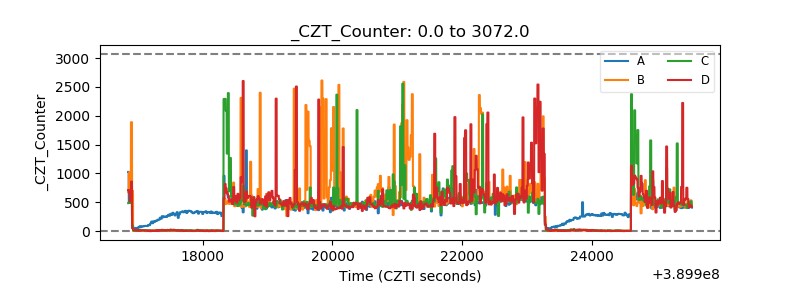 |
| +2.5 Volts monitor | 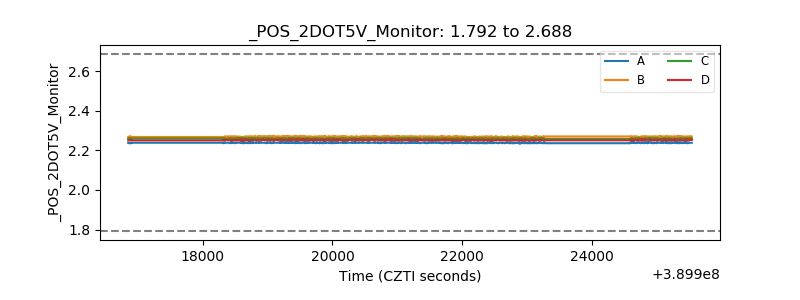 |
| +5 Volts monitor | 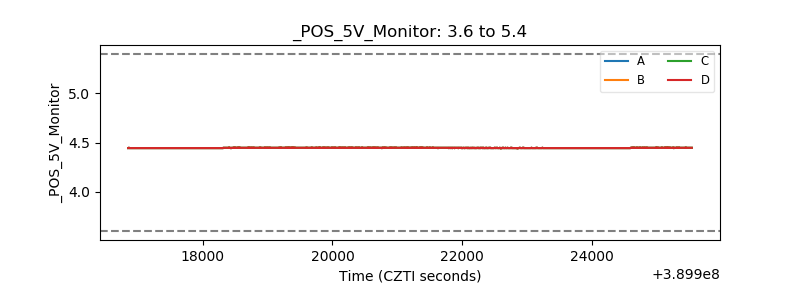 |
| _ROLL_ROT | 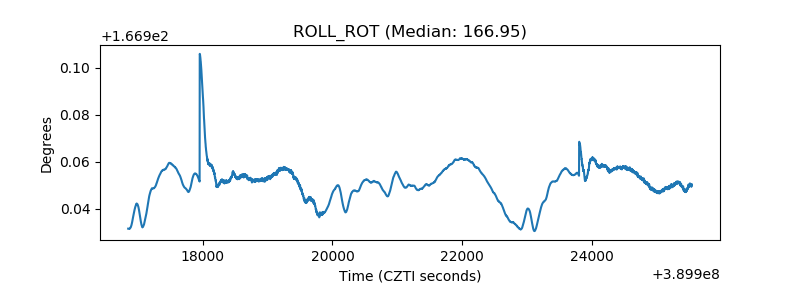 |
| _Roll_DEC | 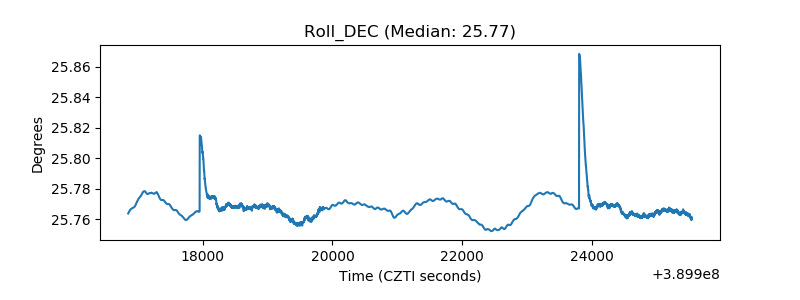 |
| _Roll_RA | 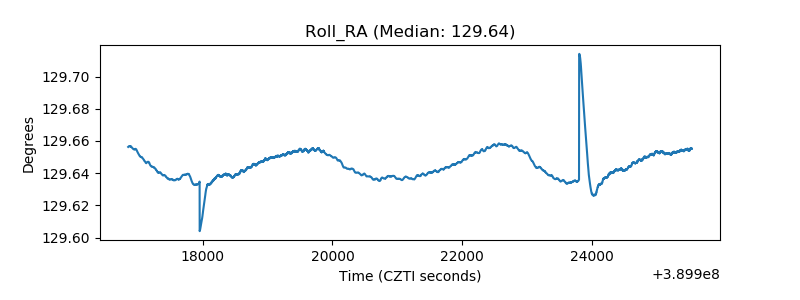 |
| Veto Counter | 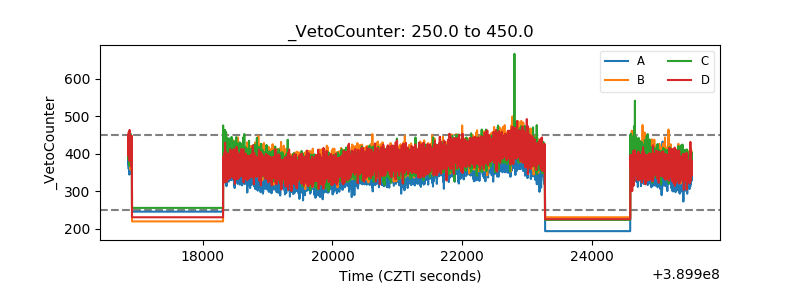 |