| Param | Original file | Final file |
|---|---|---|
| Filename | modeM0/AS1A10_058T14_9000005134_35770cztM0_level2.evt | modeM0/AS1A10_058T14_9000005134_35770cztM0_level2_quad_clean.evt |
| Size (bytes) | 402,275,520 | 87,120,000 |
| Size | 383.6 MB | 83.1 MB |
| Events in quadrant A | 2,642,308 | 589,643 |
| Events in quadrant B | 3,180,624 | 586,317 |
| Events in quadrant C | 2,802,829 | 559,118 |
| Events in quadrant D | 3,209,522 | 544,757 |
| Mode SS | |||
|---|---|---|---|
| Quadrant | BADHDUFLAG | Total packets | Discarded packets |
| A | 0 | 104 | 0 |
| B | 0 | 104 | 0 |
| C | 0 | 104 | 0 |
| D | 0 | 104 | 0 |
| Mode M9 | |||
|---|---|---|---|
| Quadrant | BADHDUFLAG | Total packets | Discarded packets |
| A | 0 | 33 | 0 |
| B | 0 | 33 | 0 |
| C | 0 | 33 | 0 |
| D | 0 | 34 | 0 |
| Mode M0 | |||
|---|---|---|---|
| Quadrant | BADHDUFLAG | Total packets | Discarded packets |
| A | 0 | 10989 | 3 |
| B | 0 | 12689 | 2 |
| C | 0 | 11231 | 2 |
| D | 0 | 12995 | 2 |
| Quadrant | Total seconds | Saturated seconds | Saturation percentage |
|---|---|---|---|
| A | 5115 | 5 | 0.097752% |
| B | 5115 | 152 | 2.971652% |
| C | 5115 | 61 | 1.192571% |
| D | 5115 | 125 | 2.443793% |
Noise dominated data is calculated using 1-second bins in cleaned event files. If a bin has >2000 counts, and if more than 50% of those come from <1% of pixels, then it is considered to be noise-dominated and hence unusable.
| Quadrant | # 1 sec bins | Bins with >0 counts | Bins with >2000 counts | High rate bins dominated by noise | Noise dominated (total time) | Noise dominated (detector-on time) | Marked lightcurve |
|---|---|---|---|---|---|---|---|
| A | 7238 | 5116 | 0 | 0 | 0.00% | 0.00% | 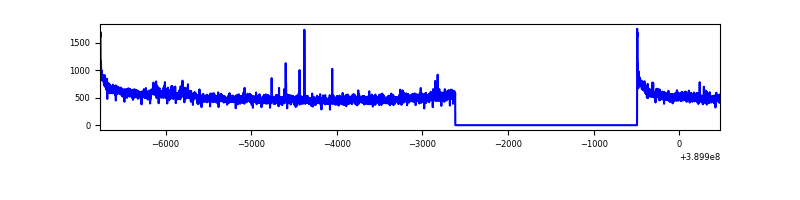 |
| B | 7238 | 5116 | 111 | 111 | 1.53% | 2.17% | 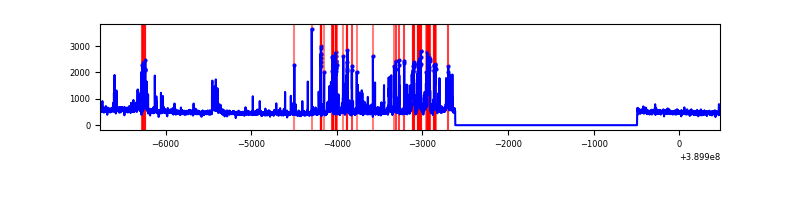 |
| C | 7238 | 5116 | 55 | 55 | 0.76% | 1.08% | 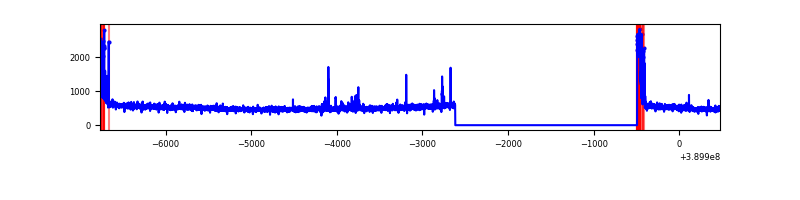 |
| D | 7238 | 5116 | 118 | 118 | 1.63% | 2.31% | 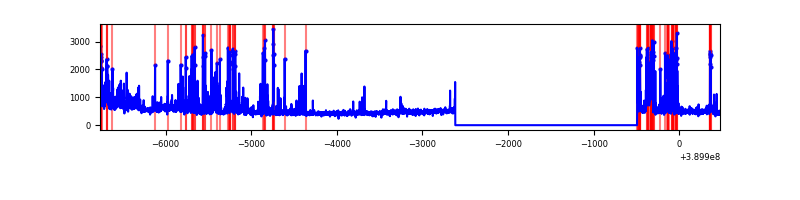 |
Top three noisy pixels from each quadrant. If the there are fewer than three noisy pixels in the level2.evt file, extra rows are filled as -1
| Pixel properties | Quadrant properties | ||||||
|---|---|---|---|---|---|---|---|
| Quadrant | DetID | PixID | Counts | Sigma | Mean | Median | Sigma |
| A | 10 | 83 | 155147 | 1218.46 | 628 | 619 | 126.8 |
| A | 15 | 169 | 42712 | 331.91 | 628 | 619 | 126.8 |
| A | 13 | 6 | 11738 | 87.67 | 628 | 619 | 126.8 |
| B | 5 | 172 | 477789 | 4159.24 | 610 | 596 | 114.7 |
| B | 5 | 255 | 174112 | 1512.38 | 610 | 596 | 114.7 |
| B | 4 | 232 | 56272 | 485.28 | 610 | 596 | 114.7 |
| C | 15 | 214 | 214336 | 1584.91 | 585 | 590 | 134.9 |
| C | 0 | 10 | 204601 | 1512.72 | 585 | 590 | 134.9 |
| C | 10 | 49 | 71871 | 528.54 | 585 | 590 | 134.9 |
| D | 13 | 249 | 292172 | 2018.18 | 594 | 580 | 144.5 |
| D | 1 | 52 | 258253 | 1783.42 | 594 | 580 | 144.5 |
| D | 8 | 195 | 84635 | 581.77 | 594 | 580 | 144.5 |
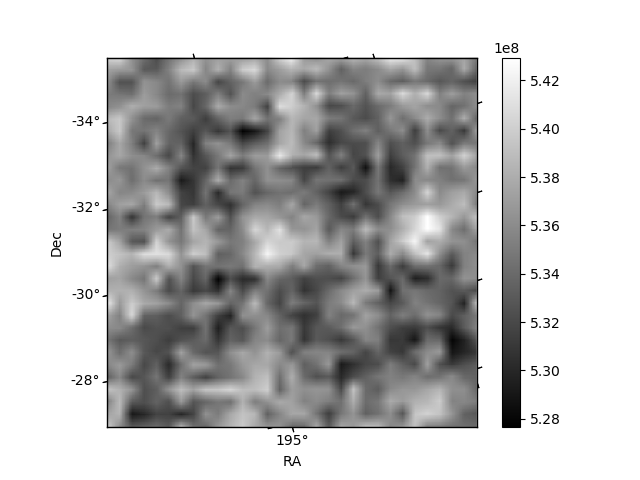
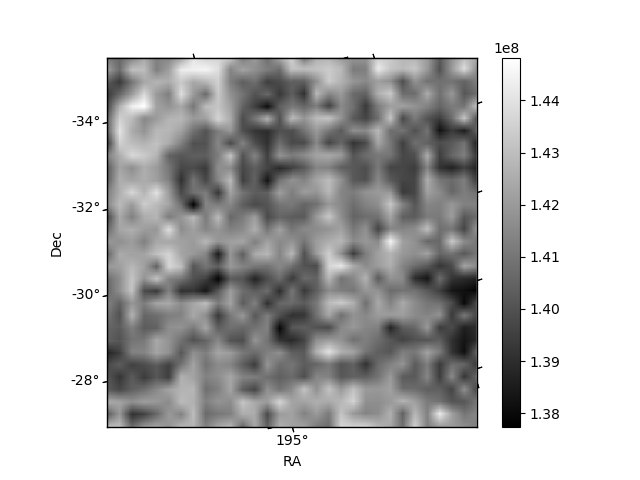
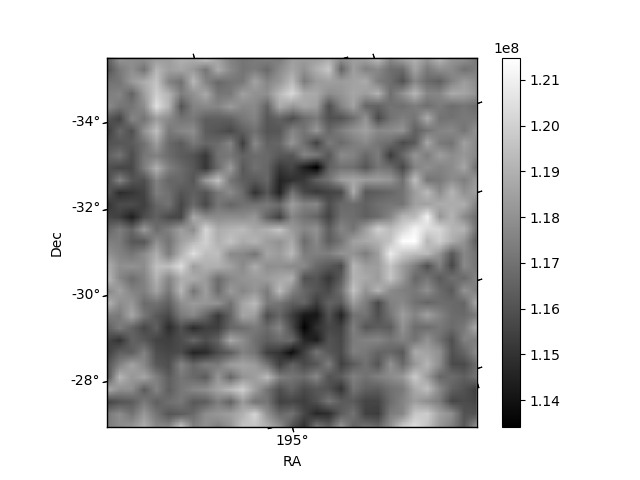
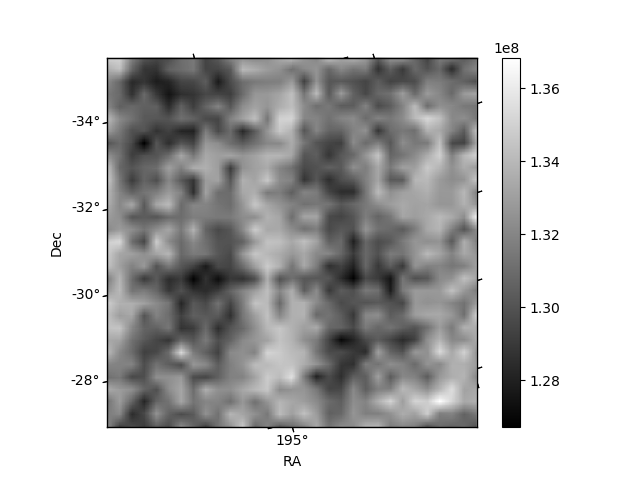
Histogram calculated using DETX and DETY for each event in the final _common_clean file
| Quadrant A | 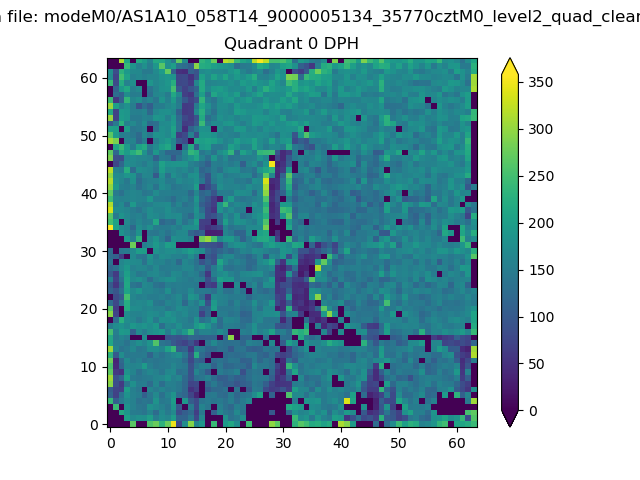 |
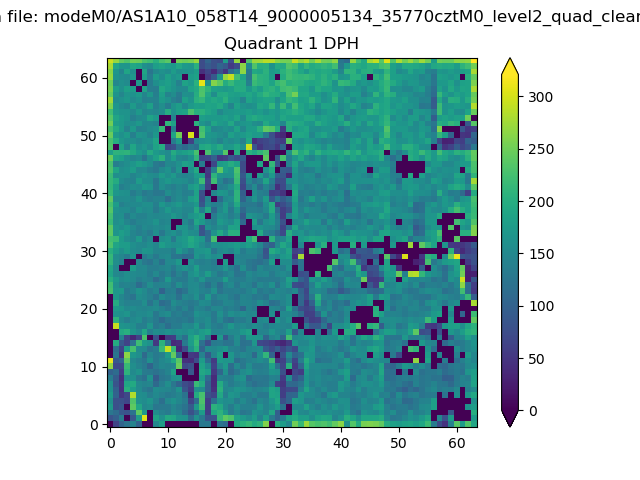 |
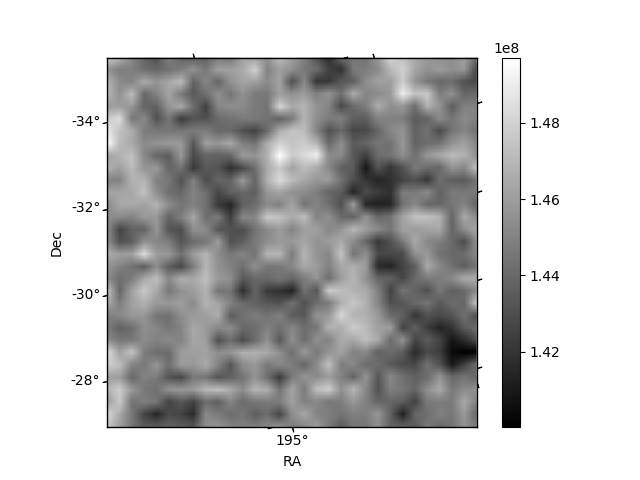
Quadrant B |
|---|---|---|---|
| Quadrant D | 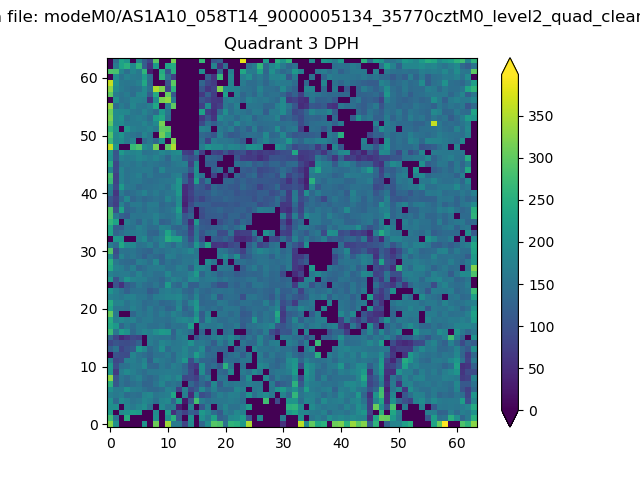 |
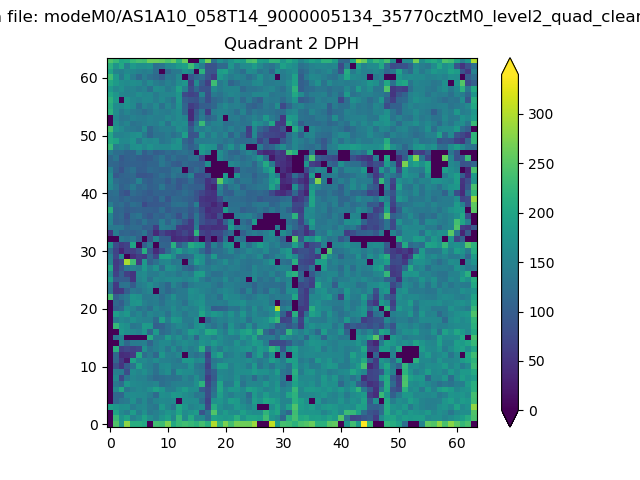 |
Quadrant C |
| Plot type | Count rate plots | Images |
|---|---|---|
| Comparison with Poisson distribution Blue bars denote a histogram of data divided into 1 sec bins. Red curve is a Poisson curve with rate = median count rate of data. |
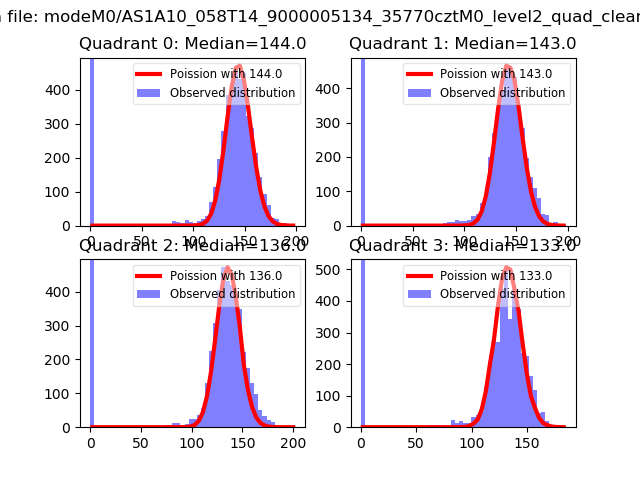 |
 |
| Quadrant-wise count rates Data is divided into 100 sec bins |
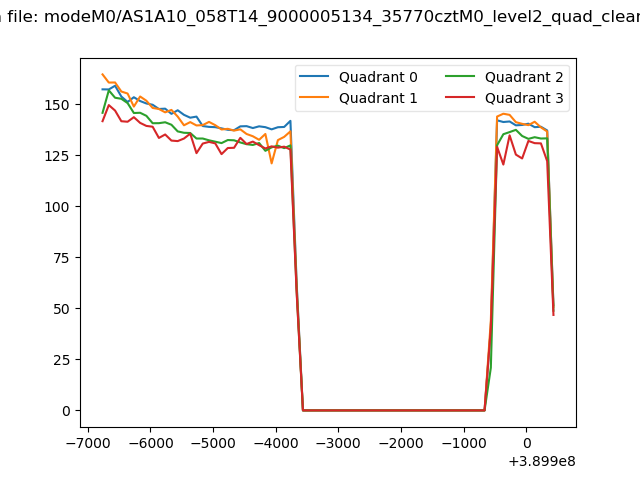 |
|
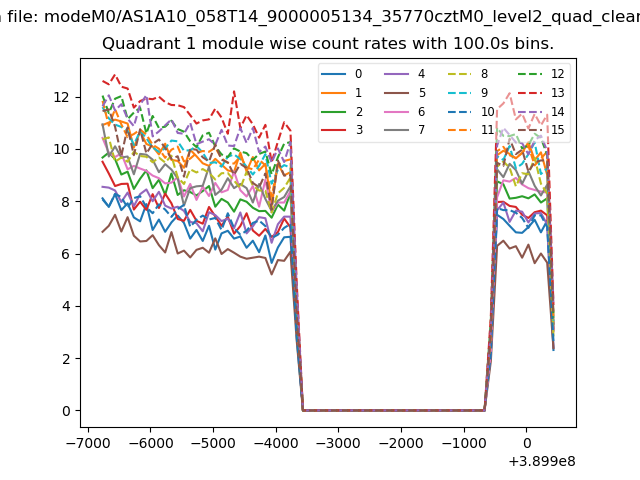
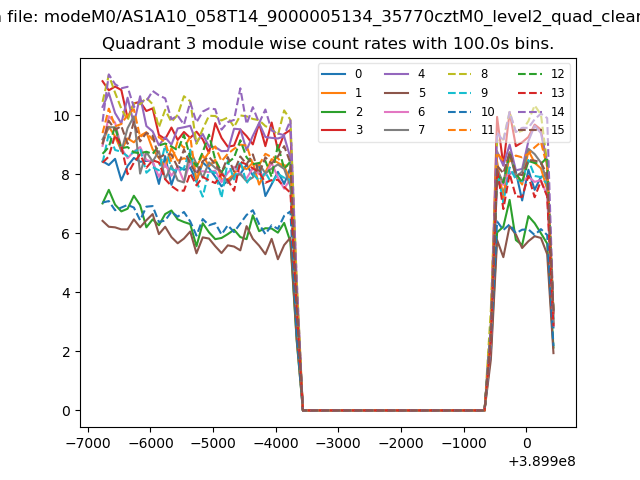
| Module-wise count rates for Quadrant A Data is divided into 100 sec bins |
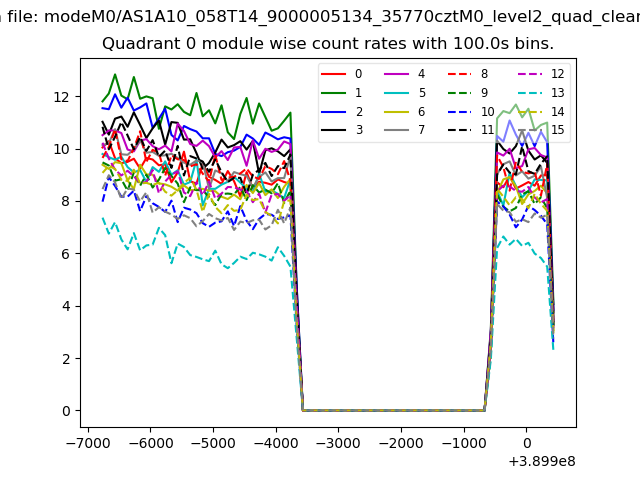 |
 |
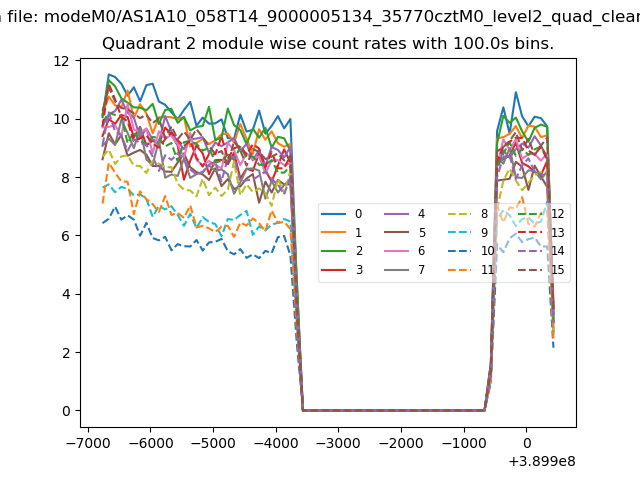
| Module-wise count rates for Quadrant B Data is divided into 100 sec bins |
 |
 |
| Module-wise count rates for Quadrant C Data is divided into 100 sec bins |
 |
 |
| Module-wise count rates for Quadrant D Data is divided into 100 sec bins |
 |
 |
| Parameter | Plot |
|---|---|
| CZT HV Monitor | 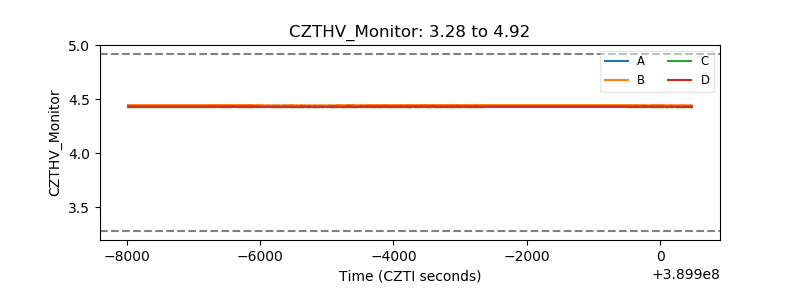 |
| D_VDD | 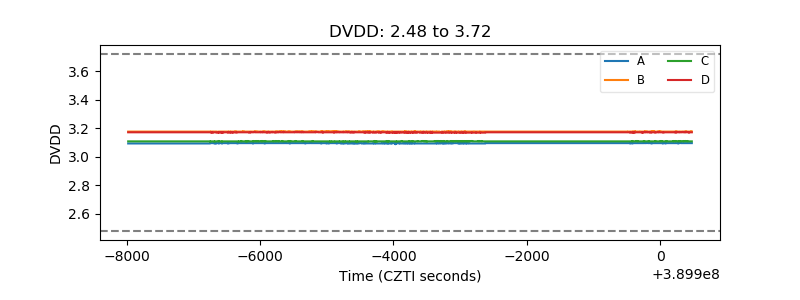 |
| Temperature 1 | 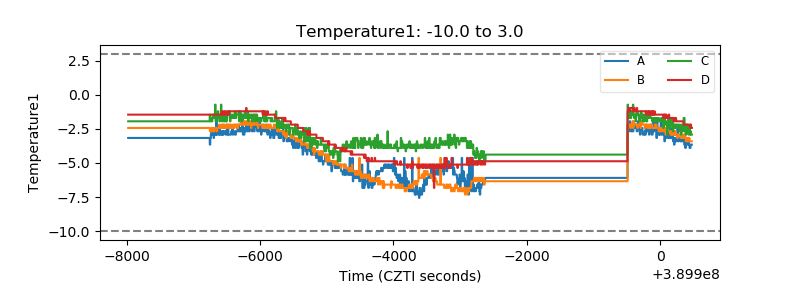 |
| Veto HV Monitor | 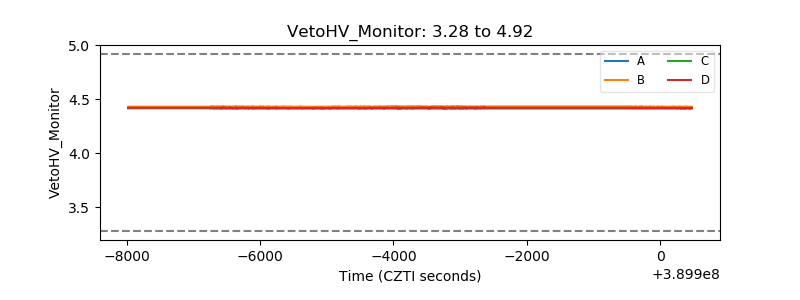 |
| Veto LLD | 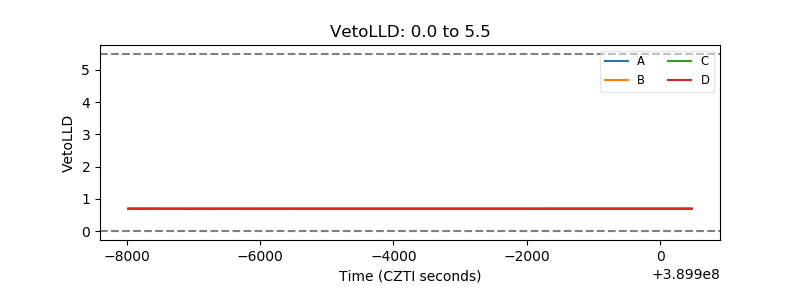 |
| Alpha Counter | 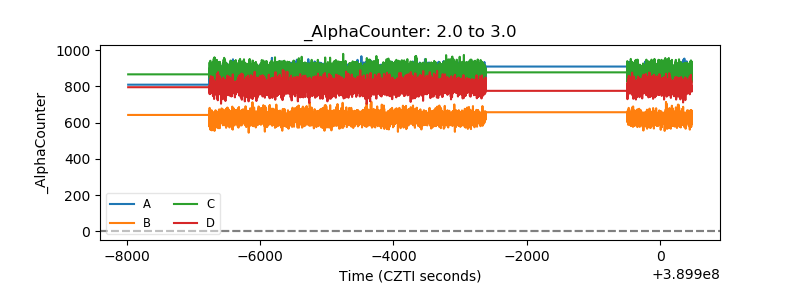 |
| _CPM_Rate | 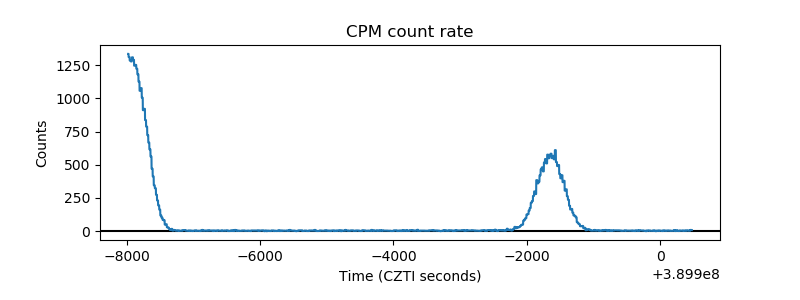 |
| CZT Counter | 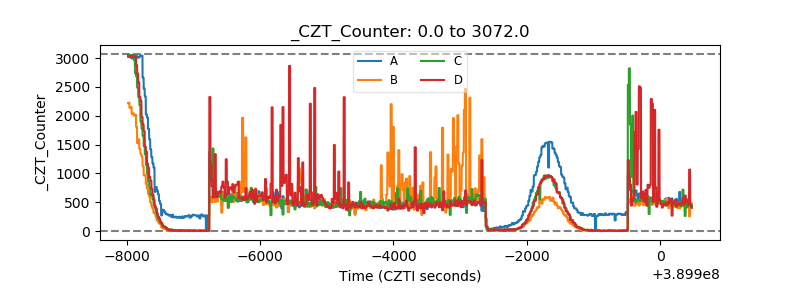 |
| +2.5 Volts monitor | 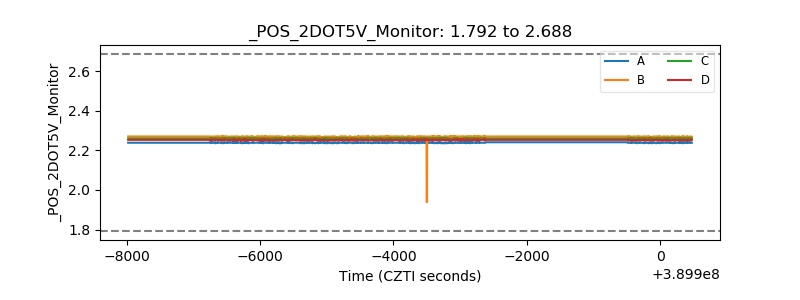 |
| +5 Volts monitor | 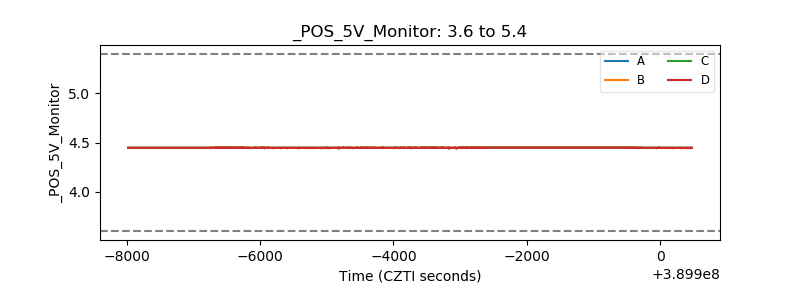 |
| _ROLL_ROT | 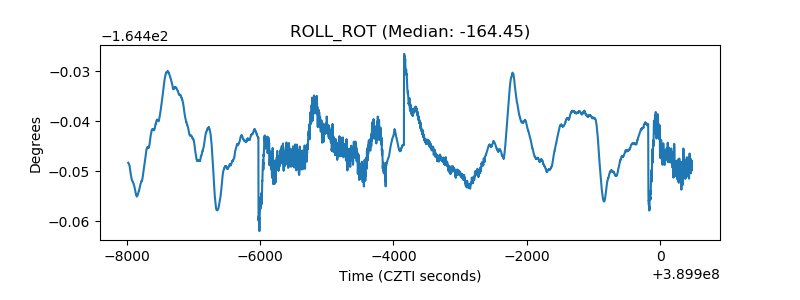 |
| _Roll_DEC | 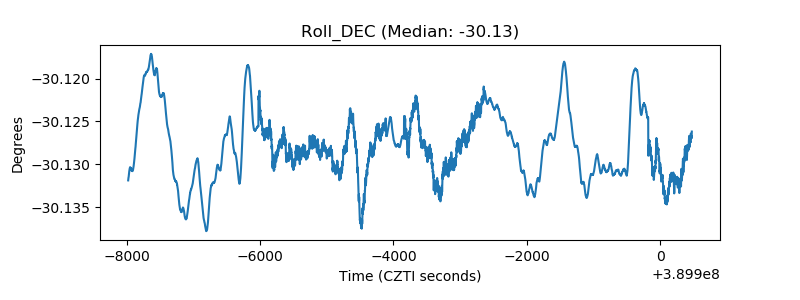 |
| _Roll_RA | 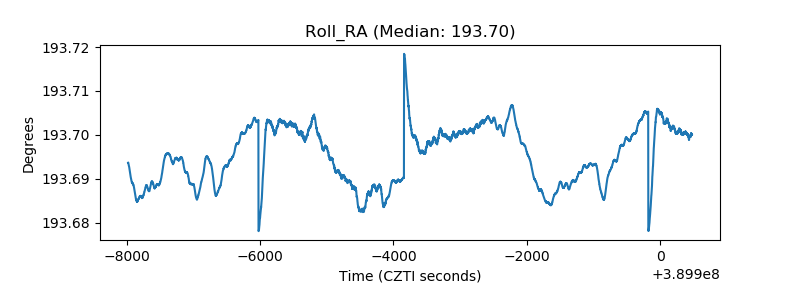 |
| Veto Counter | 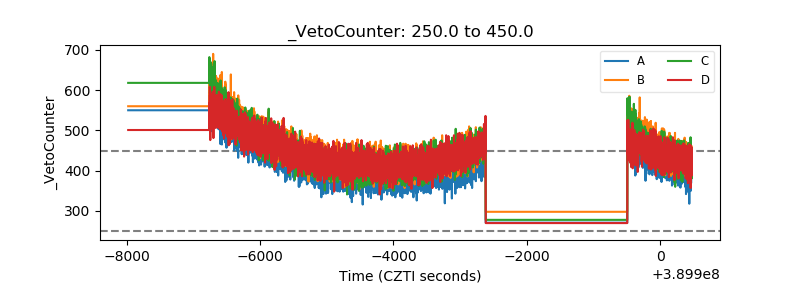 |