| Param | Original file | Final file |
|---|---|---|
| Filename | modeM0/AS1A10_058T14_9000005134_35764cztM0_level2.evt | modeM0/AS1A10_058T14_9000005134_35764cztM0_level2_quad_clean.evt |
| Size (bytes) | 417,689,280 | 61,649,280 |
| Size | 398.3 MB | 58.8 MB |
| Events in quadrant A | 2,612,490 | 380,862 |
| Events in quadrant B | 3,421,745 | 381,853 |
| Events in quadrant C | 2,894,664 | 375,044 |
| Events in quadrant D | 3,358,764 | 355,709 |
| Mode SS | |||
|---|---|---|---|
| Quadrant | BADHDUFLAG | Total packets | Discarded packets |
| A | 0 | 110 | 0 |
| B | 0 | 110 | 0 |
| C | 0 | 110 | 0 |
| D | 0 | 110 | 0 |
| Mode M9 | |||
|---|---|---|---|
| Quadrant | BADHDUFLAG | Total packets | Discarded packets |
| A | 0 | 24 | 0 |
| B | 0 | 24 | 0 |
| C | 0 | 24 | 0 |
| D | 0 | 25 | 0 |
| Mode M0 | |||
|---|---|---|---|
| Quadrant | BADHDUFLAG | Total packets | Discarded packets |
| A | 0 | 11049 | 3 |
| B | 0 | 13481 | 2 |
| C | 0 | 11780 | 2 |
| D | 0 | 13412 | 2 |
| Quadrant | Total seconds | Saturated seconds | Saturation percentage |
|---|---|---|---|
| A | 5321 | 8 | 0.150348% |
| B | 5321 | 208 | 3.909040% |
| C | 5321 | 52 | 0.977260% |
| D | 5321 | 148 | 2.781432% |
Noise dominated data is calculated using 1-second bins in cleaned event files. If a bin has >2000 counts, and if more than 50% of those come from <1% of pixels, then it is considered to be noise-dominated and hence unusable.
| Quadrant | # 1 sec bins | Bins with >0 counts | Bins with >2000 counts | High rate bins dominated by noise | Noise dominated (total time) | Noise dominated (detector-on time) | Marked lightcurve |
|---|---|---|---|---|---|---|---|
| A | 7024 | 5322 | 0 | 0 | 0.00% | 0.00% | 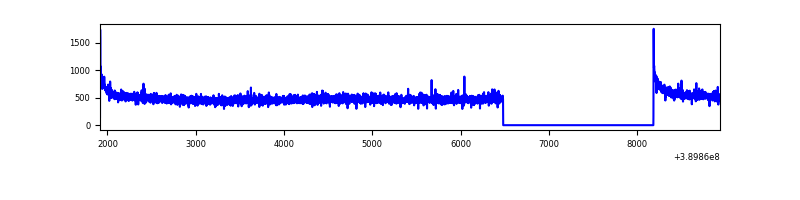 |
| B | 7024 | 5322 | 129 | 129 | 1.84% | 2.42% | 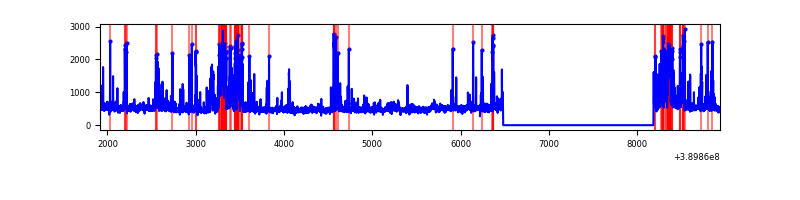 |
| C | 7024 | 5322 | 34 | 34 | 0.48% | 0.64% | 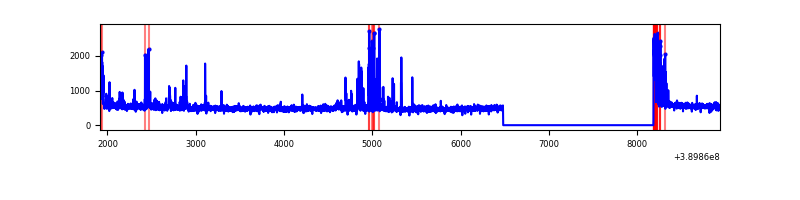 |
| D | 7024 | 5322 | 167 | 167 | 2.38% | 3.14% | 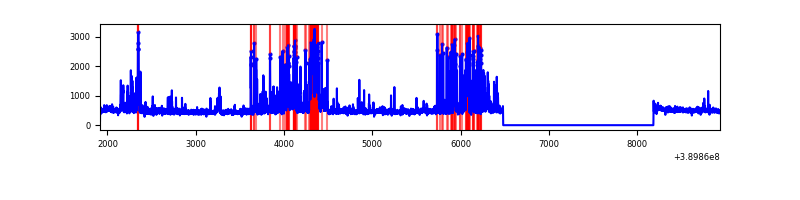 |
Top three noisy pixels from each quadrant. If the there are fewer than three noisy pixels in the level2.evt file, extra rows are filled as -1
| Pixel properties | Quadrant properties | ||||||
|---|---|---|---|---|---|---|---|
| Quadrant | DetID | PixID | Counts | Sigma | Mean | Median | Sigma |
| A | 10 | 83 | 155725 | 1219.87 | 626 | 614 | 127.2 |
| A | 13 | 6 | 14967 | 112.88 | 626 | 614 | 127.2 |
| A | 15 | 223 | 10801 | 80.12 | 626 | 614 | 127.2 |
| B | 5 | 172 | 469141 | 3945.83 | 616 | 599 | 118.7 |
| B | 5 | 255 | 280331 | 2355.77 | 616 | 599 | 118.7 |
| B | 0 | 213 | 120601 | 1010.6 | 616 | 599 | 118.7 |
| C | 15 | 214 | 225019 | 1587.83 | 604 | 608 | 141.3 |
| C | 1 | 23 | 189934 | 1339.59 | 604 | 608 | 141.3 |
| C | 0 | 10 | 97696 | 686.95 | 604 | 608 | 141.3 |
| D | 7 | 80 | 677199 | 4664.63 | 601 | 585 | 145.1 |
| D | 14 | 52 | 145309 | 997.74 | 601 | 585 | 145.1 |
| D | 13 | 249 | 55380 | 377.76 | 601 | 585 | 145.1 |
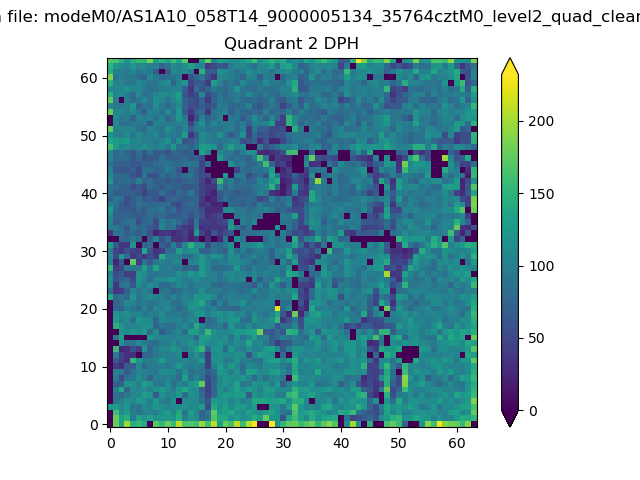
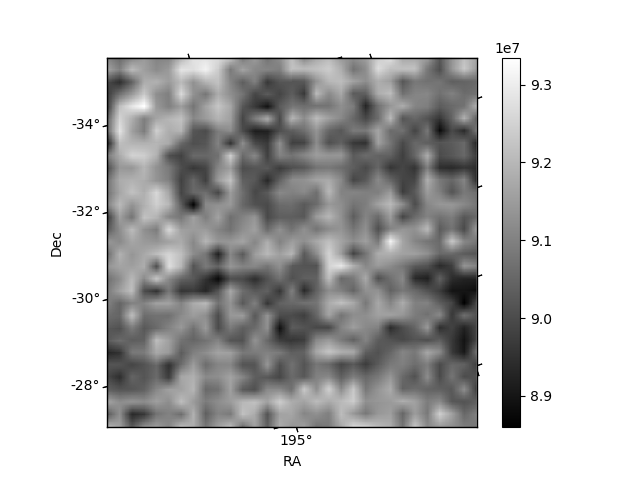
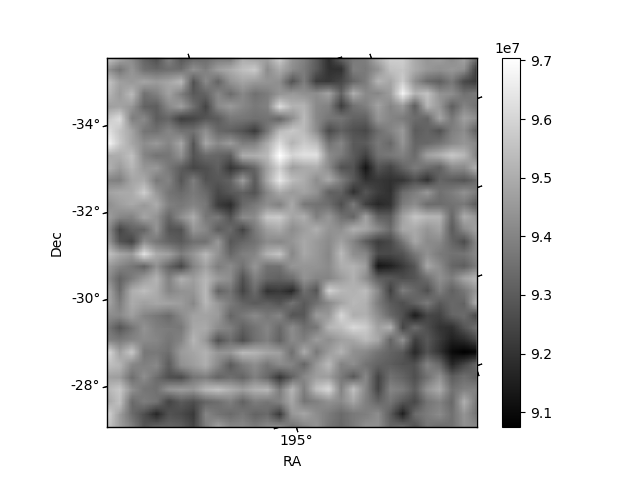
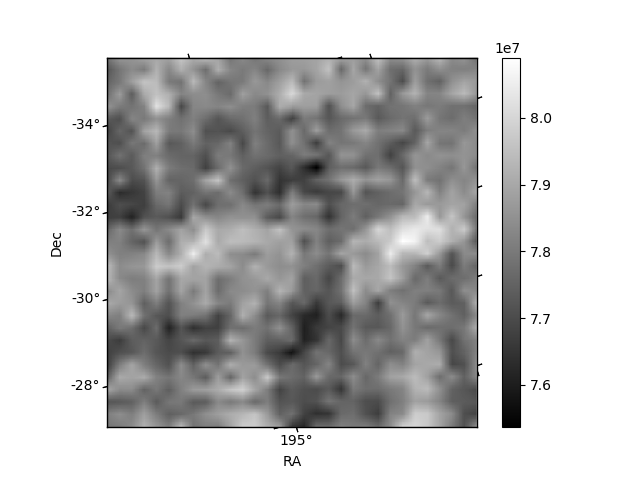
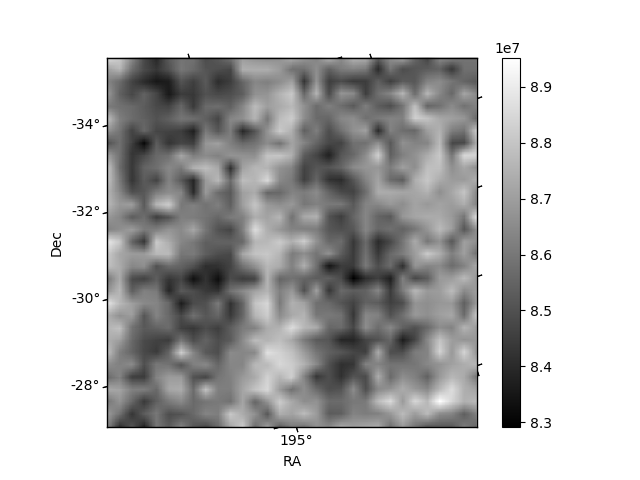
Histogram calculated using DETX and DETY for each event in the final _common_clean file
| Quadrant A | 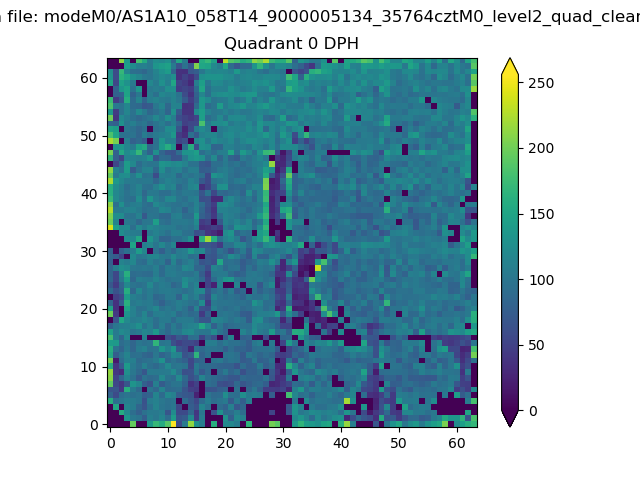 |
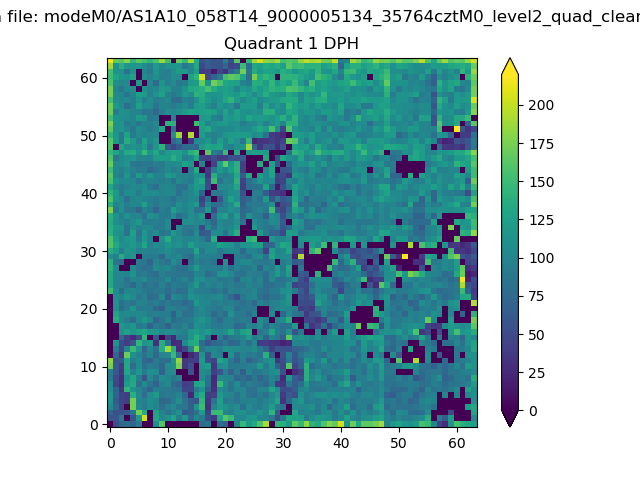 |
Quadrant B |
|---|---|---|---|
| Quadrant D | 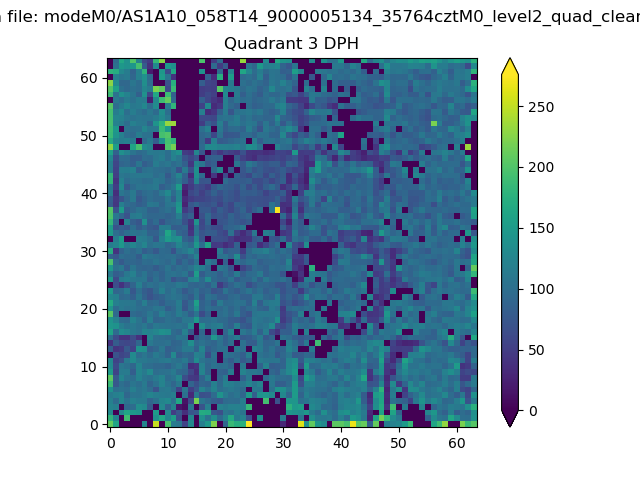 |
 |
Quadrant C |
| Plot type | Count rate plots | Images |
|---|---|---|
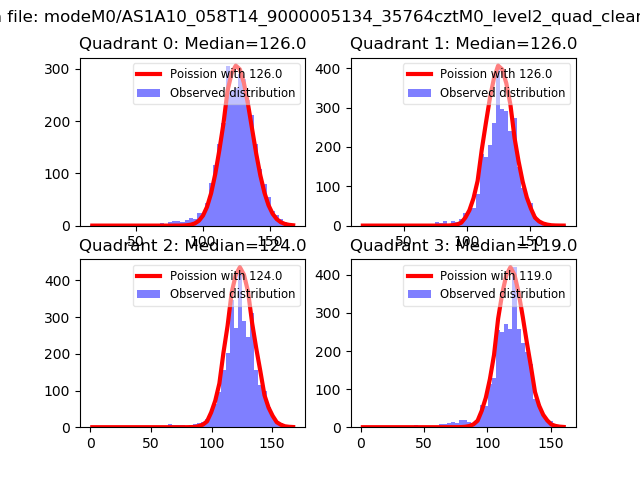
| Comparison with Poisson distribution Blue bars denote a histogram of data divided into 1 sec bins. Red curve is a Poisson curve with rate = median count rate of data. |
 |
 |
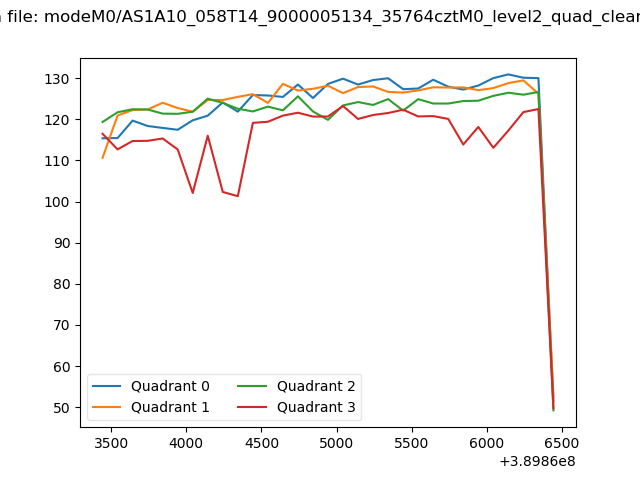
| Quadrant-wise count rates Data is divided into 100 sec bins |
 |
|
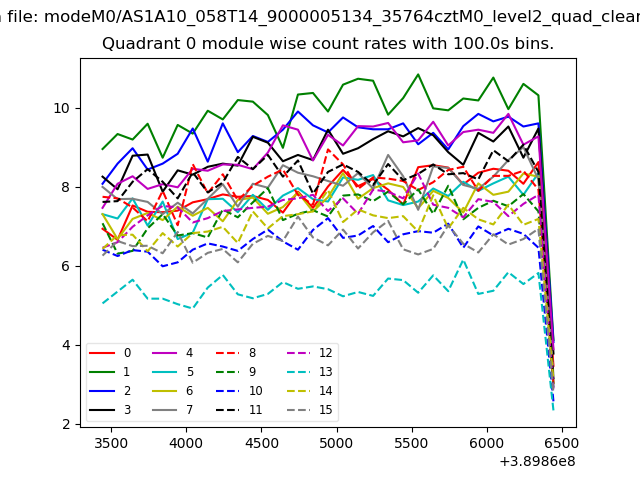
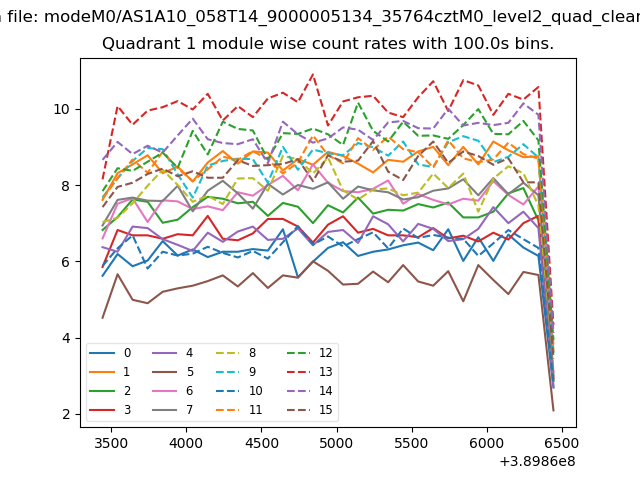
| Module-wise count rates for Quadrant A Data is divided into 100 sec bins |
 |
 |
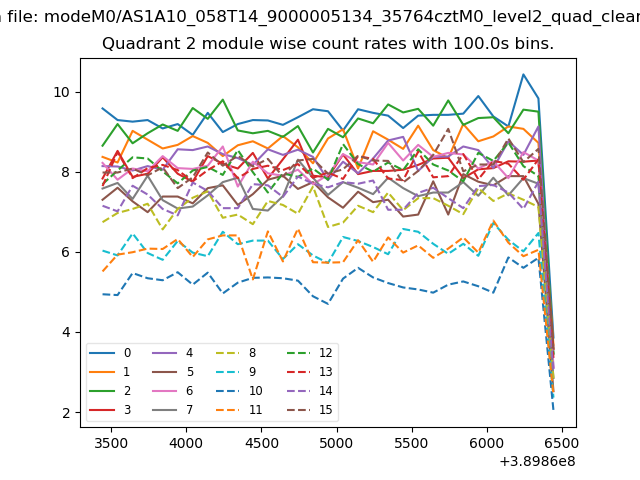
| Module-wise count rates for Quadrant B Data is divided into 100 sec bins |
 |
 |
| Module-wise count rates for Quadrant C Data is divided into 100 sec bins |
 |
 |
| Module-wise count rates for Quadrant D Data is divided into 100 sec bins |
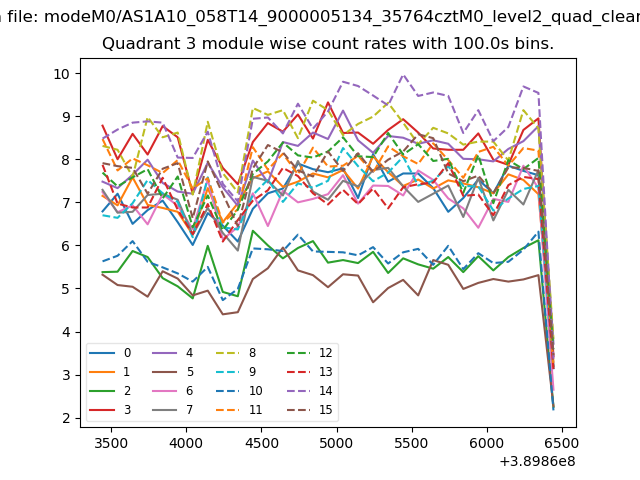 |
 |
| Parameter | Plot |
|---|---|
| CZT HV Monitor | 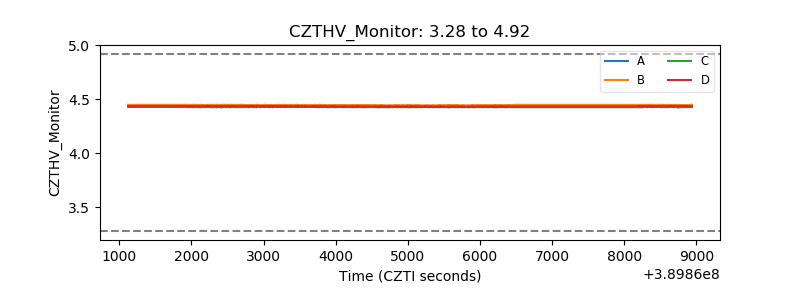 |
| D_VDD | 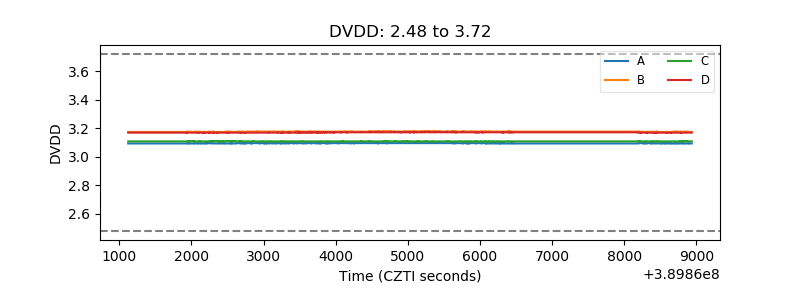 |
| Temperature 1 | 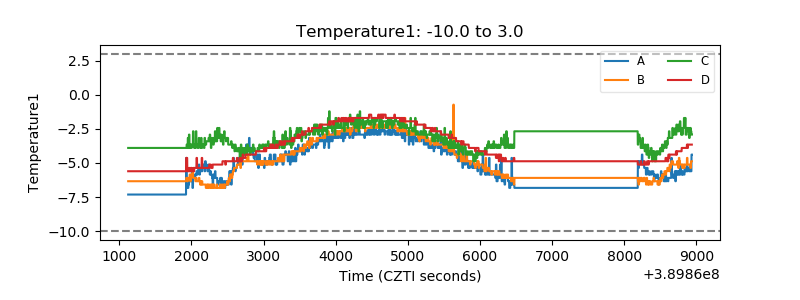 |
| Veto HV Monitor | 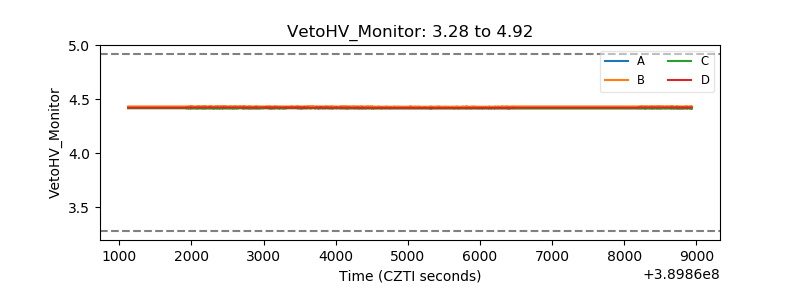 |
| Veto LLD | 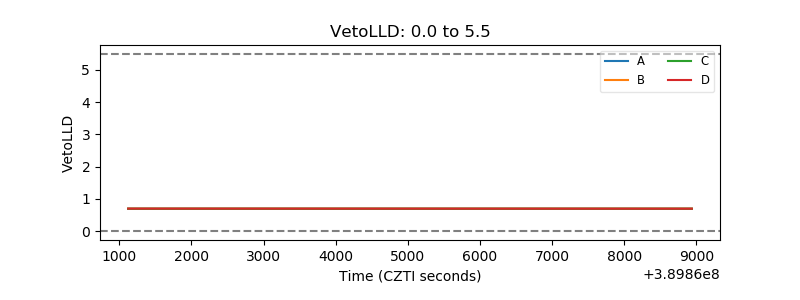 |
| Alpha Counter | 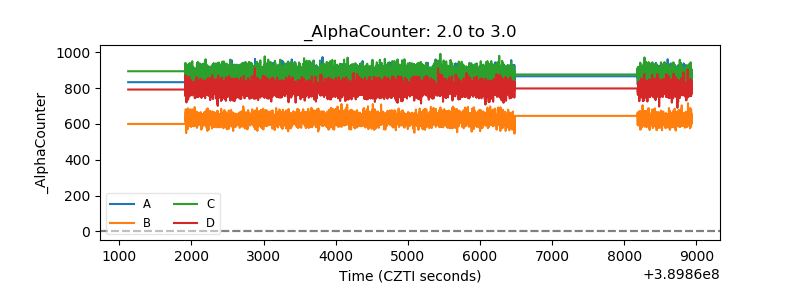 |
| _CPM_Rate | 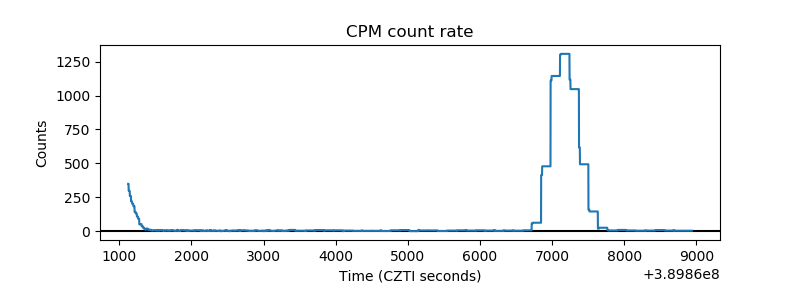 |
| CZT Counter | 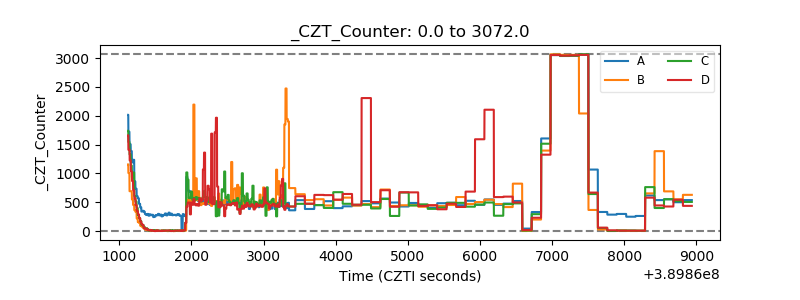 |
| +2.5 Volts monitor | 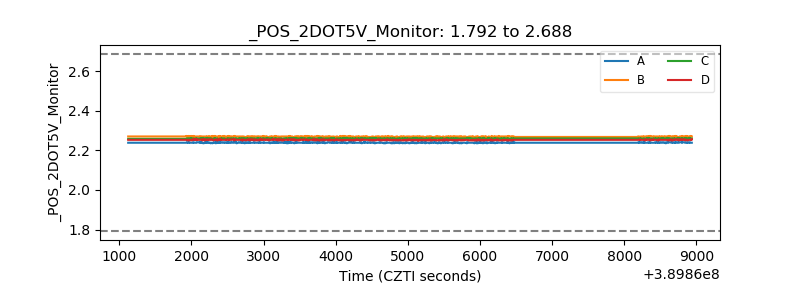 |
| +5 Volts monitor | 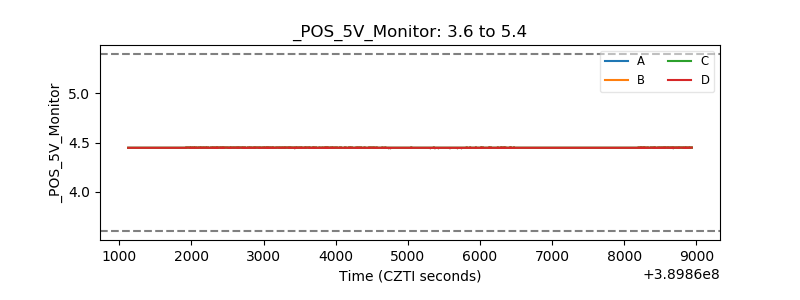 |
| _ROLL_ROT | 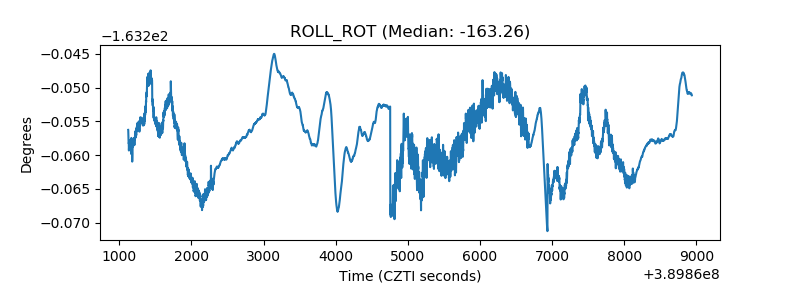 |
| _Roll_DEC | 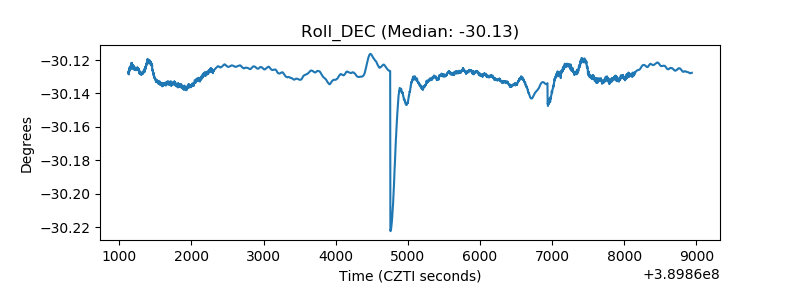 |
| _Roll_RA | 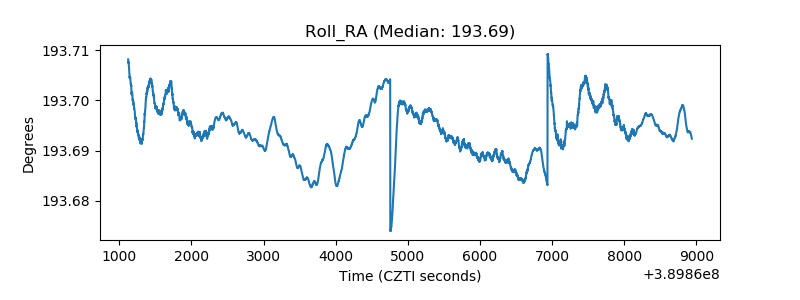 |
| Veto Counter | 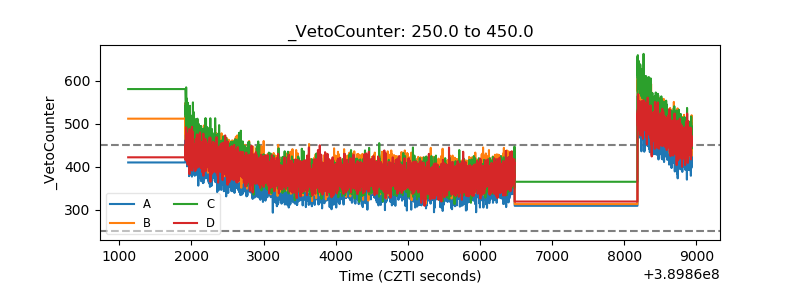 |