| Param | Original file | Final file |
|---|---|---|
| Filename | modeM0/AS1A10_058T14_9000005134_35759cztM0_level2.evt | modeM0/AS1A10_058T14_9000005134_35759cztM0_level2_quad_clean.evt |
| Size (bytes) | 636,281,280 | 73,909,440 |
| Size | 606.8 MB | 70.5 MB |
| Events in quadrant A | 3,855,209 | 482,454 |
| Events in quadrant B | 4,318,712 | 484,783 |
| Events in quadrant C | 3,131,485 | 472,183 |
| Events in quadrant D | 7,558,667 | 379,057 |
| Mode SS | |||
|---|---|---|---|
| Quadrant | BADHDUFLAG | Total packets | Discarded packets |
| A | 0 | 122 | 0 |
| B | 0 | 122 | 0 |
| C | 0 | 122 | 0 |
| D | 0 | 122 | 0 |
| Mode M9 | |||
|---|---|---|---|
| Quadrant | BADHDUFLAG | Total packets | Discarded packets |
| A | 0 | 30 | 0 |
| B | 0 | 30 | 0 |
| C | 0 | 30 | 0 |
| D | 0 | 30 | 0 |
| Mode M0 | |||
|---|---|---|---|
| Quadrant | BADHDUFLAG | Total packets | Discarded packets |
| A | 0 | 16039 | 3 |
| B | 0 | 16868 | 2 |
| C | 0 | 12986 | 2 |
| D | 0 | 26648 | 2 |
| Quadrant | Total seconds | Saturated seconds | Saturation percentage |
|---|---|---|---|
| A | 6001 | 52 | 0.866522% |
| B | 6001 | 512 | 8.531911% |
| C | 6001 | 72 | 1.199800% |
| D | 6001 | 1712 | 28.528579% |
Noise dominated data is calculated using 1-second bins in cleaned event files. If a bin has >2000 counts, and if more than 50% of those come from <1% of pixels, then it is considered to be noise-dominated and hence unusable.
| Quadrant | # 1 sec bins | Bins with >0 counts | Bins with >2000 counts | High rate bins dominated by noise | Noise dominated (total time) | Noise dominated (detector-on time) | Marked lightcurve |
|---|---|---|---|---|---|---|---|
| A | 8897 | 6003 | 39 | 39 | 0.44% | 0.65% | 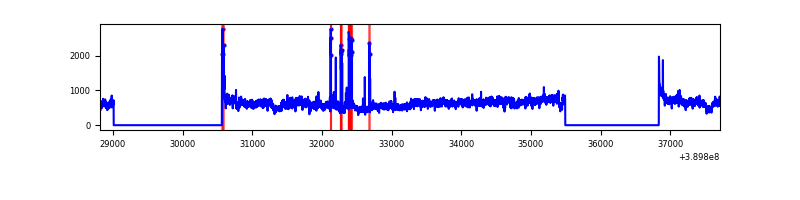 |
| B | 8897 | 6003 | 403 | 403 | 4.53% | 6.71% | 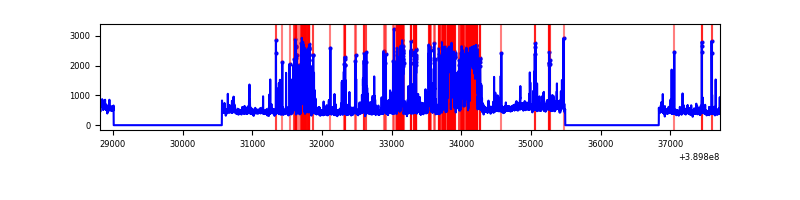 |
| C | 8897 | 6003 | 68 | 68 | 0.76% | 1.13% | 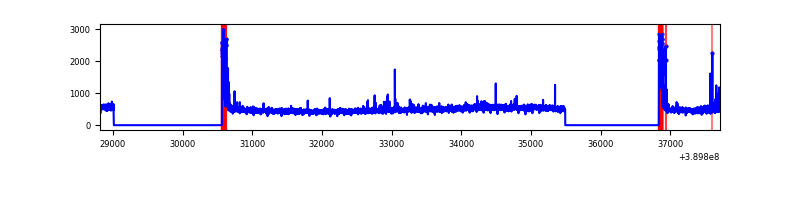 |
| D | 8897 | 6002 | 1711 | 1711 | 19.23% | 28.51% | 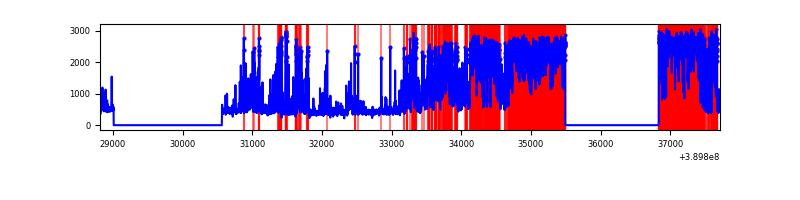 |
Top three noisy pixels from each quadrant. If the there are fewer than three noisy pixels in the level2.evt file, extra rows are filled as -1
| Pixel properties | Quadrant properties | ||||||
|---|---|---|---|---|---|---|---|
| Quadrant | DetID | PixID | Counts | Sigma | Mean | Median | Sigma |
| A | 15 | 223 | 873362 | 6321.63 | 684 | 671 | 138.0 |
| A | 10 | 83 | 160754 | 1159.62 | 684 | 671 | 138.0 |
| A | 15 | 169 | 128675 | 927.24 | 684 | 671 | 138.0 |
| B | 5 | 172 | 1376498 | 10765.42 | 660 | 642 | 127.8 |
| B | 5 | 255 | 95565 | 742.72 | 660 | 642 | 127.8 |
| B | 0 | 213 | 51806 | 400.33 | 660 | 642 | 127.8 |
| C | 15 | 214 | 250585 | 1622.65 | 661 | 665 | 154.0 |
| C | 0 | 10 | 235525 | 1524.87 | 661 | 665 | 154.0 |
| C | 0 | 207 | 52275 | 335.09 | 661 | 665 | 154.0 |
| D | 1 | 52 | 4040218 | 27611.61 | 595 | 578 | 146.3 |
| D | 7 | 80 | 685033 | 4678.36 | 595 | 578 | 146.3 |
| D | 13 | 249 | 219486 | 1496.27 | 595 | 578 | 146.3 |
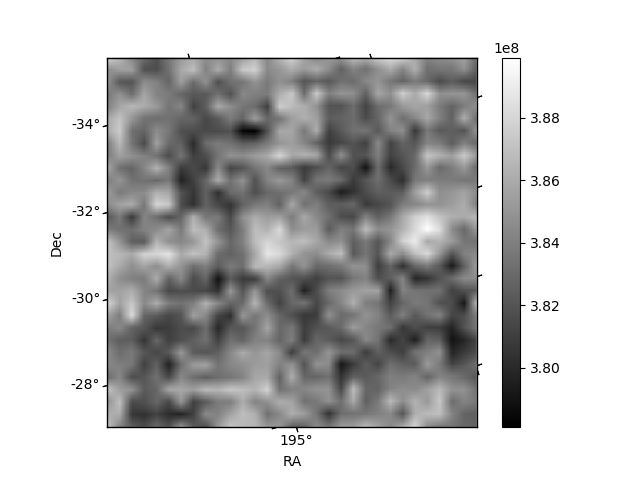
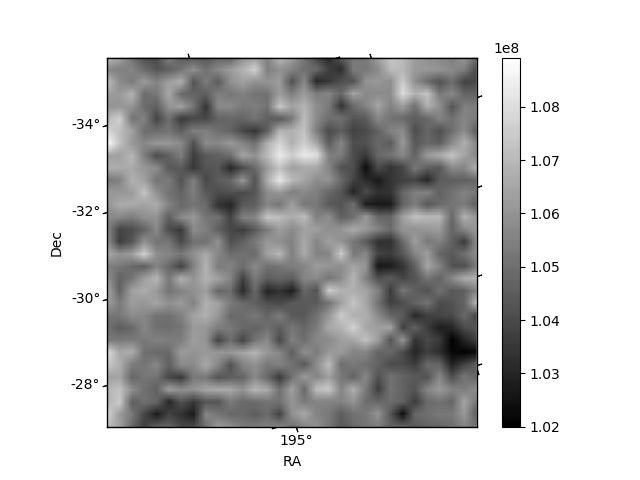
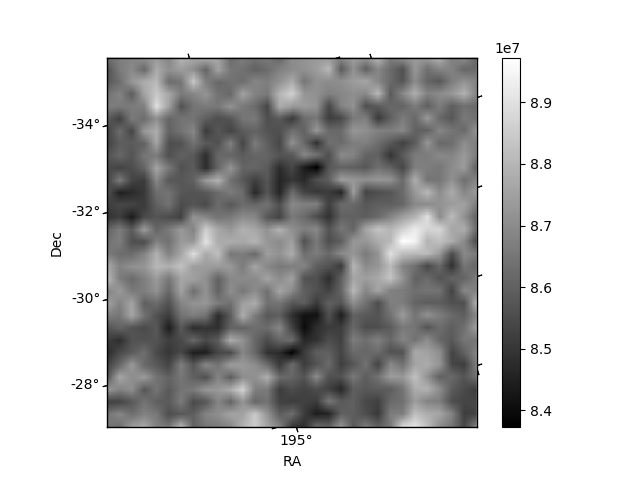
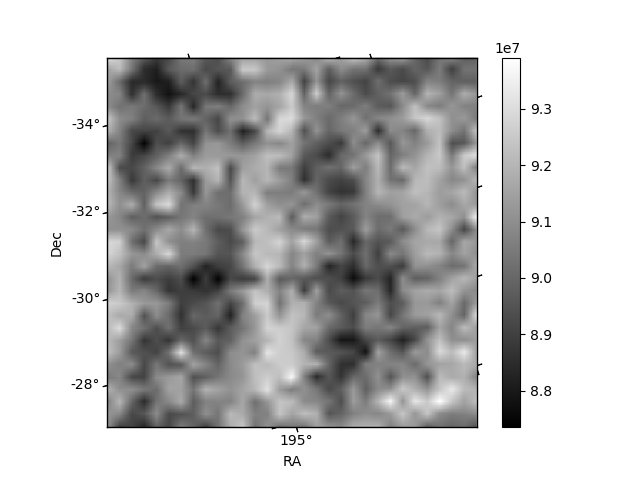
Histogram calculated using DETX and DETY for each event in the final _common_clean file
| Quadrant A | 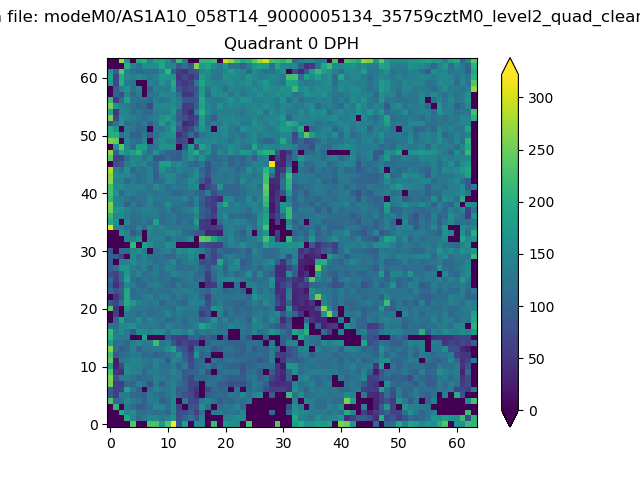 |
 |
Quadrant B |
|---|---|---|---|
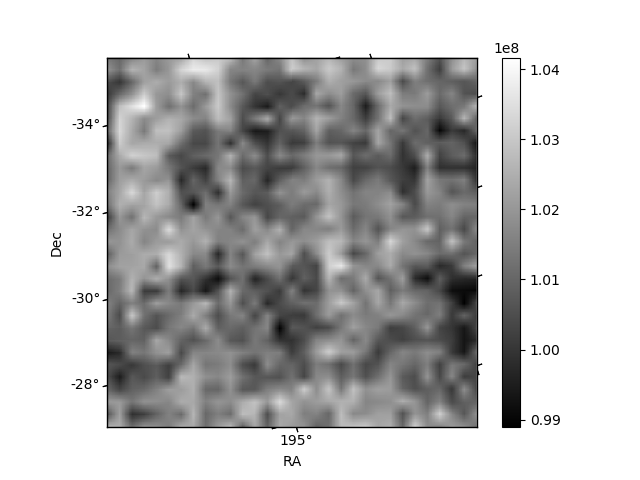
| Quadrant D | 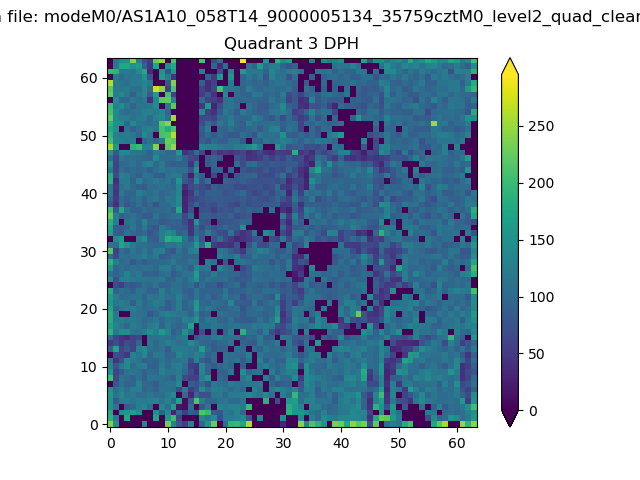 |
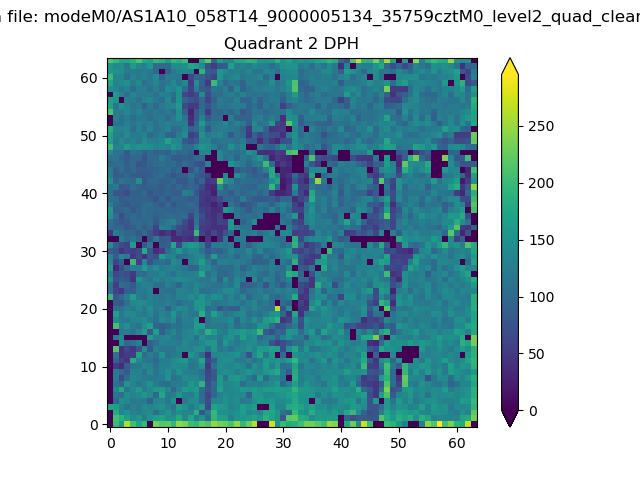 |
Quadrant C |
| Plot type | Count rate plots | Images |
|---|---|---|
| Comparison with Poisson distribution Blue bars denote a histogram of data divided into 1 sec bins. Red curve is a Poisson curve with rate = median count rate of data. |
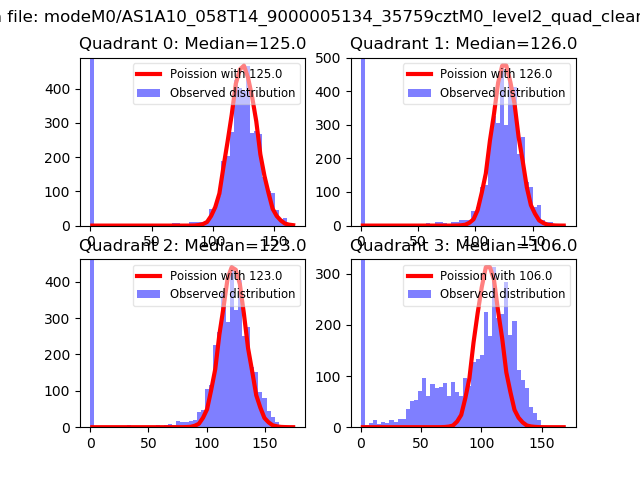 |
 |
| Quadrant-wise count rates Data is divided into 100 sec bins |
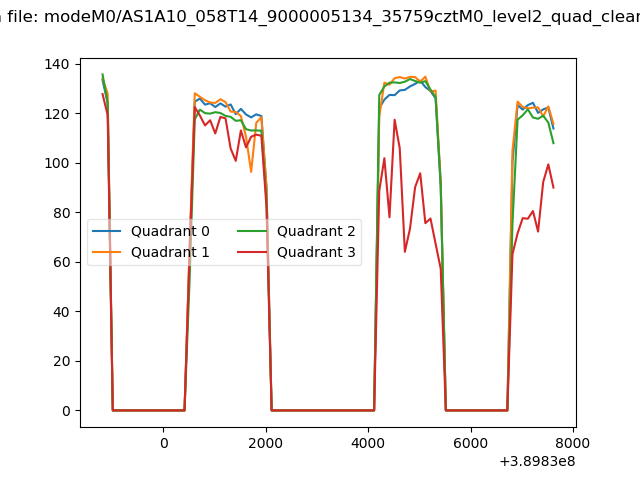 |
|
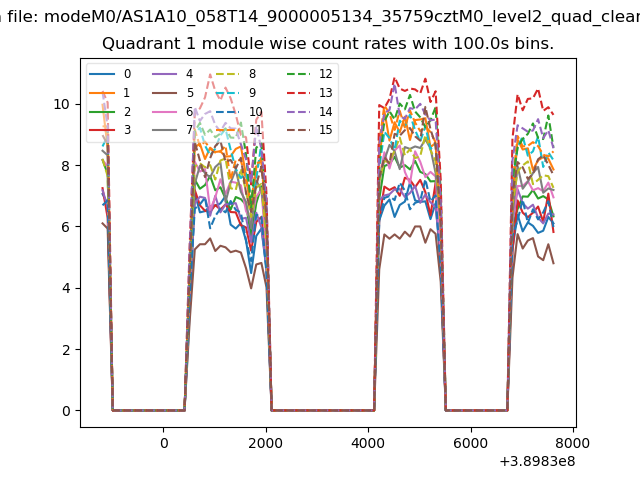
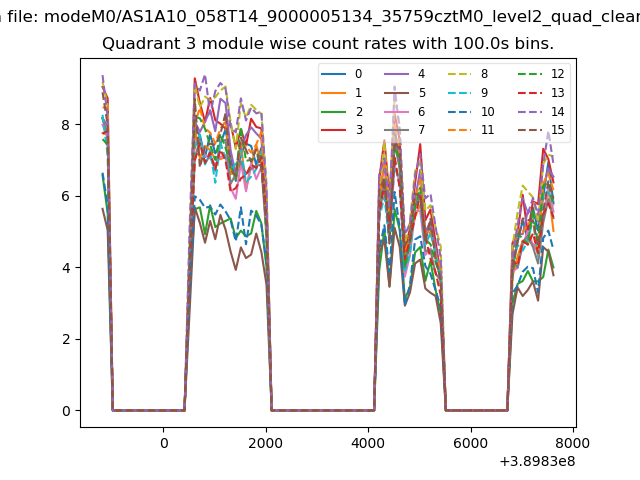
| Module-wise count rates for Quadrant A Data is divided into 100 sec bins |
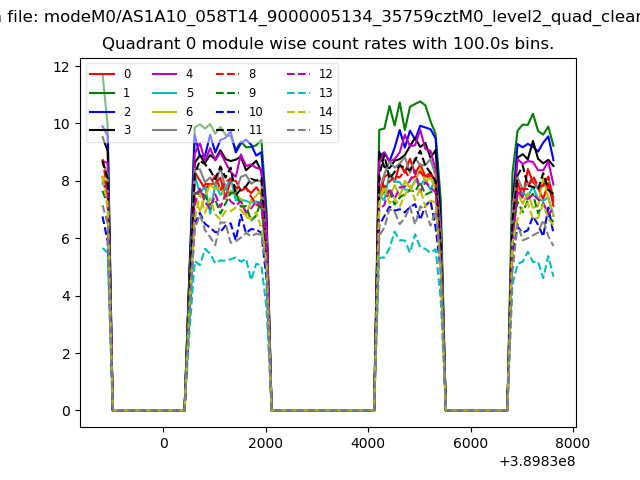 |
 |
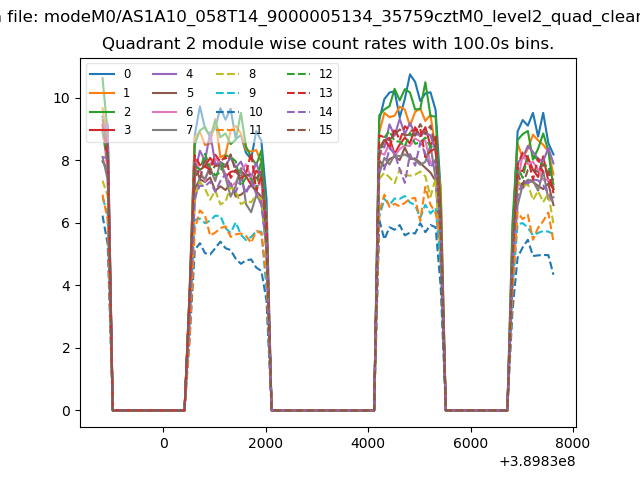
| Module-wise count rates for Quadrant B Data is divided into 100 sec bins |
 |
 |
| Module-wise count rates for Quadrant C Data is divided into 100 sec bins |
 |
 |
| Module-wise count rates for Quadrant D Data is divided into 100 sec bins |
 |
 |
| Parameter | Plot |
|---|---|
| CZT HV Monitor | 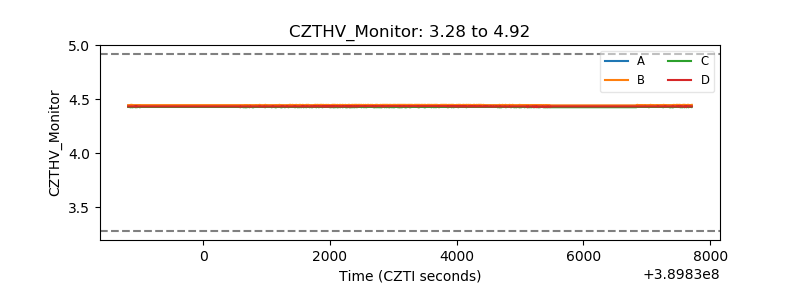 |
| D_VDD | 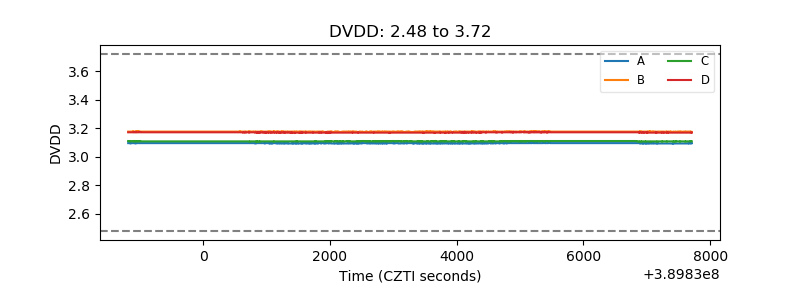 |
| Temperature 1 | 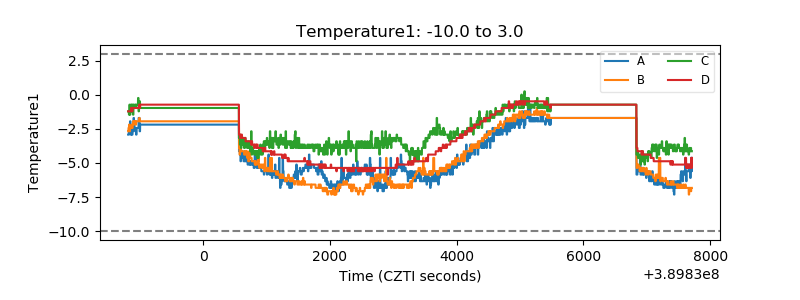 |
| Veto HV Monitor | 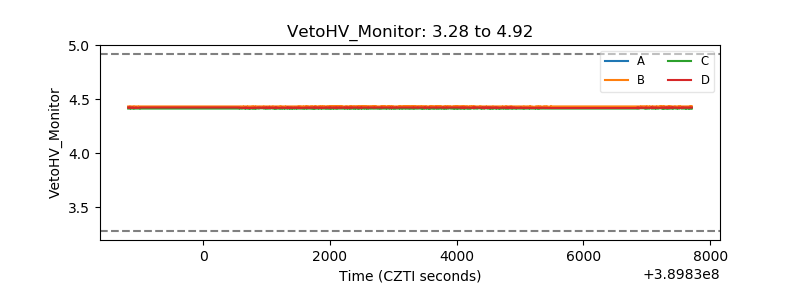 |
| Veto LLD | 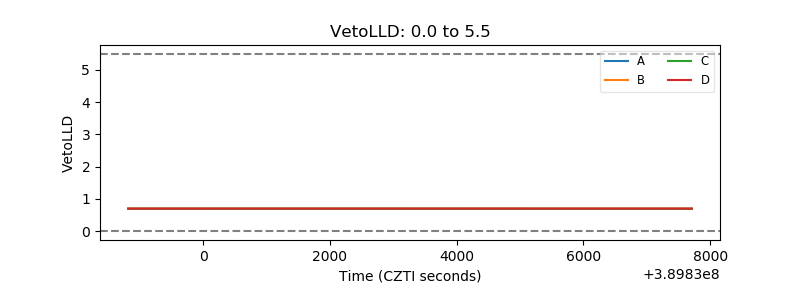 |
| Alpha Counter | 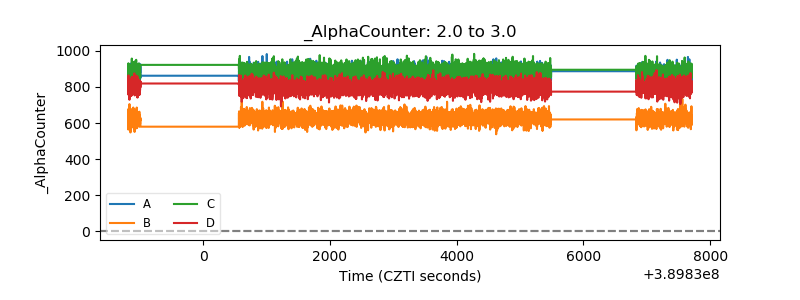 |
| _CPM_Rate | 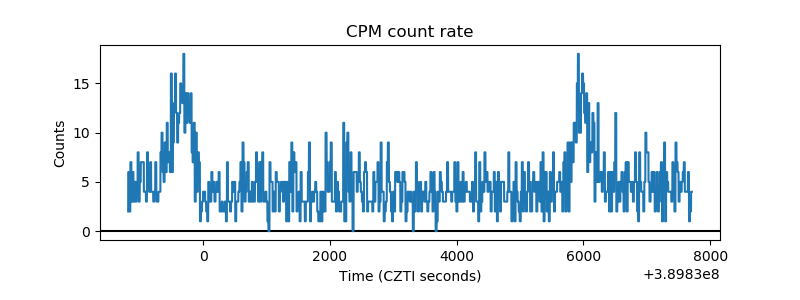 |
| CZT Counter | 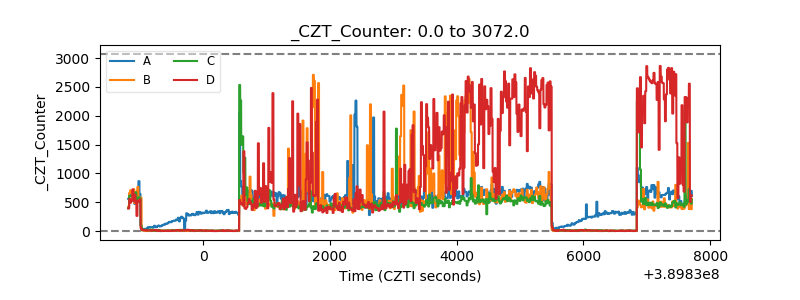 |
| +2.5 Volts monitor |  |
| +5 Volts monitor | 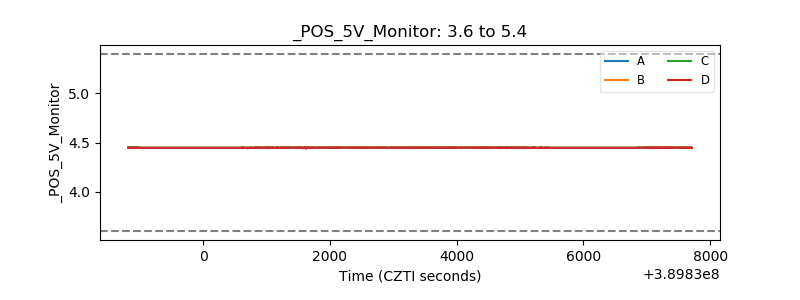 |
| _ROLL_ROT | 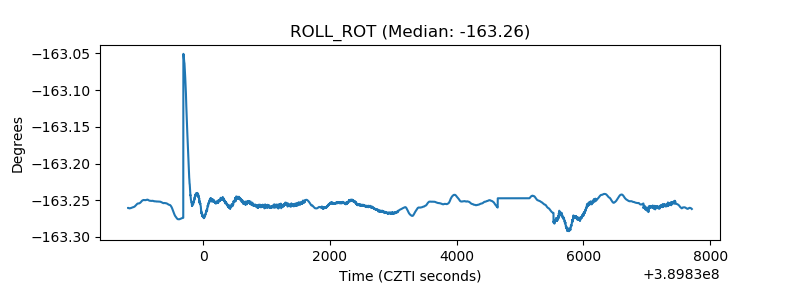 |
| _Roll_DEC | 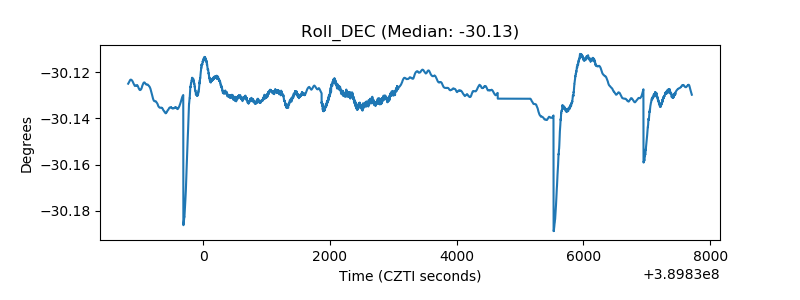 |
| _Roll_RA | 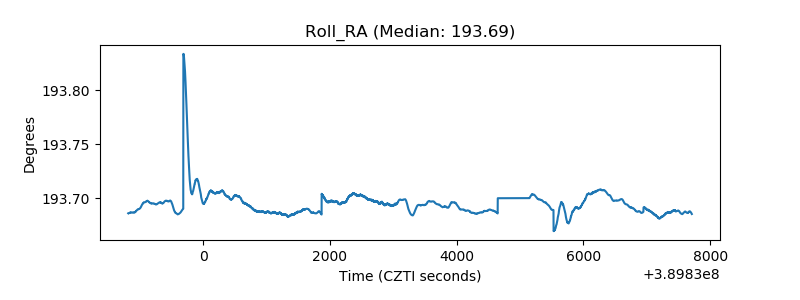 |
| Veto Counter | 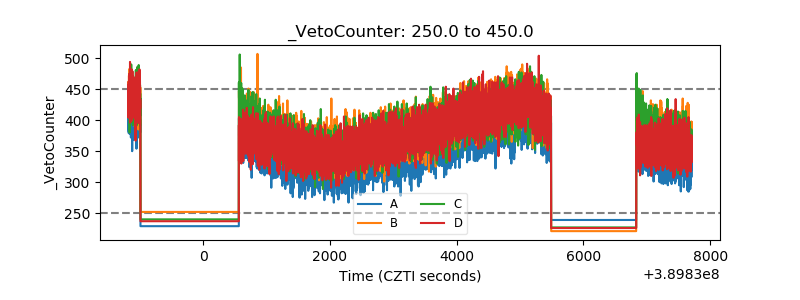 |