| Param | Original file | Final file |
|---|---|---|
| Filename | modeM0/AS1A09_143T10_9000005130_35751cztM0_level2.evt | modeM0/AS1A09_143T10_9000005130_35751cztM0_level2_quad_clean.evt |
| Size (bytes) | 143,913,600 | 24,416,640 |
| Size | 137.2 MB | 23.3 MB |
| Events in quadrant A | 885,955 | 162,458 |
| Events in quadrant B | 1,054,759 | 159,670 |
| Events in quadrant C | 951,381 | 154,861 |
| Events in quadrant D | 1,353,830 | 142,480 |
| Mode M0 | |||
|---|---|---|---|
| Quadrant | BADHDUFLAG | Total packets | Discarded packets |
| A | 0 | 3597 | 2 |
| B | 0 | 4125 | 1 |
| C | 0 | 3737 | 1 |
| D | 0 | 5133 | 1 |
| Mode SS | |||
|---|---|---|---|
| Quadrant | BADHDUFLAG | Total packets | Discarded packets |
| A | 0 | 34 | 0 |
| B | 0 | 34 | 0 |
| C | 0 | 34 | 0 |
| D | 0 | 34 | 0 |
| Mode M9 | |||
|---|---|---|---|
| Quadrant | BADHDUFLAG | Total packets | Discarded packets |
| A | 0 | 18 | 0 |
| B | 0 | 18 | 0 |
| C | 0 | 18 | 0 |
| D | 0 | 18 | 0 |
| Quadrant | Total seconds | Saturated seconds | Saturation percentage |
|---|---|---|---|
| A | 1622 | 3 | 0.184957% |
| B | 1622 | 82 | 5.055487% |
| C | 1622 | 40 | 2.466091% |
| D | 1622 | 146 | 9.001233% |
Noise dominated data is calculated using 1-second bins in cleaned event files. If a bin has >2000 counts, and if more than 50% of those come from <1% of pixels, then it is considered to be noise-dominated and hence unusable.
| Quadrant | # 1 sec bins | Bins with >0 counts | Bins with >2000 counts | High rate bins dominated by noise | Noise dominated (total time) | Noise dominated (detector-on time) | Marked lightcurve |
|---|---|---|---|---|---|---|---|
| A | 3385 | 1623 | 0 | 0 | 0.00% | 0.00% | 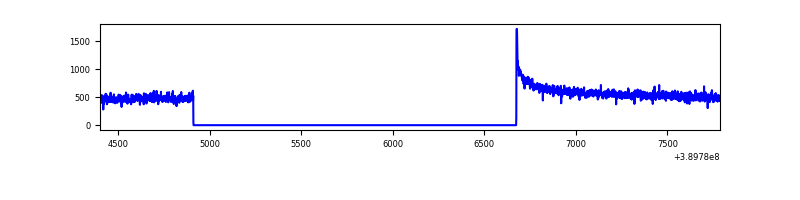 |
| B | 3385 | 1623 | 58 | 58 | 1.71% | 3.57% | 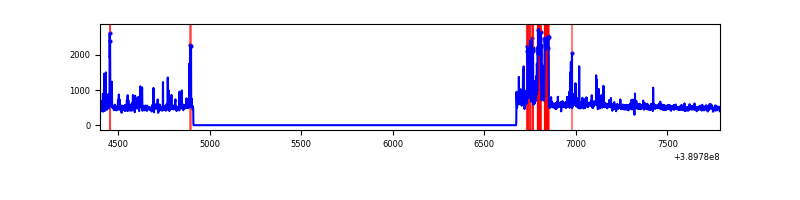 |
| C | 3385 | 1623 | 26 | 26 | 0.77% | 1.60% | 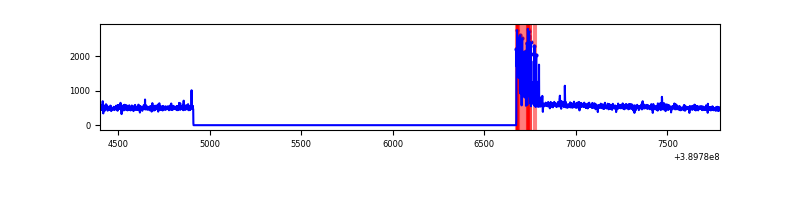 |
| D | 3384 | 1622 | 141 | 141 | 4.17% | 8.69% | 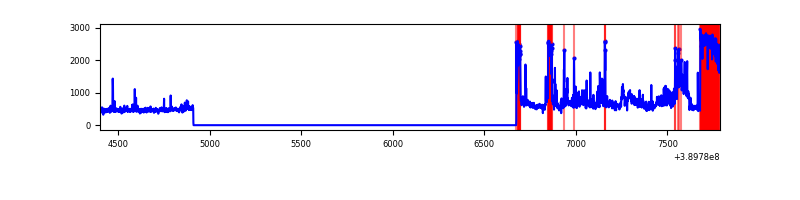 |
Top three noisy pixels from each quadrant. If the there are fewer than three noisy pixels in the level2.evt file, extra rows are filled as -1
| Pixel properties | Quadrant properties | ||||||
|---|---|---|---|---|---|---|---|
| Quadrant | DetID | PixID | Counts | Sigma | Mean | Median | Sigma |
| A | 10 | 83 | 63565 | 1435.38 | 210 | 206 | 44.1 |
| A | 13 | 6 | 5405 | 117.78 | 210 | 206 | 44.1 |
| A | 13 | 254 | 2325 | 48.01 | 210 | 206 | 44.1 |
| B | 5 | 172 | 200555 | 4966.26 | 201 | 197 | 40.3 |
| B | 4 | 232 | 16302 | 399.19 | 201 | 197 | 40.3 |
| B | 0 | 189 | 14850 | 363.2 | 201 | 197 | 40.3 |
| C | 0 | 10 | 100653 | 2106.56 | 198 | 199 | 47.7 |
| C | 15 | 214 | 70634 | 1477.05 | 198 | 199 | 47.7 |
| C | 15 | 208 | 5984 | 121.31 | 198 | 199 | 47.7 |
| D | 14 | 52 | 486032 | 9946.18 | 195 | 189 | 48.8 |
| D | 14 | 226 | 37690 | 767.72 | 195 | 189 | 48.8 |
| D | 2 | 250 | 31036 | 631.5 | 195 | 189 | 48.8 |
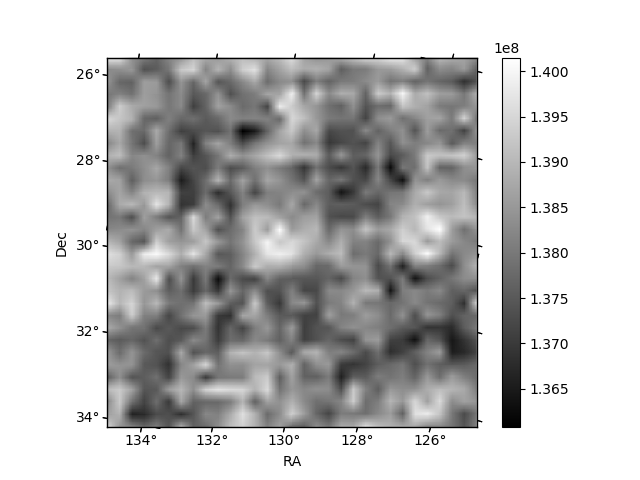
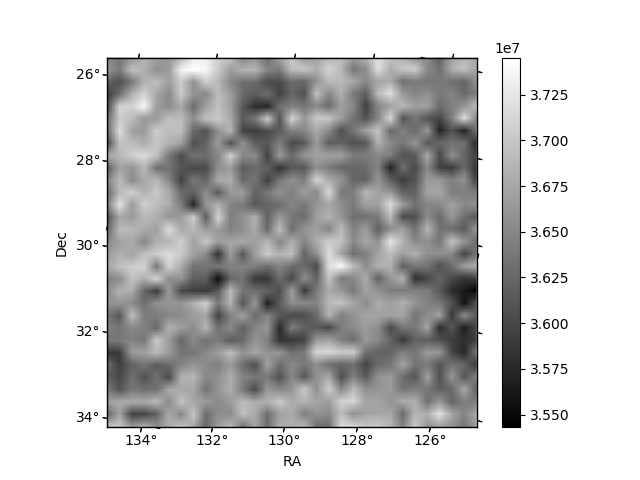
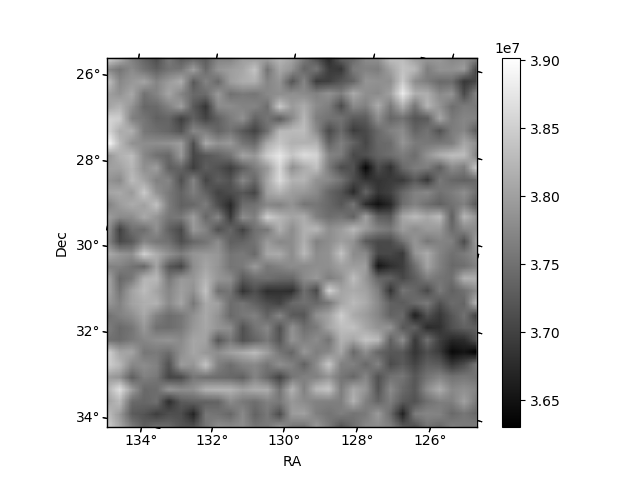
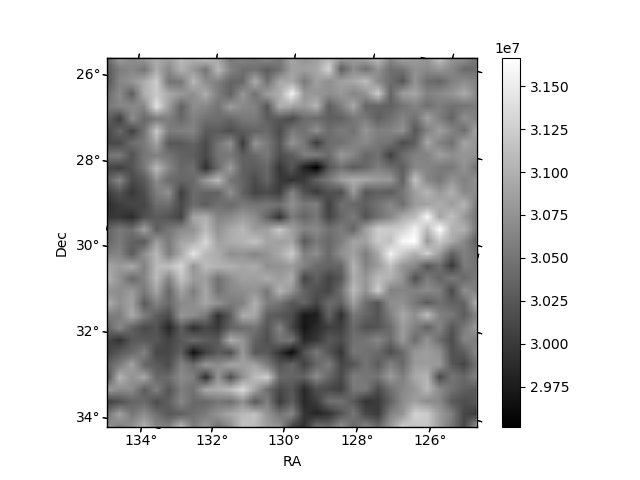
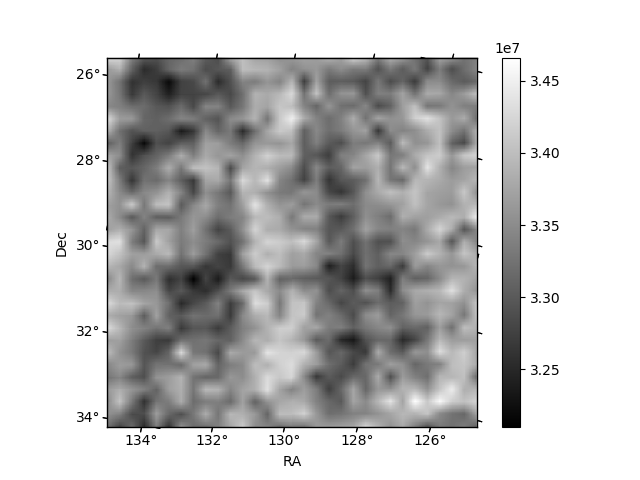
Histogram calculated using DETX and DETY for each event in the final _common_clean file
| Quadrant A | 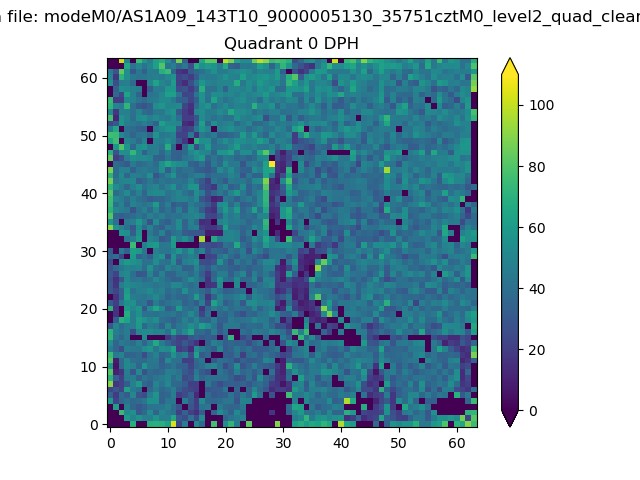 |
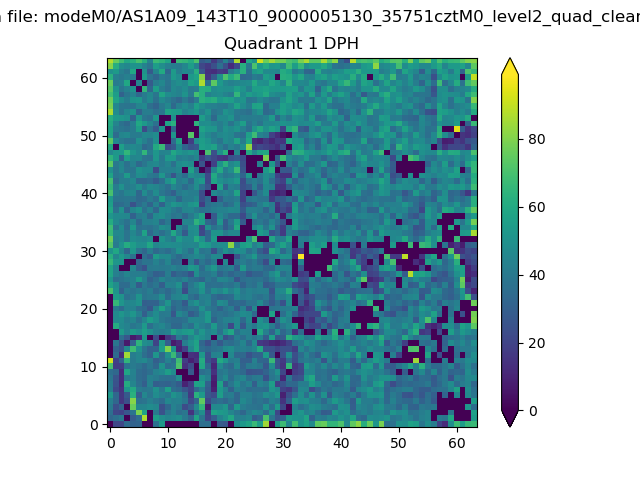 |
Quadrant B |
|---|---|---|---|
| Quadrant D | 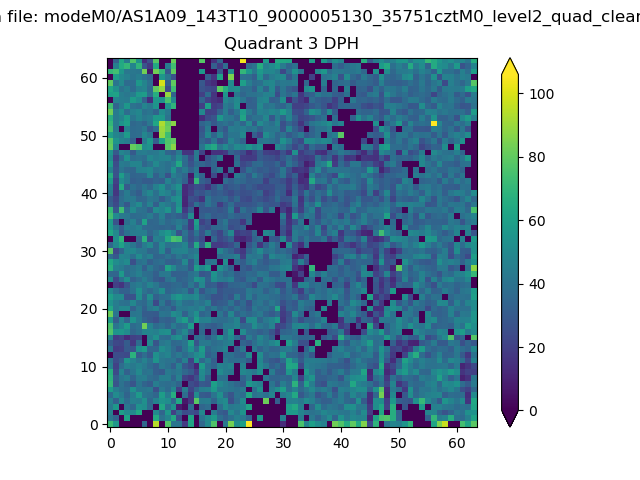 |
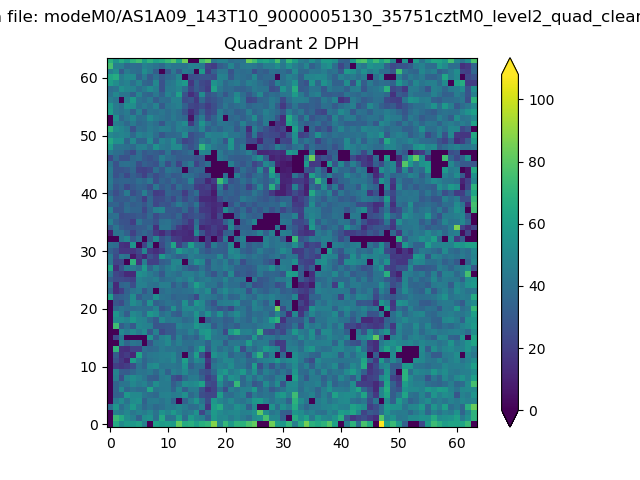 |
Quadrant C |
| Plot type | Count rate plots | Images |
|---|---|---|
| Comparison with Poisson distribution Blue bars denote a histogram of data divided into 1 sec bins. Red curve is a Poisson curve with rate = median count rate of data. |
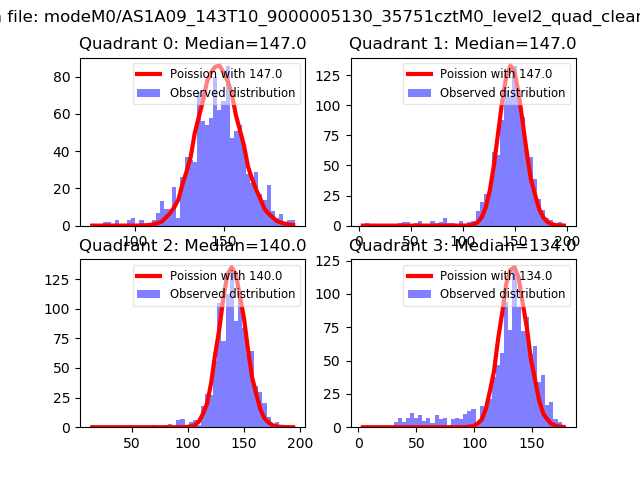 |
 |
| Quadrant-wise count rates Data is divided into 100 sec bins |
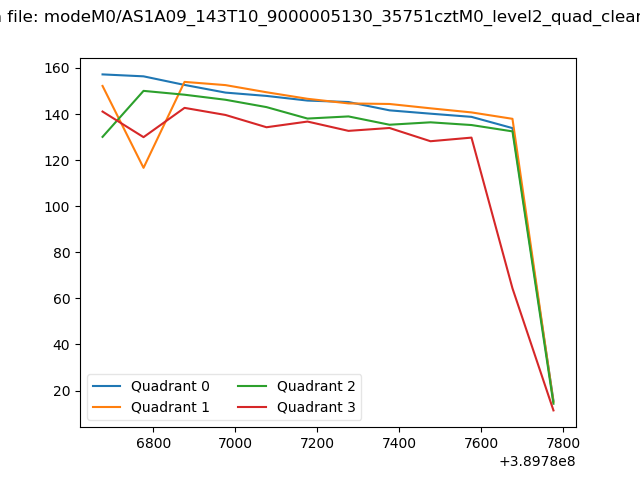 |
|
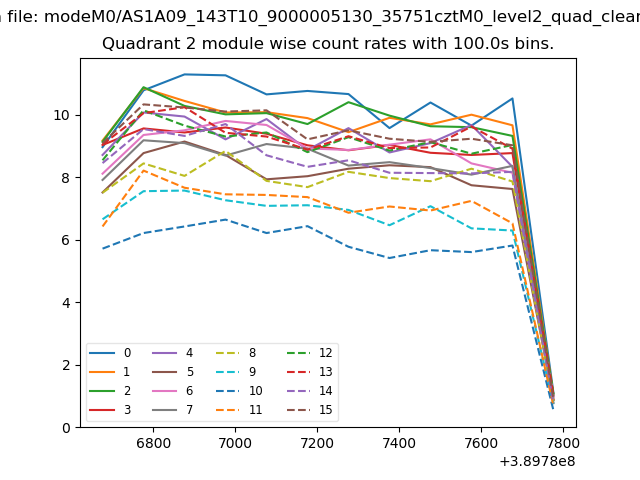
| Module-wise count rates for Quadrant A Data is divided into 100 sec bins |
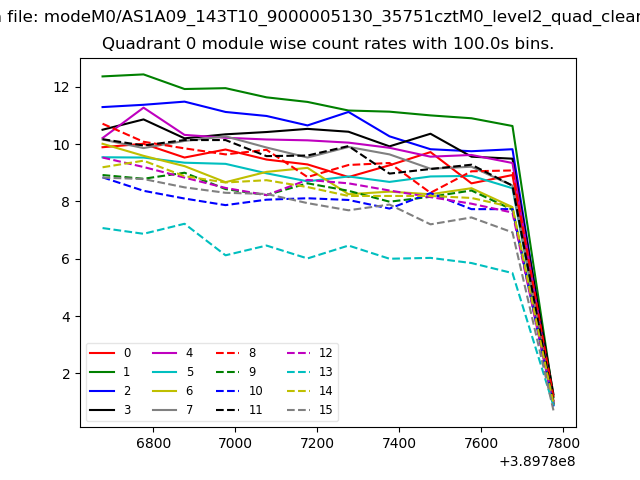 |
 |
| Module-wise count rates for Quadrant B Data is divided into 100 sec bins |
 |
 |
| Module-wise count rates for Quadrant C Data is divided into 100 sec bins |
 |
 |
| Module-wise count rates for Quadrant D Data is divided into 100 sec bins |
 |
 |
| Parameter | Plot |
|---|---|
| CZT HV Monitor | 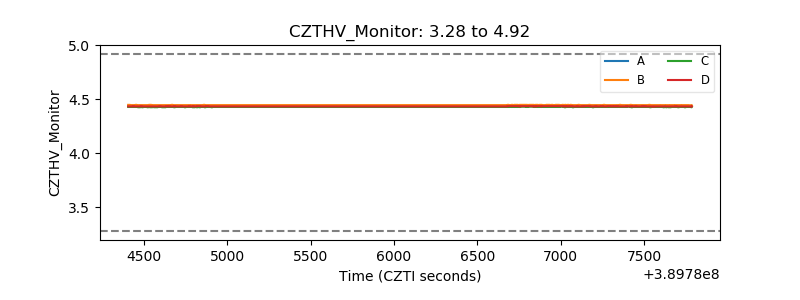 |
| D_VDD | 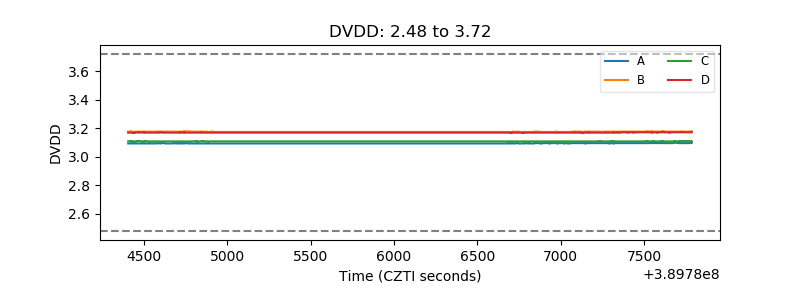 |
| Temperature 1 | 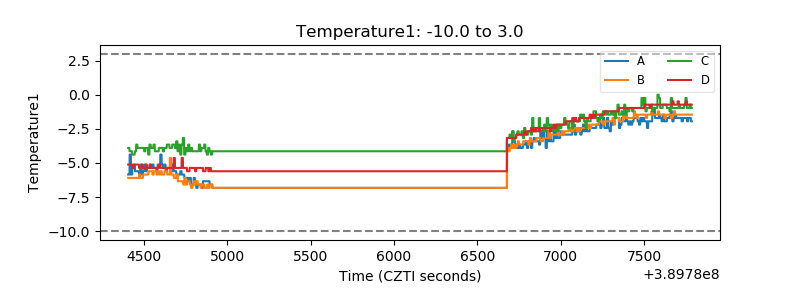 |
| Veto HV Monitor | 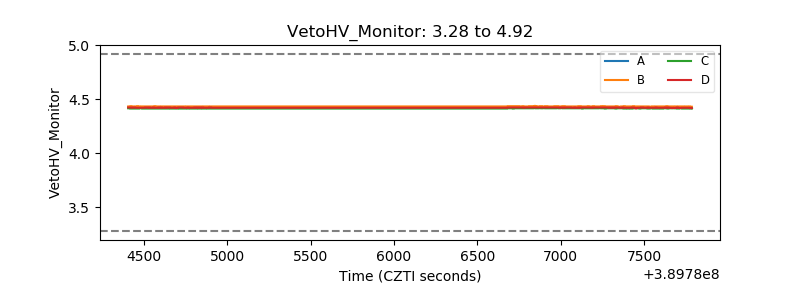 |
| Veto LLD | 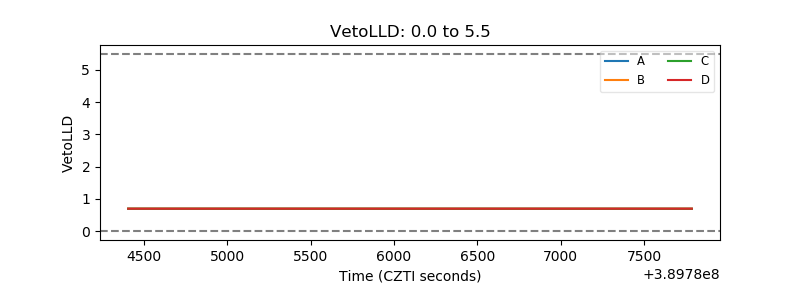 |
| Alpha Counter | 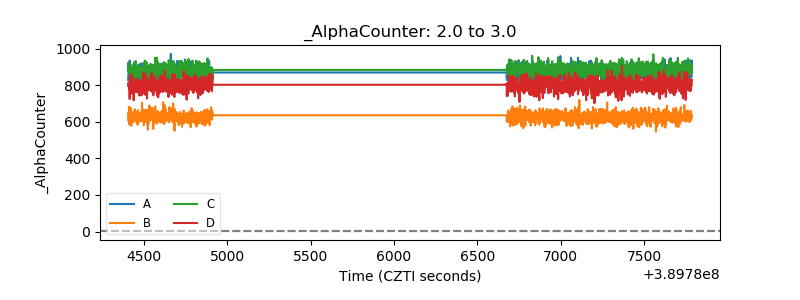 |
| _CPM_Rate | 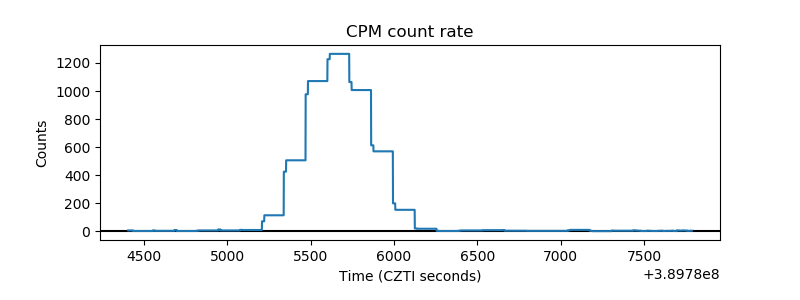 |
| CZT Counter | 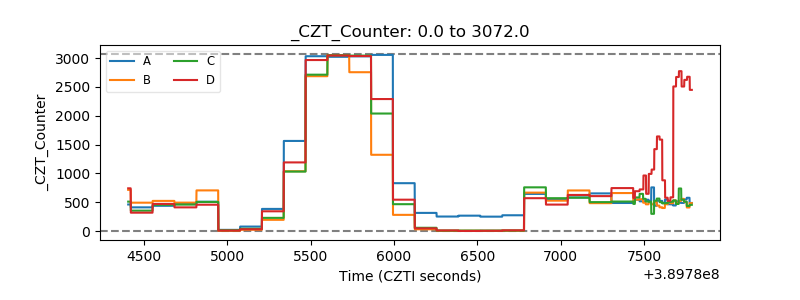 |
| +2.5 Volts monitor |  |
| +5 Volts monitor | 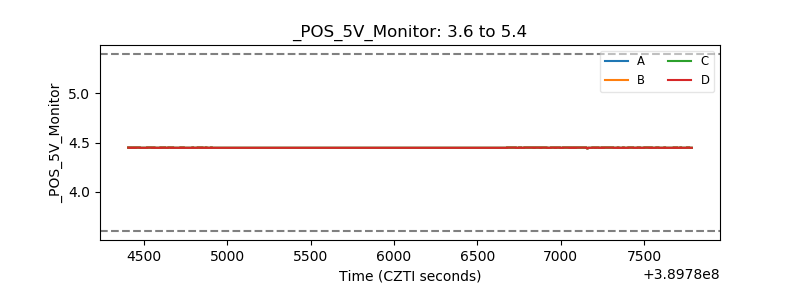 |
| _ROLL_ROT | 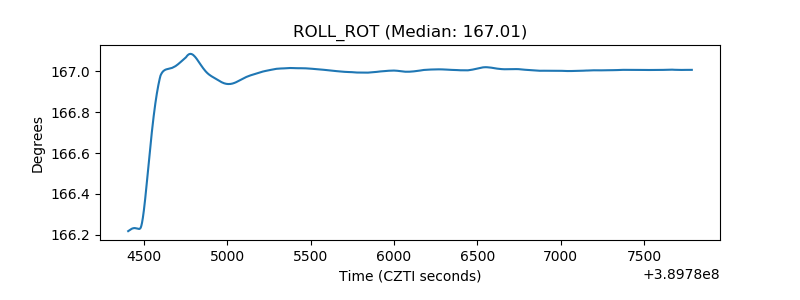 |
| _Roll_DEC | 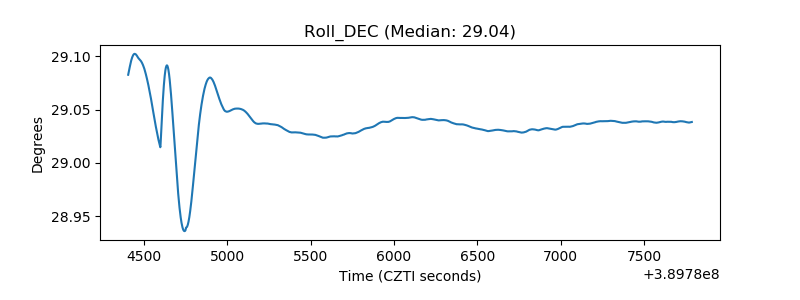 |
| _Roll_RA | 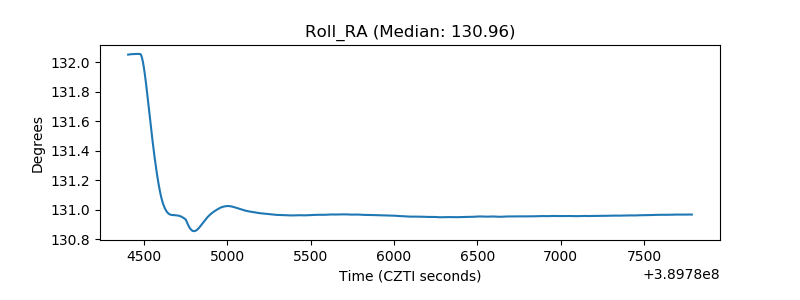 |
| Veto Counter | 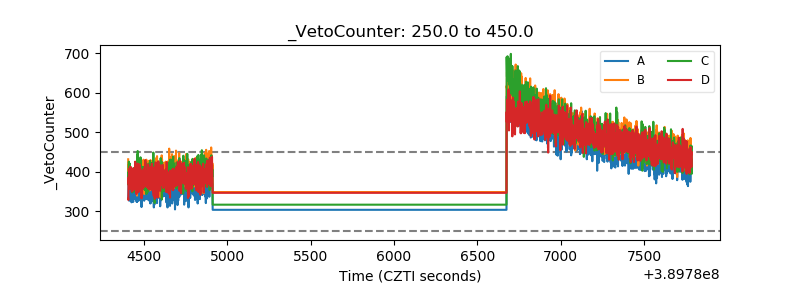 |