| Param | Original file | Final file |
|---|---|---|
| Filename | modeM0/AS1A09_142T06_9000005132_35758cztM0_level2.evt | modeM0/AS1A09_142T06_9000005132_35758cztM0_level2_quad_clean.evt |
| Size (bytes) | 438,713,280 | 63,328,320 |
| Size | 418.4 MB | 60.4 MB |
| Events in quadrant A | 3,042,666 | 393,947 |
| Events in quadrant B | 3,735,421 | 398,669 |
| Events in quadrant C | 2,647,117 | 396,777 |
| Events in quadrant D | 3,518,912 | 374,726 |
| Mode M0 | |||
|---|---|---|---|
| Quadrant | BADHDUFLAG | Total packets | Discarded packets |
| A | 0 | 12346 | 2 |
| B | 0 | 14497 | 2 |
| C | 0 | 10920 | 2 |
| D | 0 | 13920 | 2 |
| Mode SS | |||
|---|---|---|---|
| Quadrant | BADHDUFLAG | Total packets | Discarded packets |
| A | 0 | 102 | 0 |
| B | 0 | 102 | 0 |
| C | 0 | 102 | 0 |
| D | 0 | 102 | 0 |
| Mode M9 | |||
|---|---|---|---|
| Quadrant | BADHDUFLAG | Total packets | Discarded packets |
| A | 0 | 29 | 0 |
| B | 0 | 29 | 0 |
| C | 0 | 29 | 0 |
| D | 0 | 30 | 0 |
| Quadrant | Total seconds | Saturated seconds | Saturation percentage |
|---|---|---|---|
| A | 5041 | 166 | 3.292997% |
| B | 5041 | 521 | 10.335251% |
| C | 5041 | 95 | 1.884547% |
| D | 5041 | 295 | 5.852013% |
Noise dominated data is calculated using 1-second bins in cleaned event files. If a bin has >2000 counts, and if more than 50% of those come from <1% of pixels, then it is considered to be noise-dominated and hence unusable.
| Quadrant | # 1 sec bins | Bins with >0 counts | Bins with >2000 counts | High rate bins dominated by noise | Noise dominated (total time) | Noise dominated (detector-on time) | Marked lightcurve |
|---|---|---|---|---|---|---|---|
| A | 6923 | 5042 | 165 | 165 | 2.38% | 3.27% | 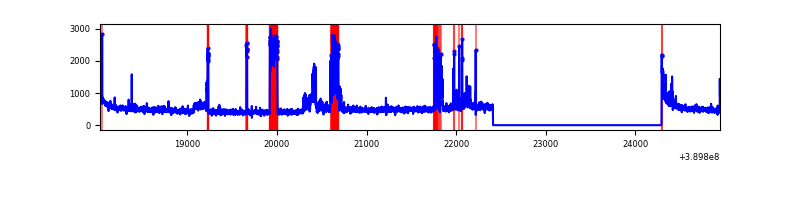 |
| B | 6923 | 5042 | 441 | 441 | 6.37% | 8.75% | 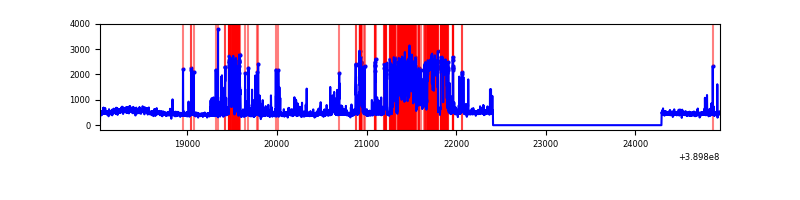 |
| C | 6923 | 5042 | 78 | 78 | 1.13% | 1.55% | 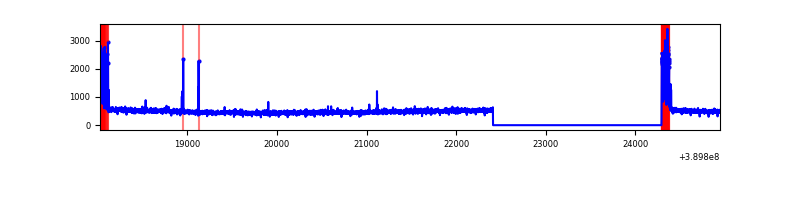 |
| D | 6923 | 5042 | 316 | 316 | 4.56% | 6.27% | 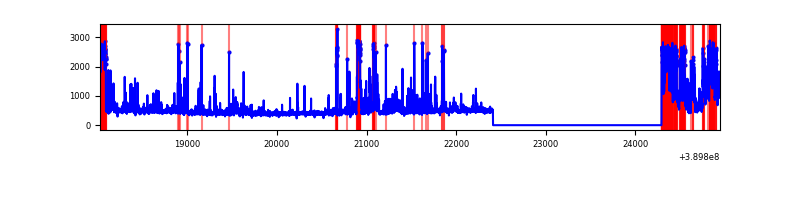 |
Top three noisy pixels from each quadrant. If the there are fewer than three noisy pixels in the level2.evt file, extra rows are filled as -1
| Pixel properties | Quadrant properties | ||||||
|---|---|---|---|---|---|---|---|
| Quadrant | DetID | PixID | Counts | Sigma | Mean | Median | Sigma |
| A | 15 | 223 | 281691 | 2471.57 | 560 | 548 | 113.8 |
| A | 8 | 192 | 271804 | 2384.65 | 560 | 548 | 113.8 |
| A | 15 | 169 | 158975 | 1392.75 | 560 | 548 | 113.8 |
| B | 5 | 172 | 1447943 | 14025.66 | 536 | 520 | 103.2 |
| B | 4 | 232 | 52123 | 500.04 | 536 | 520 | 103.2 |
| B | 0 | 190 | 51915 | 498.02 | 536 | 520 | 103.2 |
| C | 0 | 10 | 260839 | 2016.31 | 552 | 556 | 129.1 |
| C | 15 | 214 | 211766 | 1636.16 | 552 | 556 | 129.1 |
| C | 9 | 69 | 9390 | 68.43 | 552 | 556 | 129.1 |
| D | 1 | 52 | 729599 | 5567.8 | 541 | 527 | 130.9 |
| D | 13 | 249 | 181415 | 1381.41 | 541 | 527 | 130.9 |
| D | 10 | 253 | 106654 | 810.47 | 541 | 527 | 130.9 |
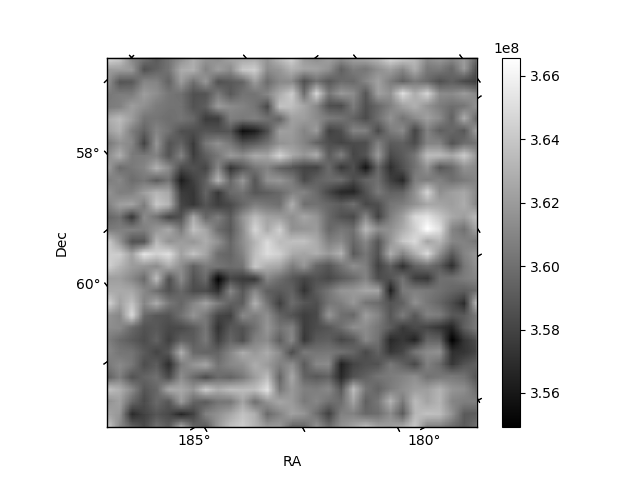
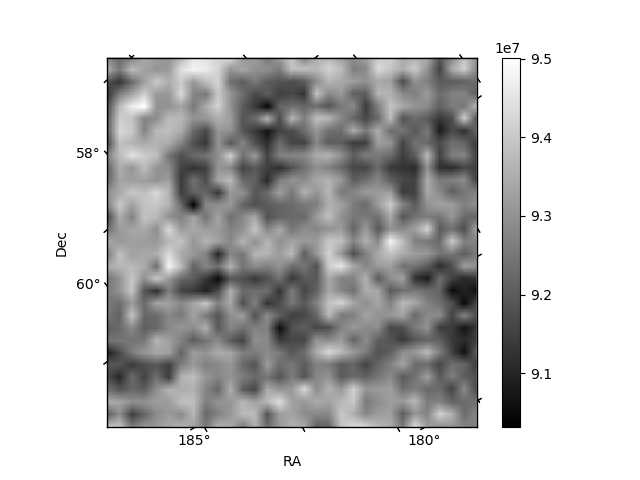
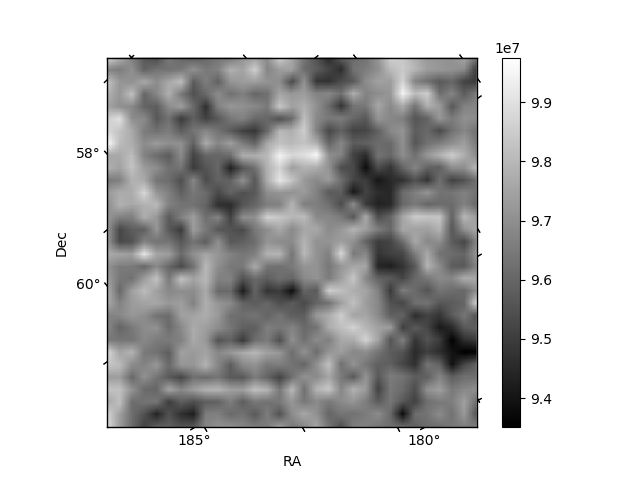
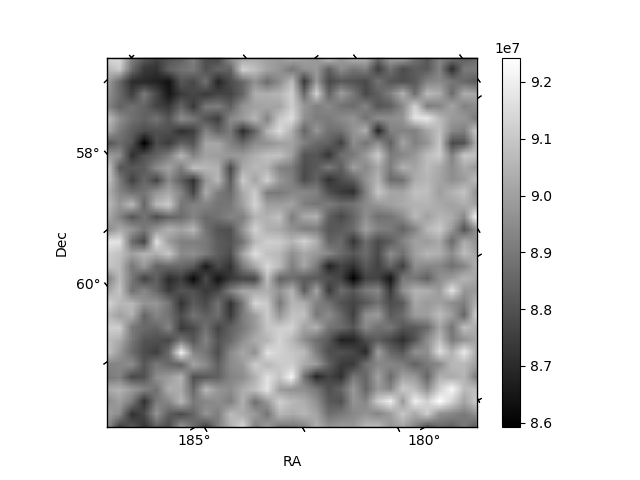
Histogram calculated using DETX and DETY for each event in the final _common_clean file
| Quadrant A | 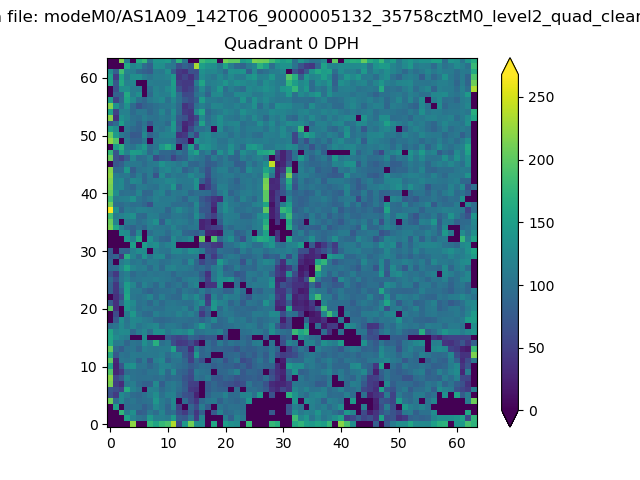 |
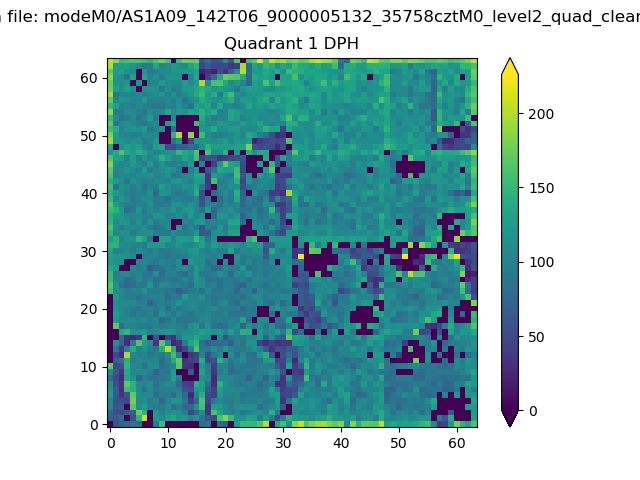 |
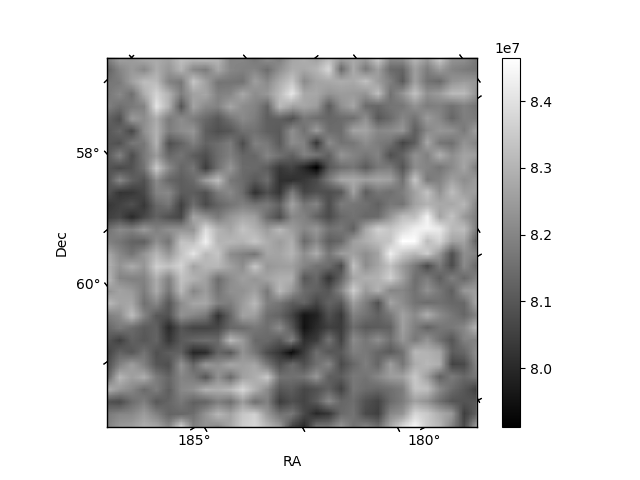
Quadrant B |
|---|---|---|---|
| Quadrant D | 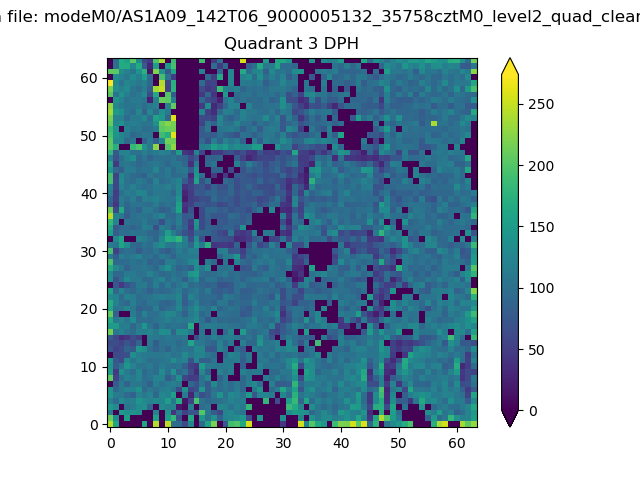 |
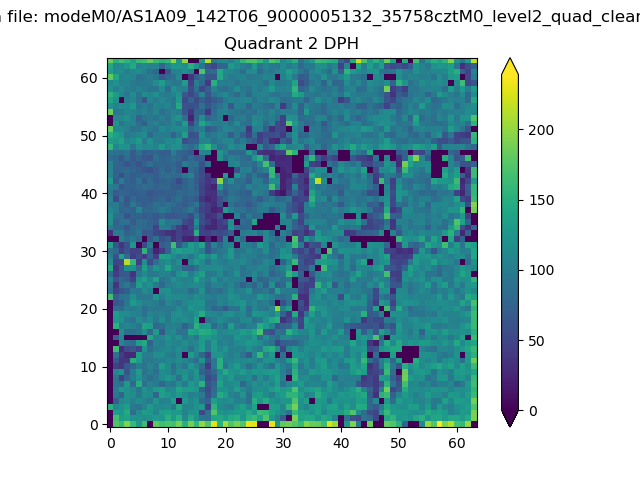 |
Quadrant C |
| Plot type | Count rate plots | Images |
|---|---|---|
| Comparison with Poisson distribution Blue bars denote a histogram of data divided into 1 sec bins. Red curve is a Poisson curve with rate = median count rate of data. |
 |
 |
| Quadrant-wise count rates Data is divided into 100 sec bins |
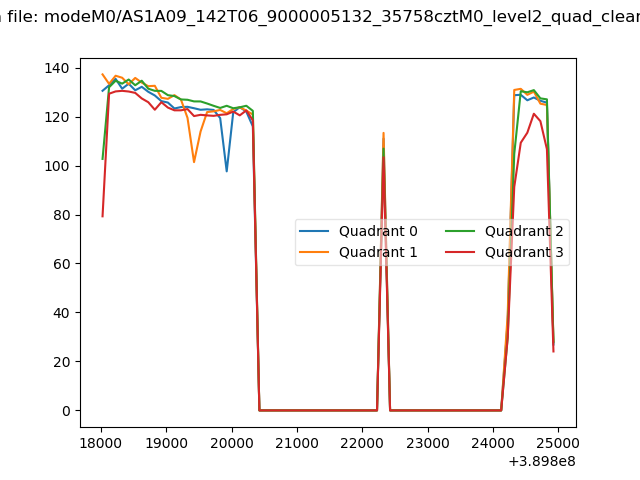 |
|
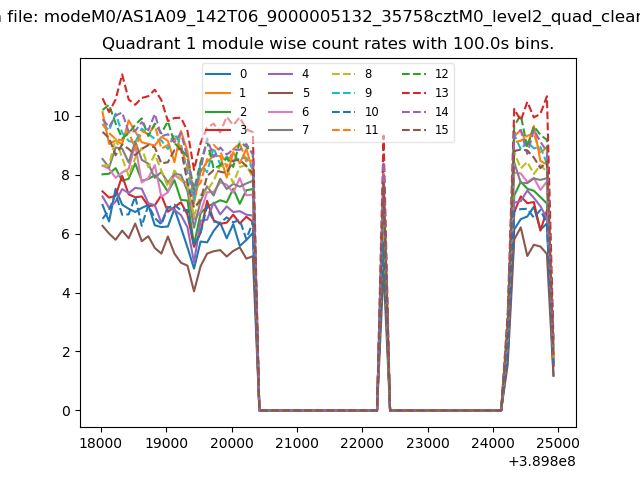
| Module-wise count rates for Quadrant A Data is divided into 100 sec bins |
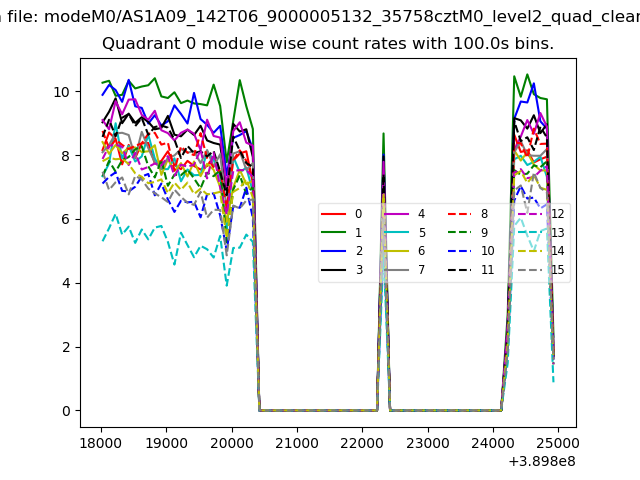 |
 |
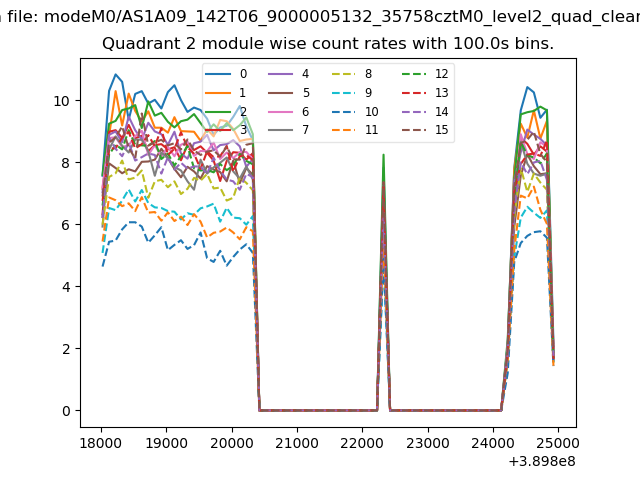
| Module-wise count rates for Quadrant B Data is divided into 100 sec bins |
 |
 |
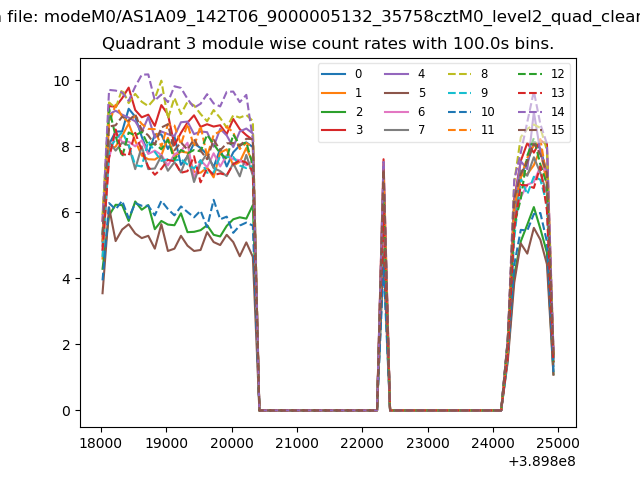
| Module-wise count rates for Quadrant C Data is divided into 100 sec bins |
 |
 |
| Module-wise count rates for Quadrant D Data is divided into 100 sec bins |
 |
 |
| Parameter | Plot |
|---|---|
| CZT HV Monitor | 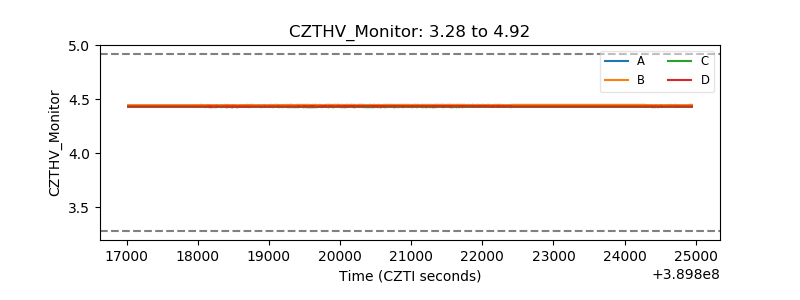 |
| D_VDD | 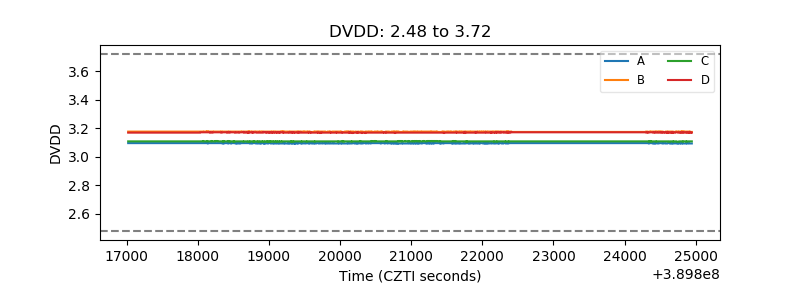 |
| Temperature 1 | 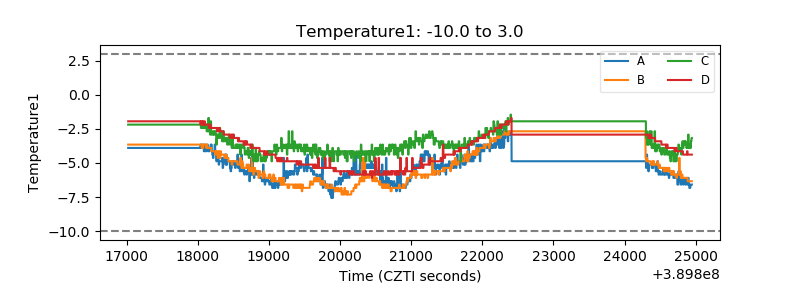 |
| Veto HV Monitor | 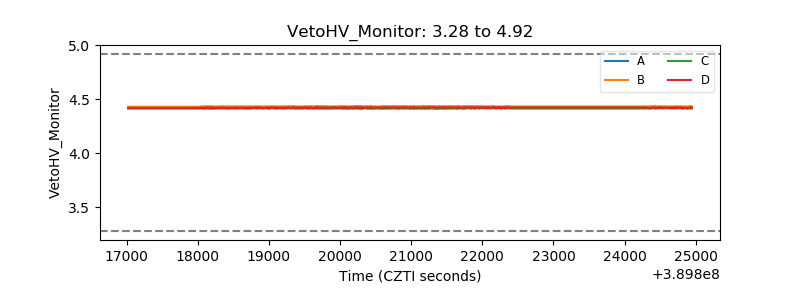 |
| Veto LLD | 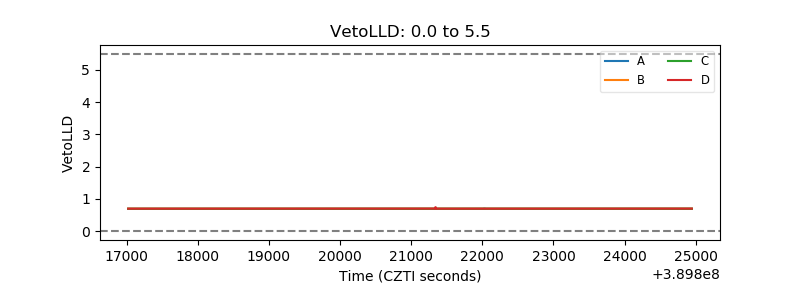 |
| Alpha Counter | 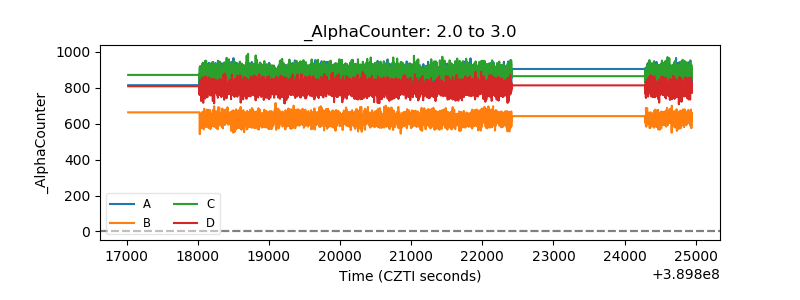 |
| _CPM_Rate | 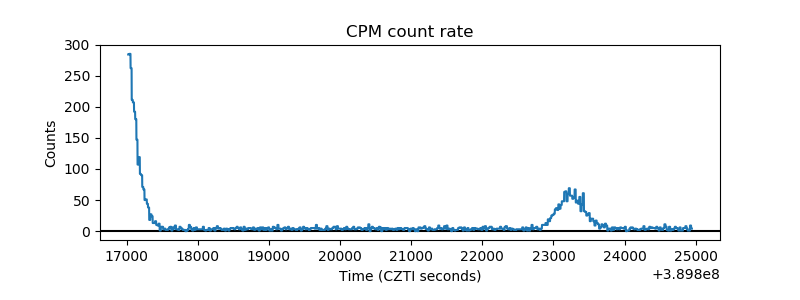 |
| CZT Counter | 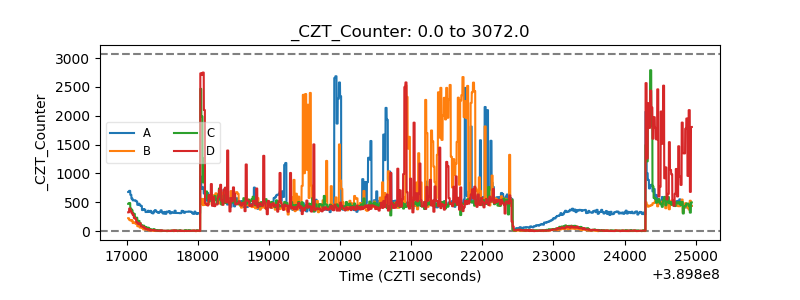 |
| +2.5 Volts monitor | 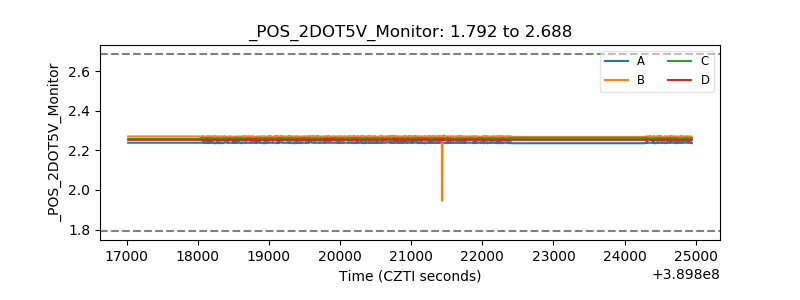 |
| +5 Volts monitor | 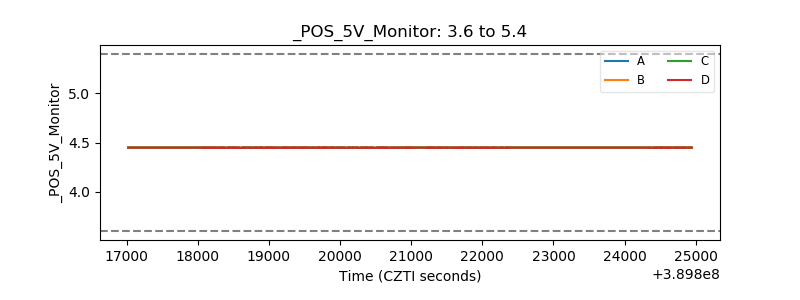 |
| _ROLL_ROT | 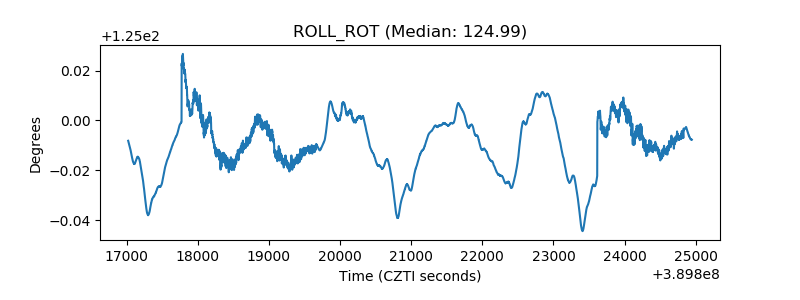 |
| _Roll_DEC | 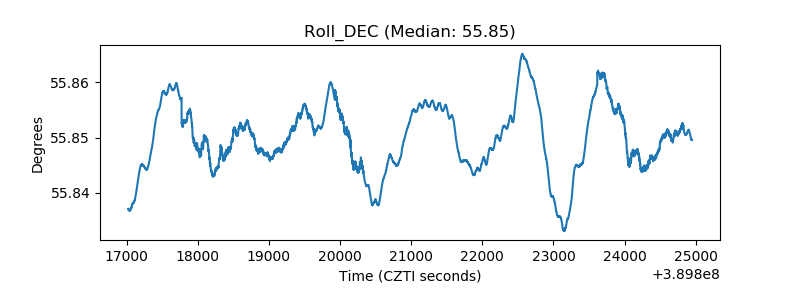 |
| _Roll_RA | 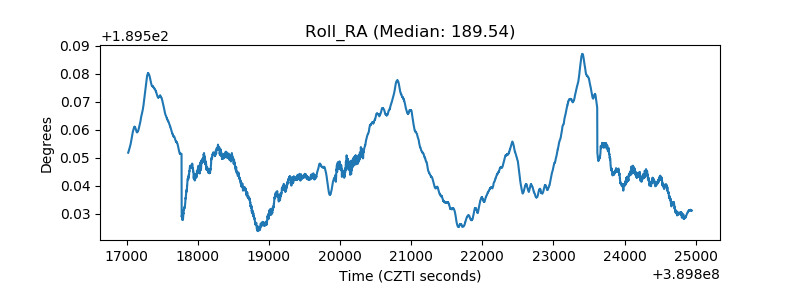 |
| Veto Counter | 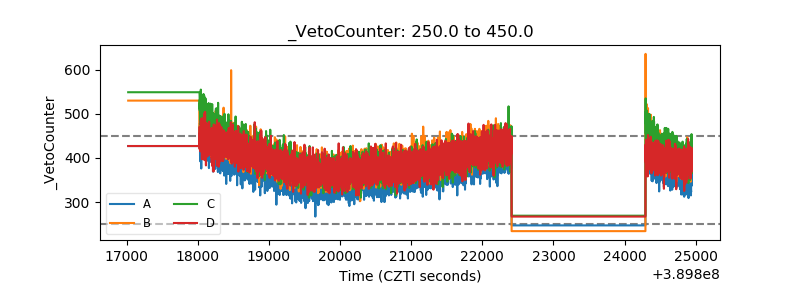 |