| Param | Original file | Final file |
|---|---|---|
| Filename | modeM0/AS1A09_142T06_9000005132_35756cztM0_level2.evt | modeM0/AS1A09_142T06_9000005132_35756cztM0_level2_quad_clean.evt |
| Size (bytes) | 382,000,320 | 72,722,880 |
| Size | 364.3 MB | 69.4 MB |
| Events in quadrant A | 2,509,742 | 468,590 |
| Events in quadrant B | 3,122,272 | 475,044 |
| Events in quadrant C | 2,699,085 | 469,071 |
| Events in quadrant D | 2,907,130 | 448,560 |
| Mode M0 | |||
|---|---|---|---|
| Quadrant | BADHDUFLAG | Total packets | Discarded packets |
| A | 0 | 10589 | 3 |
| B | 0 | 12426 | 2 |
| C | 0 | 10839 | 2 |
| D | 0 | 11860 | 2 |
| Mode SS | |||
|---|---|---|---|
| Quadrant | BADHDUFLAG | Total packets | Discarded packets |
| A | 0 | 98 | 0 |
| B | 0 | 98 | 0 |
| C | 0 | 98 | 0 |
| D | 0 | 98 | 0 |
| Mode M9 | |||
|---|---|---|---|
| Quadrant | BADHDUFLAG | Total packets | Discarded packets |
| A | 0 | 24 | 0 |
| B | 0 | 24 | 0 |
| C | 0 | 24 | 0 |
| D | 0 | 25 | 0 |
| Quadrant | Total seconds | Saturated seconds | Saturation percentage |
|---|---|---|---|
| A | 4860 | 72 | 1.481481% |
| B | 4860 | 323 | 6.646091% |
| C | 4860 | 101 | 2.078189% |
| D | 4860 | 174 | 3.580247% |
Noise dominated data is calculated using 1-second bins in cleaned event files. If a bin has >2000 counts, and if more than 50% of those come from <1% of pixels, then it is considered to be noise-dominated and hence unusable.
| Quadrant | # 1 sec bins | Bins with >0 counts | Bins with >2000 counts | High rate bins dominated by noise | Noise dominated (total time) | Noise dominated (detector-on time) | Marked lightcurve |
|---|---|---|---|---|---|---|---|
| A | 6952 | 4861 | 66 | 66 | 0.95% | 1.36% | 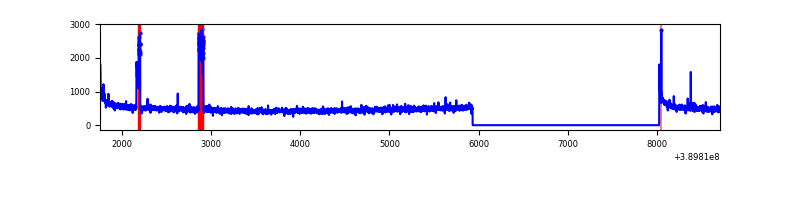 |
| B | 6952 | 4861 | 242 | 242 | 3.48% | 4.98% | 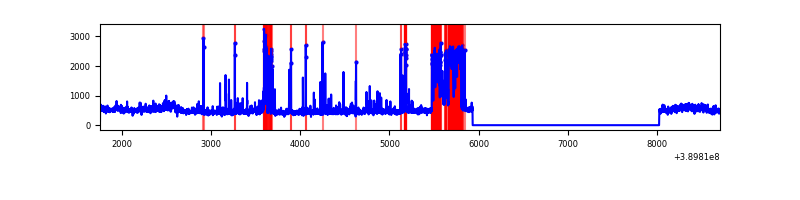 |
| C | 6952 | 4861 | 87 | 87 | 1.25% | 1.79% | 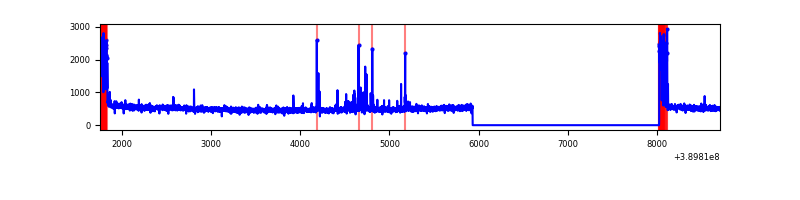 |
| D | 6952 | 4861 | 158 | 158 | 2.27% | 3.25% | 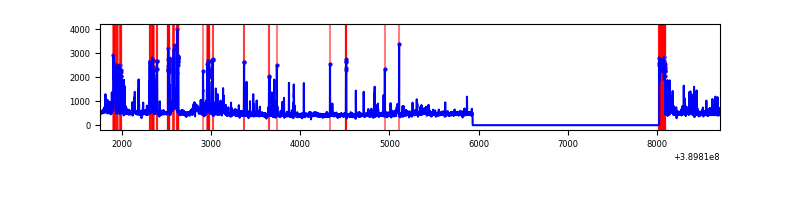 |
Top three noisy pixels from each quadrant. If the there are fewer than three noisy pixels in the level2.evt file, extra rows are filled as -1
| Pixel properties | Quadrant properties | ||||||
|---|---|---|---|---|---|---|---|
| Quadrant | DetID | PixID | Counts | Sigma | Mean | Median | Sigma |
| A | 8 | 192 | 179527 | 1616.09 | 558 | 548 | 110.7 |
| A | 10 | 83 | 147170 | 1323.92 | 558 | 548 | 110.7 |
| A | 13 | 6 | 19593 | 171.97 | 558 | 548 | 110.7 |
| B | 5 | 172 | 826332 | 7981.95 | 540 | 526 | 103.5 |
| B | 0 | 190 | 82309 | 790.49 | 540 | 526 | 103.5 |
| B | 4 | 232 | 37787 | 360.15 | 540 | 526 | 103.5 |
| C | 0 | 10 | 256185 | 1990.99 | 552 | 556 | 128.4 |
| C | 15 | 214 | 206074 | 1600.7 | 552 | 556 | 128.4 |
| C | 15 | 208 | 65826 | 508.36 | 552 | 556 | 128.4 |
| D | 13 | 249 | 363929 | 2760.2 | 546 | 531 | 131.7 |
| D | 1 | 52 | 156059 | 1181.32 | 546 | 531 | 131.7 |
| D | 8 | 195 | 65103 | 490.46 | 546 | 531 | 131.7 |
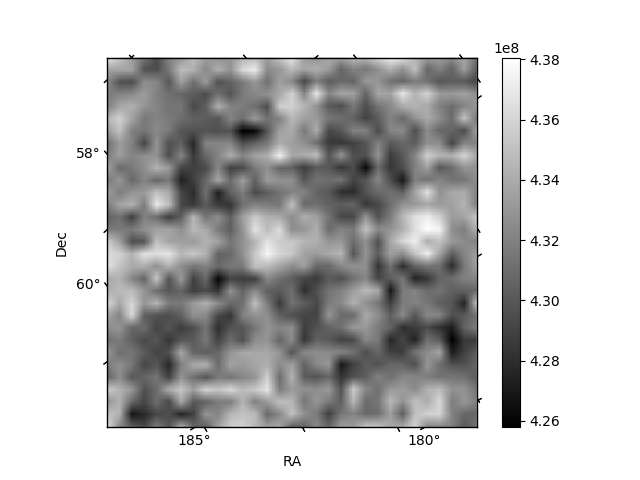
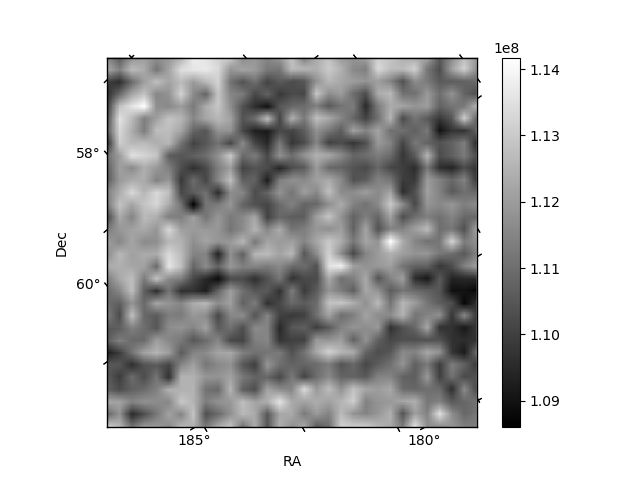
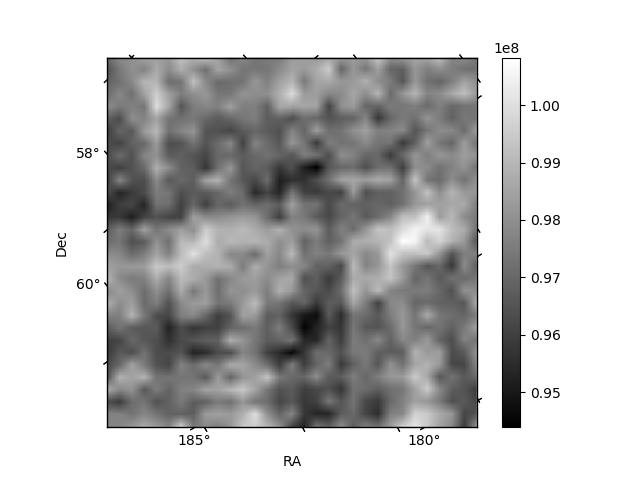
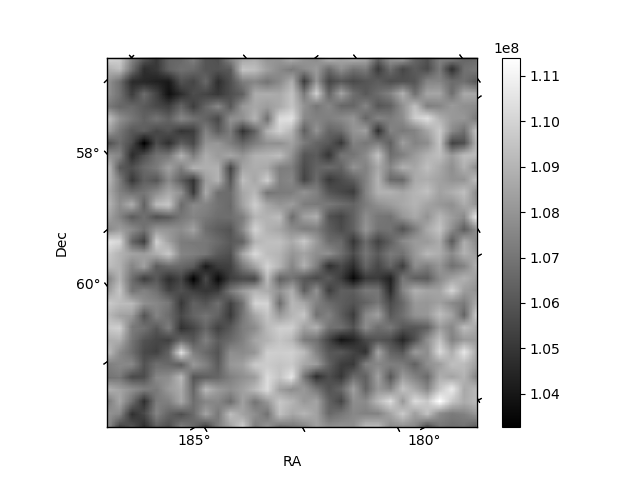
Histogram calculated using DETX and DETY for each event in the final _common_clean file
| Quadrant A | 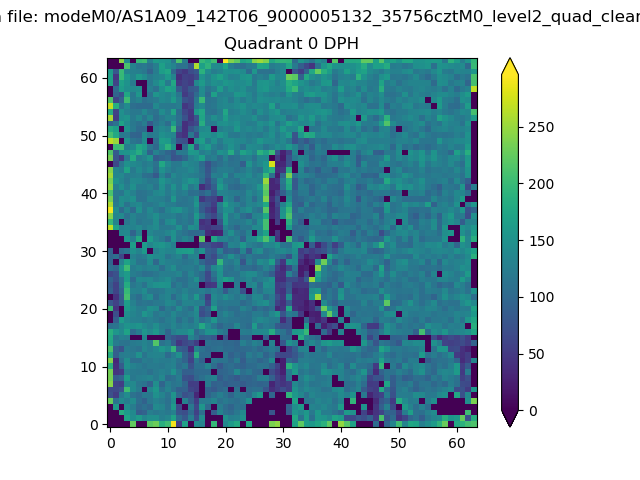 |
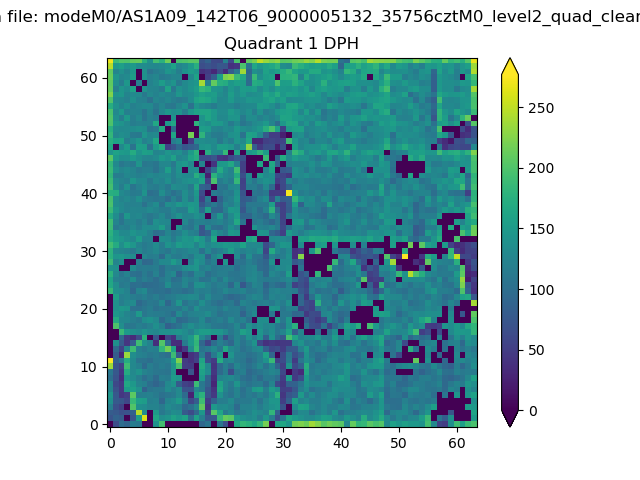 |
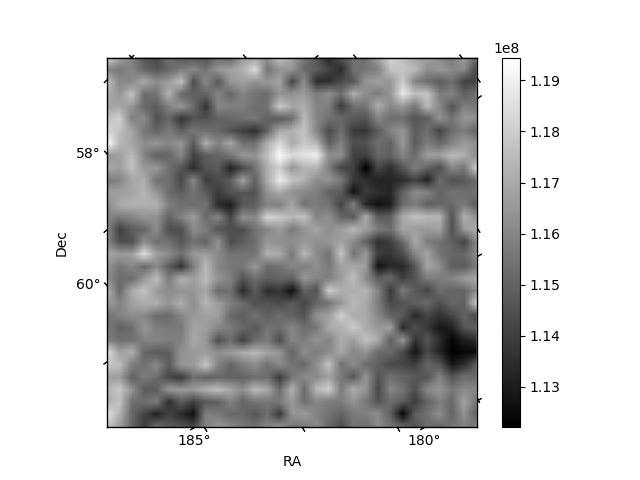
Quadrant B |
|---|---|---|---|
| Quadrant D | 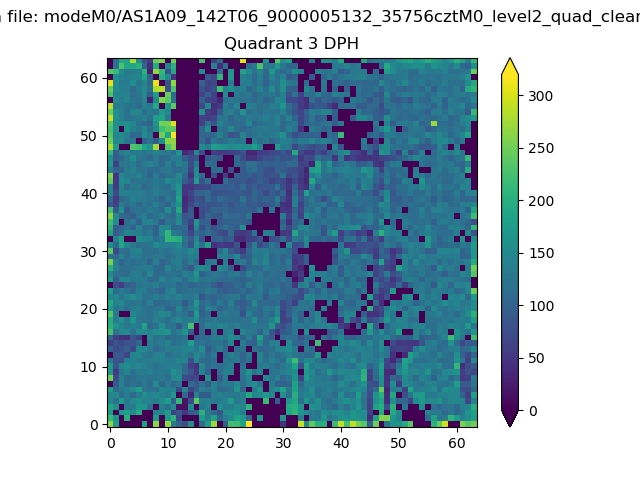 |
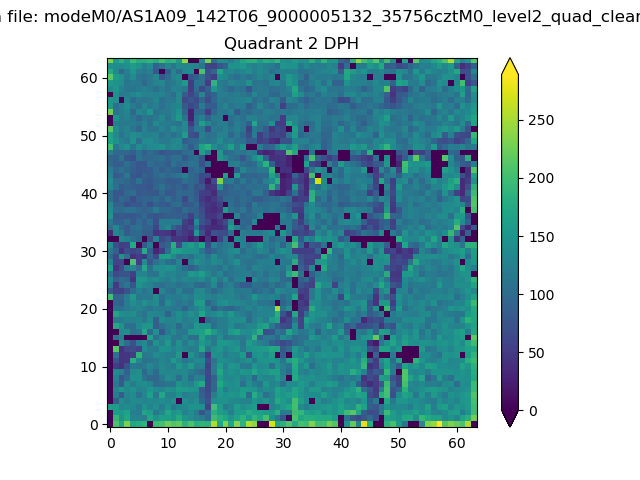 |
Quadrant C |
| Plot type | Count rate plots | Images |
|---|---|---|
| Comparison with Poisson distribution Blue bars denote a histogram of data divided into 1 sec bins. Red curve is a Poisson curve with rate = median count rate of data. |
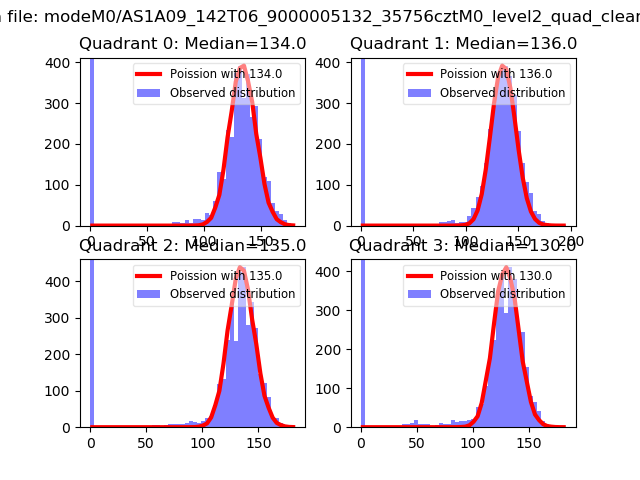 |
 |
| Quadrant-wise count rates Data is divided into 100 sec bins |
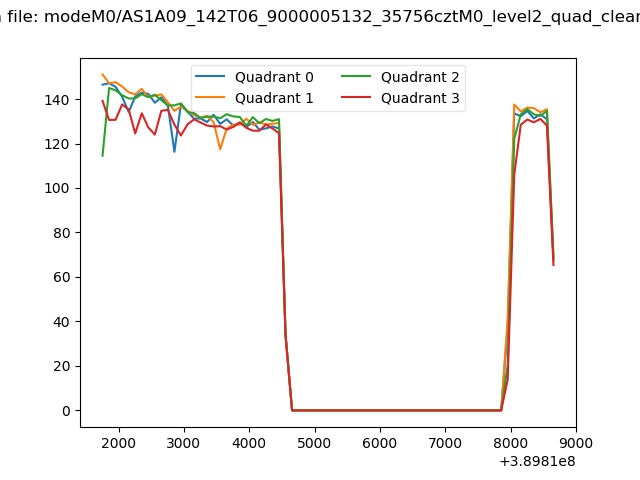 |
|
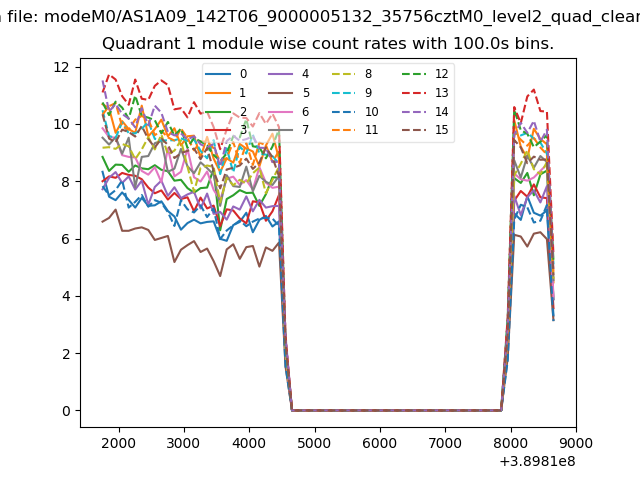
| Module-wise count rates for Quadrant A Data is divided into 100 sec bins |
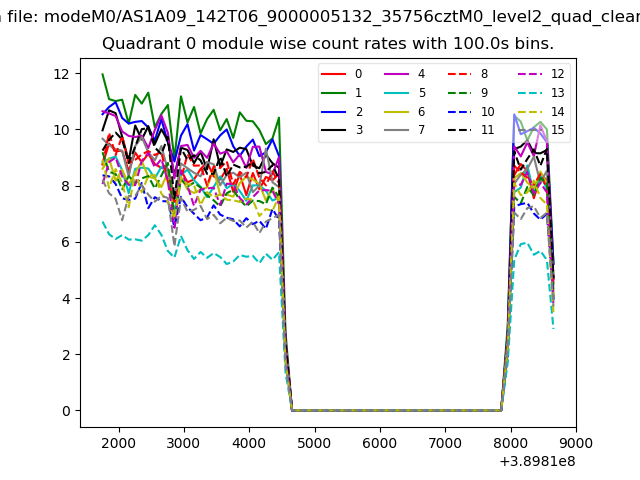 |
 |
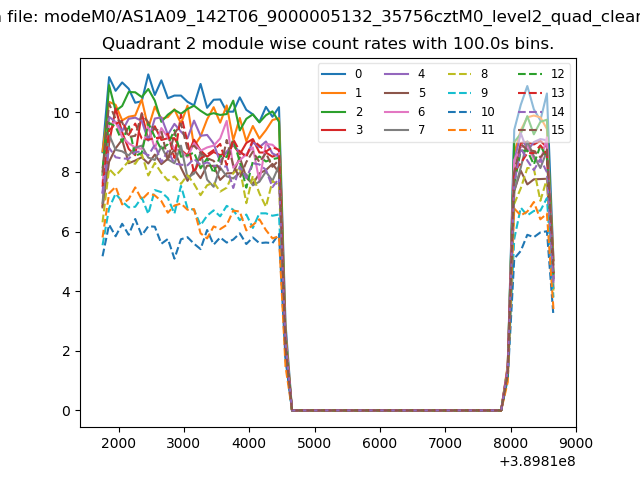
| Module-wise count rates for Quadrant B Data is divided into 100 sec bins |
 |
 |
| Module-wise count rates for Quadrant C Data is divided into 100 sec bins |
 |
 |
| Module-wise count rates for Quadrant D Data is divided into 100 sec bins |
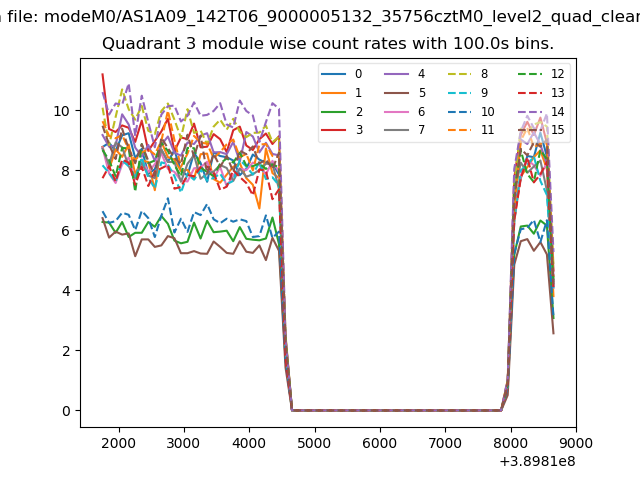 |
 |
| Parameter | Plot |
|---|---|
| CZT HV Monitor | 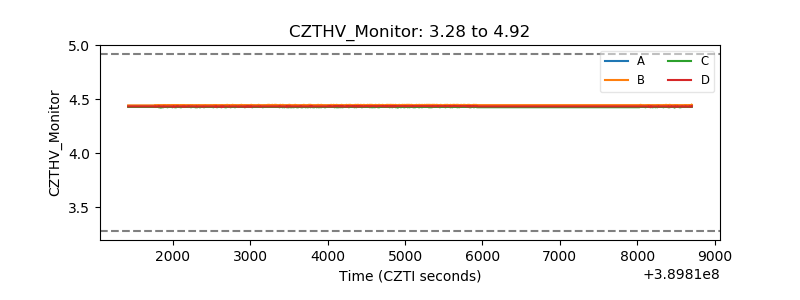 |
| D_VDD | 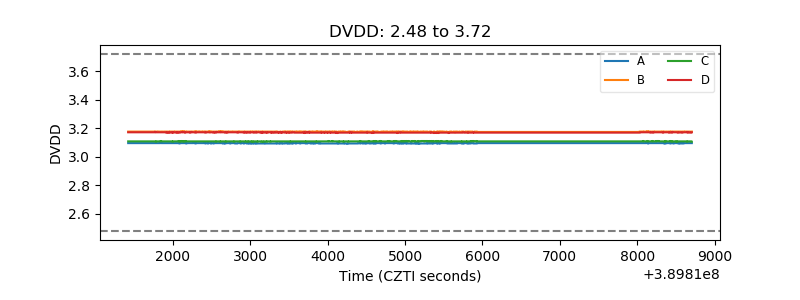 |
| Temperature 1 | 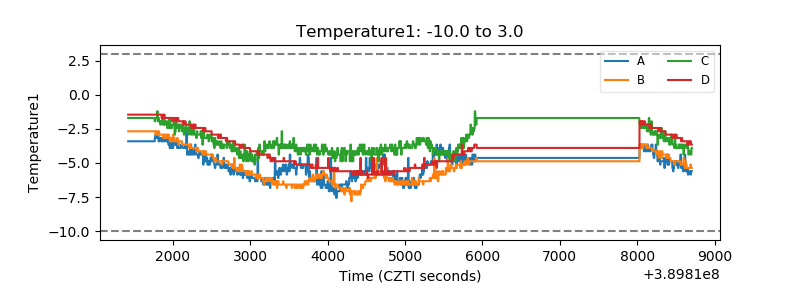 |
| Veto HV Monitor | 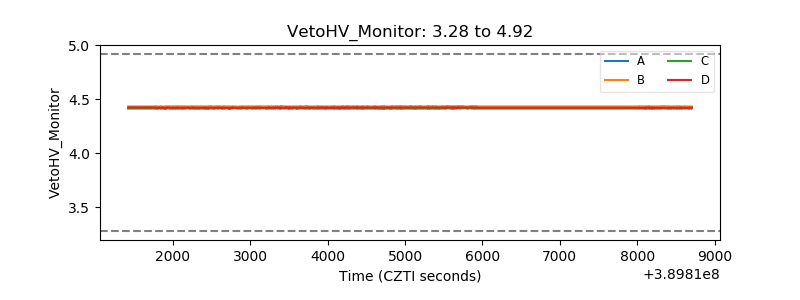 |
| Veto LLD | 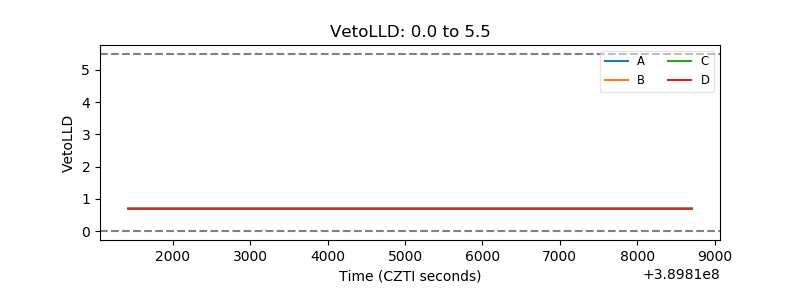 |
| Alpha Counter | 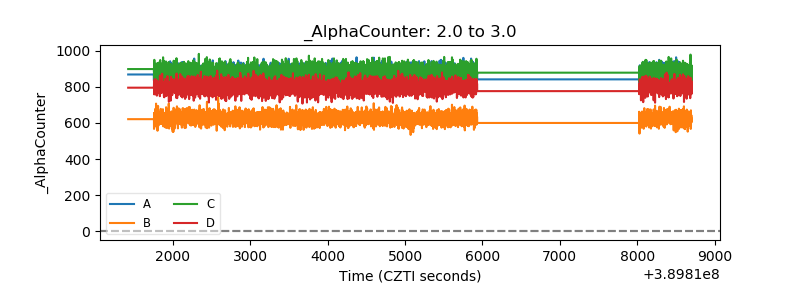 |
| _CPM_Rate | 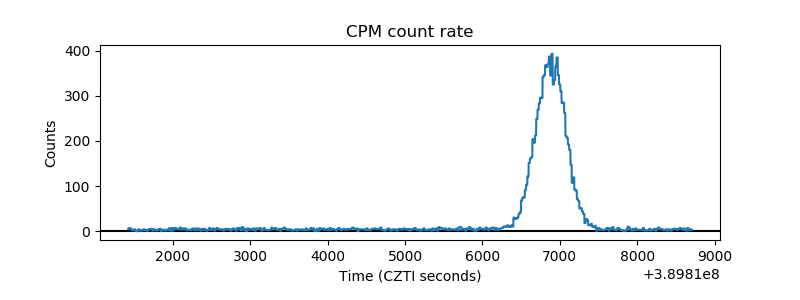 |
| CZT Counter | 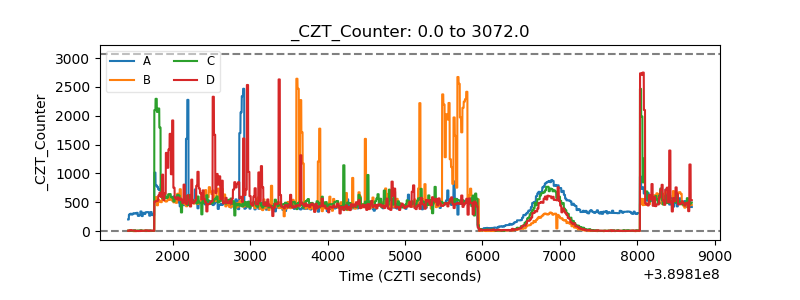 |
| +2.5 Volts monitor | 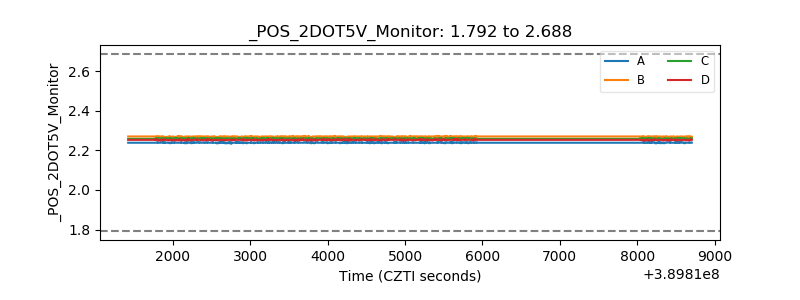 |
| +5 Volts monitor | 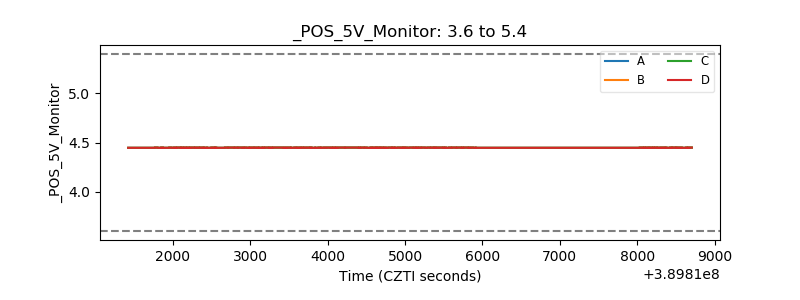 |
| _ROLL_ROT | 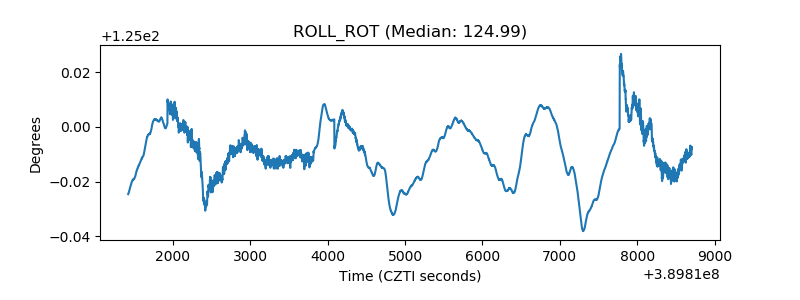 |
| _Roll_DEC | 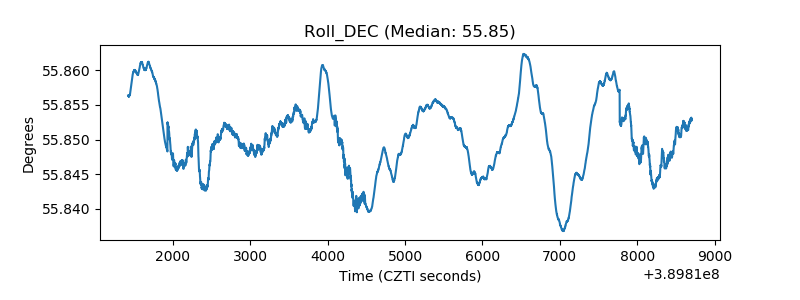 |
| _Roll_RA | 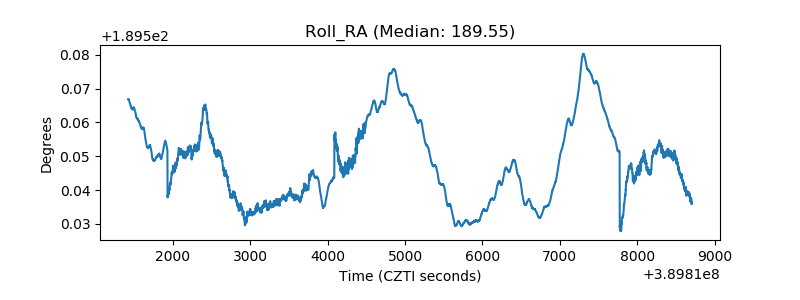 |
| Veto Counter | 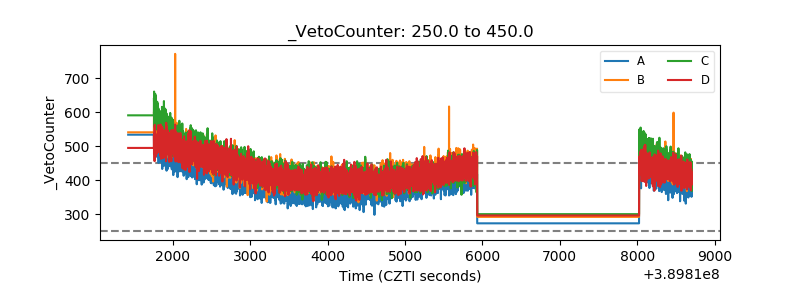 |