| Param | Original file | Final file |
|---|---|---|
| Filename | modeM0/AS1A09_029T07_9000005128_35745cztM0_level2.evt | modeM0/AS1A09_029T07_9000005128_35745cztM0_level2_quad_clean.evt |
| Size (bytes) | 434,652,480 | 63,351,360 |
| Size | 414.5 MB | 60.4 MB |
| Events in quadrant A | 3,106,606 | 375,487 |
| Events in quadrant B | 3,630,017 | 387,079 |
| Events in quadrant C | 2,955,090 | 380,247 |
| Events in quadrant D | 3,069,379 | 361,520 |
| Mode M9 | |||
|---|---|---|---|
| Quadrant | BADHDUFLAG | Total packets | Discarded packets |
| A | 0 | 27 | 0 |
| B | 0 | 27 | 0 |
| C | 0 | 27 | 0 |
| D | 0 | 27 | 0 |
| Mode M0 | |||
|---|---|---|---|
| Quadrant | BADHDUFLAG | Total packets | Discarded packets |
| A | 0 | 13068 | 3 |
| B | 0 | 14603 | 2 |
| C | 0 | 12332 | 2 |
| D | 0 | 13269 | 2 |
| Mode SS | |||
|---|---|---|---|
| Quadrant | BADHDUFLAG | Total packets | Discarded packets |
| A | 0 | 122 | 0 |
| B | 0 | 122 | 0 |
| C | 0 | 122 | 0 |
| D | 0 | 122 | 0 |
| Quadrant | Total seconds | Saturated seconds | Saturation percentage |
|---|---|---|---|
| A | 5923 | 119 | 2.009117% |
| B | 5923 | 227 | 3.832517% |
| C | 5923 | 18 | 0.303900% |
| D | 5923 | 81 | 1.367550% |
Noise dominated data is calculated using 1-second bins in cleaned event files. If a bin has >2000 counts, and if more than 50% of those come from <1% of pixels, then it is considered to be noise-dominated and hence unusable.
| Quadrant | # 1 sec bins | Bins with >0 counts | Bins with >2000 counts | High rate bins dominated by noise | Noise dominated (total time) | Noise dominated (detector-on time) | Marked lightcurve |
|---|---|---|---|---|---|---|---|
| A | 8606 | 5925 | 98 | 98 | 1.14% | 1.65% | 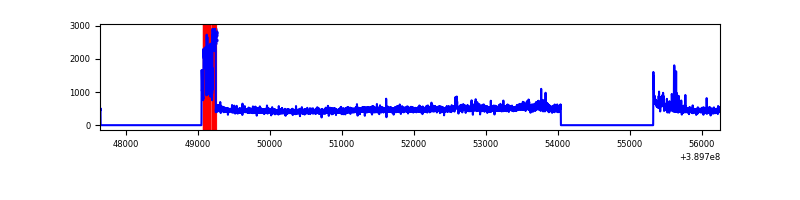 |
| B | 8606 | 5925 | 180 | 180 | 2.09% | 3.04% | 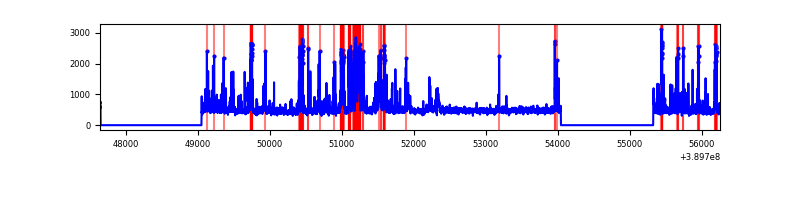 |
| C | 8606 | 5925 | 14 | 14 | 0.16% | 0.24% | 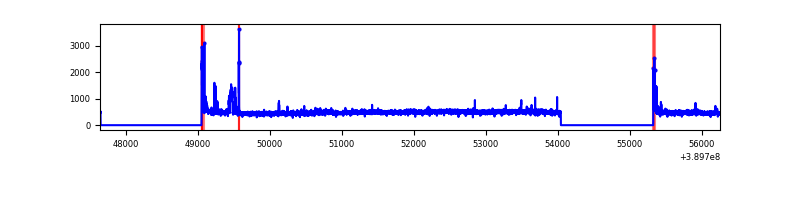 |
| D | 8606 | 5925 | 73 | 73 | 0.85% | 1.23% | 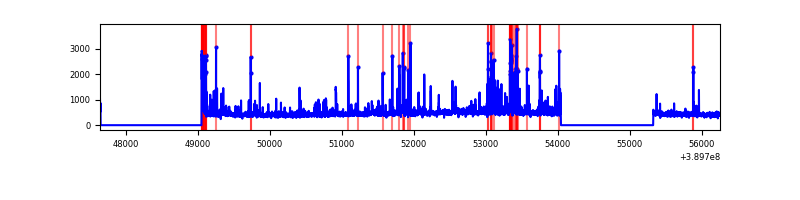 |
Top three noisy pixels from each quadrant. If the there are fewer than three noisy pixels in the level2.evt file, extra rows are filled as -1
| Pixel properties | Quadrant properties | ||||||
|---|---|---|---|---|---|---|---|
| Quadrant | DetID | PixID | Counts | Sigma | Mean | Median | Sigma |
| A | 15 | 169 | 322575 | 2401.0 | 662 | 649 | 134.1 |
| A | 10 | 83 | 153882 | 1142.85 | 662 | 649 | 134.1 |
| A | 7 | 48 | 41247 | 302.79 | 662 | 649 | 134.1 |
| B | 5 | 172 | 882773 | 6918.19 | 657 | 640 | 127.5 |
| B | 5 | 255 | 64652 | 502.02 | 657 | 640 | 127.5 |
| B | 0 | 189 | 52021 | 402.96 | 657 | 640 | 127.5 |
| C | 15 | 214 | 251876 | 1680.51 | 644 | 648 | 149.5 |
| C | 0 | 10 | 88430 | 587.19 | 644 | 648 | 149.5 |
| C | 15 | 208 | 65725 | 435.31 | 644 | 648 | 149.5 |
| D | 13 | 249 | 338109 | 2143.23 | 642 | 623 | 157.5 |
| D | 8 | 195 | 43297 | 271.0 | 642 | 623 | 157.5 |
| D | 1 | 52 | 36546 | 228.13 | 642 | 623 | 157.5 |
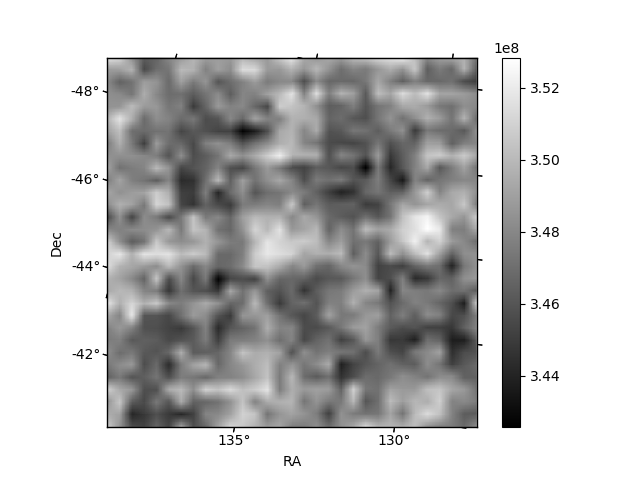
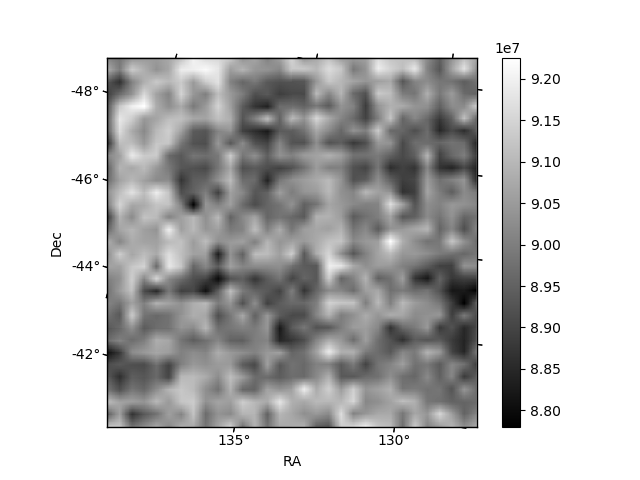
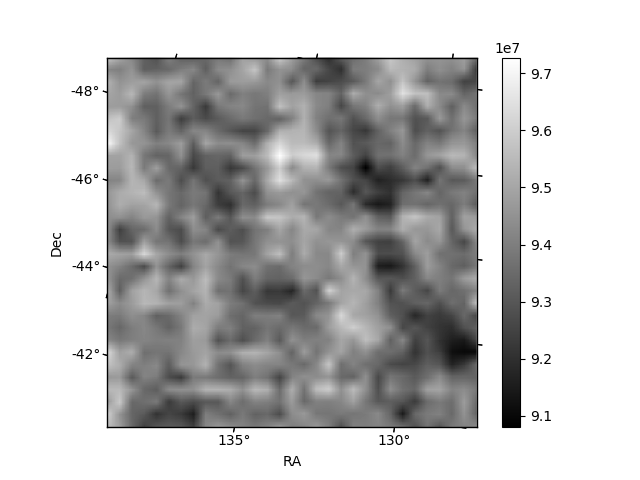
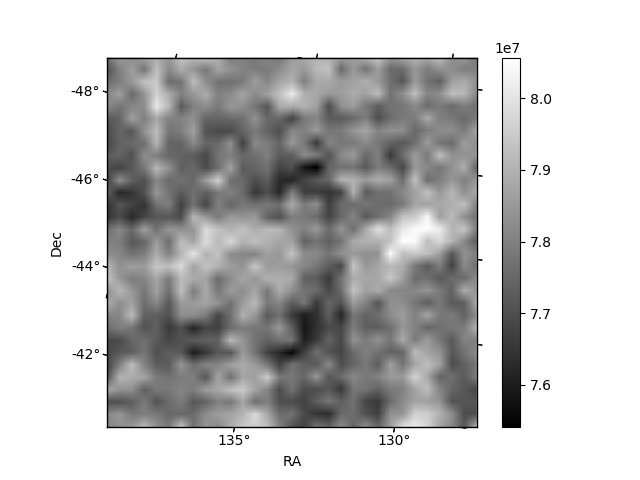
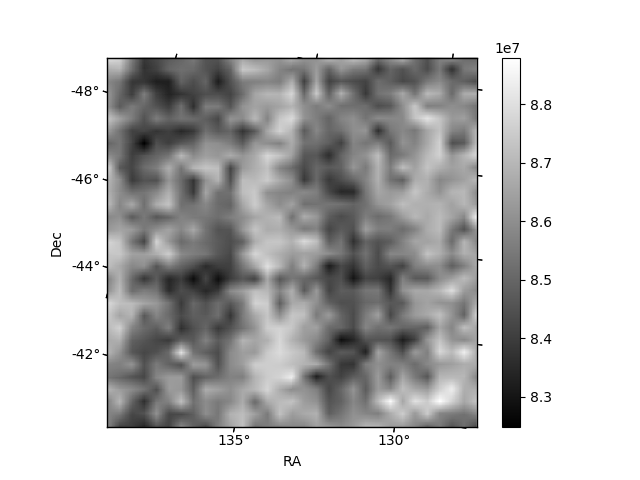
Histogram calculated using DETX and DETY for each event in the final _common_clean file
| Quadrant A | 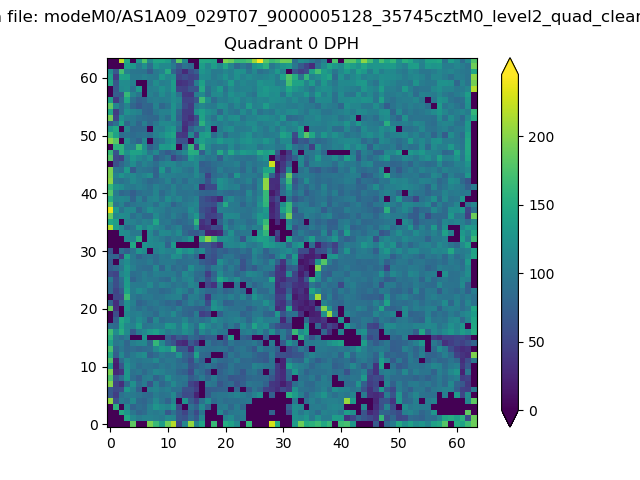 |
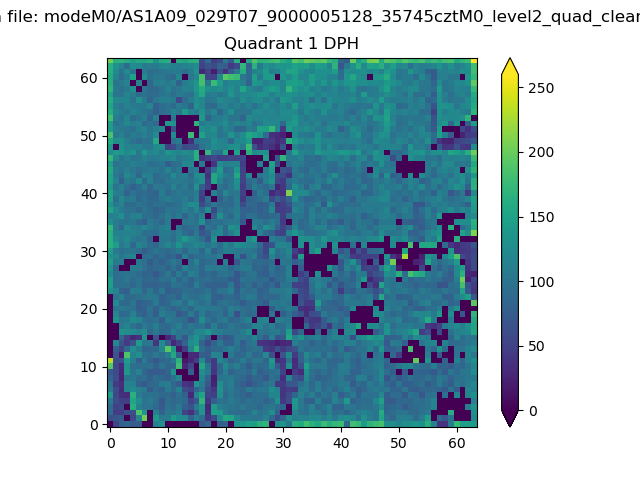 |
Quadrant B |
|---|---|---|---|
| Quadrant D | 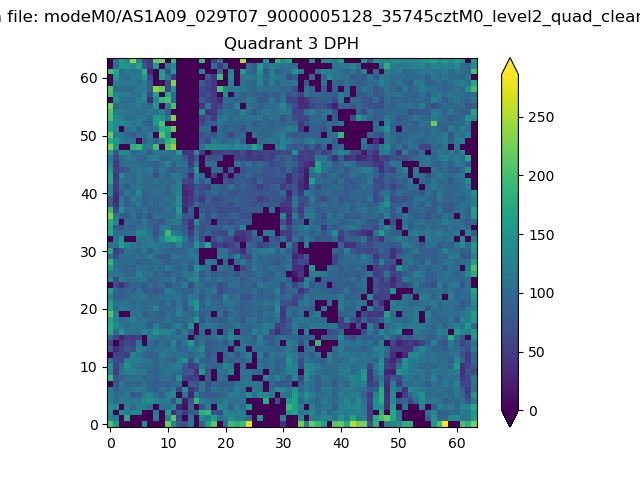 |
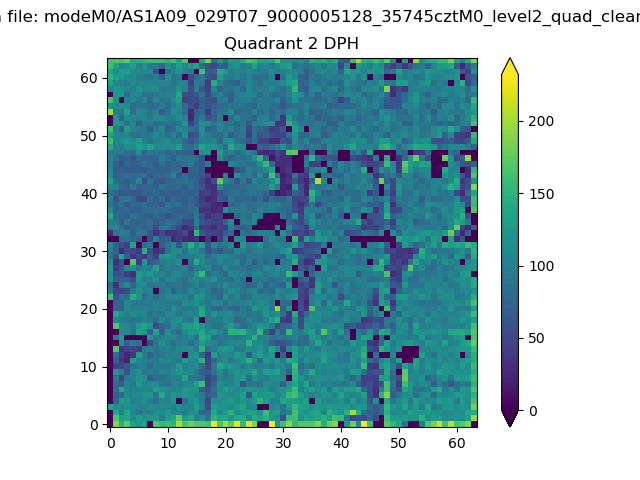 |
Quadrant C |
| Plot type | Count rate plots | Images |
|---|---|---|
| Comparison with Poisson distribution Blue bars denote a histogram of data divided into 1 sec bins. Red curve is a Poisson curve with rate = median count rate of data. |
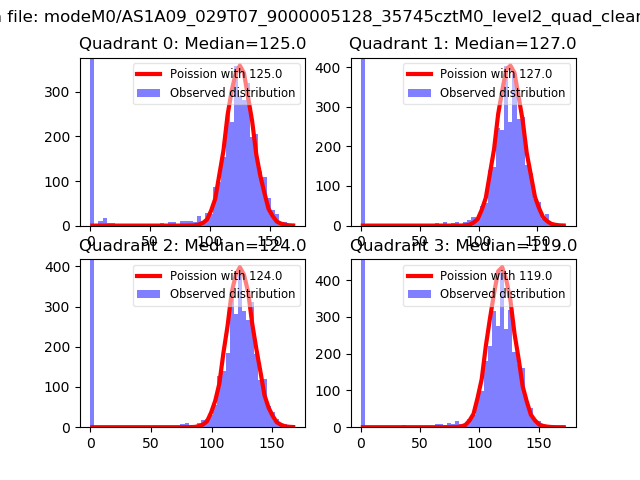 |
 |
| Quadrant-wise count rates Data is divided into 100 sec bins |
 |
|
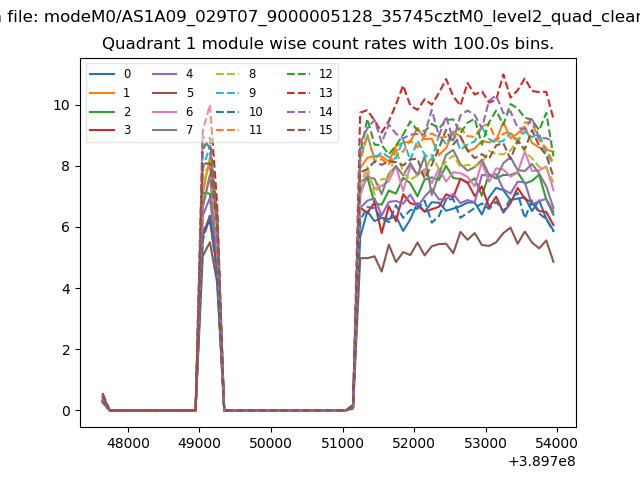
| Module-wise count rates for Quadrant A Data is divided into 100 sec bins |
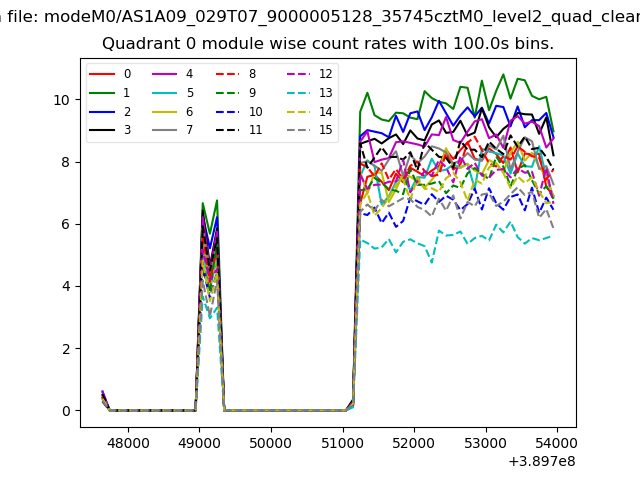 |
 |
| Module-wise count rates for Quadrant B Data is divided into 100 sec bins |
 |
 |
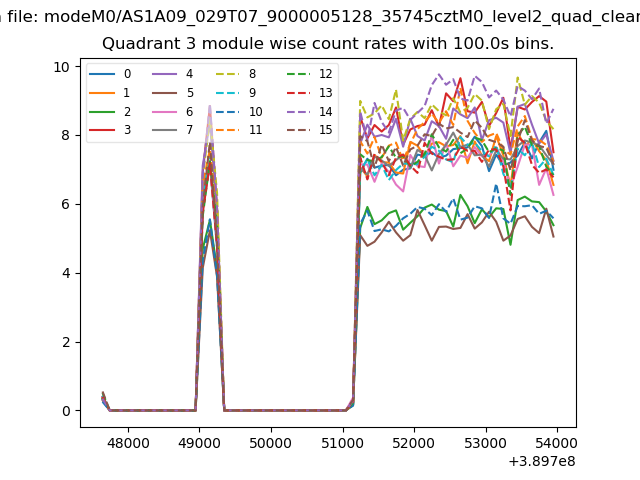
| Module-wise count rates for Quadrant C Data is divided into 100 sec bins |
 |
 |
| Module-wise count rates for Quadrant D Data is divided into 100 sec bins |
 |
 |
| Parameter | Plot |
|---|---|
| CZT HV Monitor | 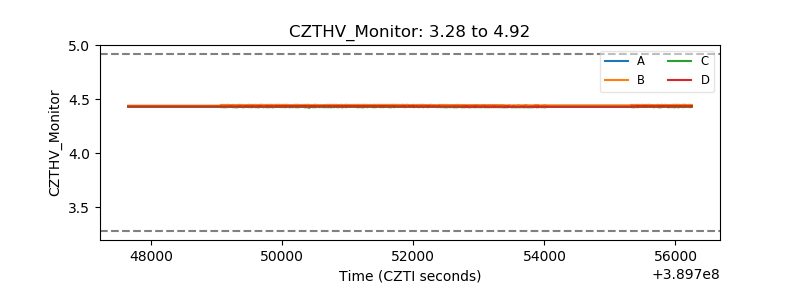 |
| D_VDD | 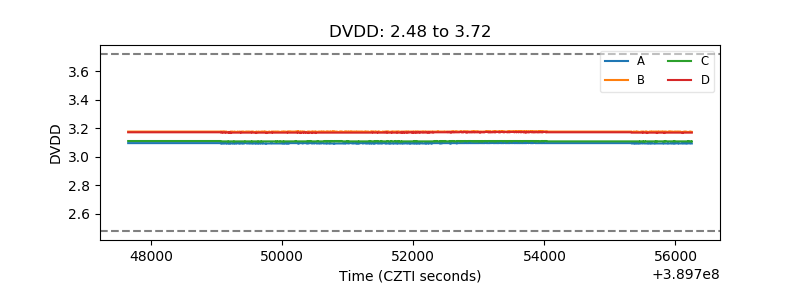 |
| Temperature 1 | 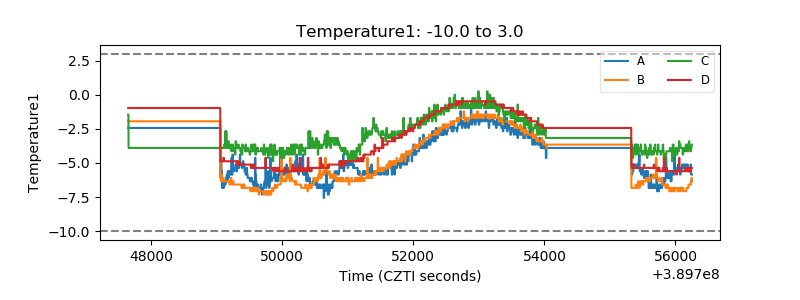 |
| Veto HV Monitor | 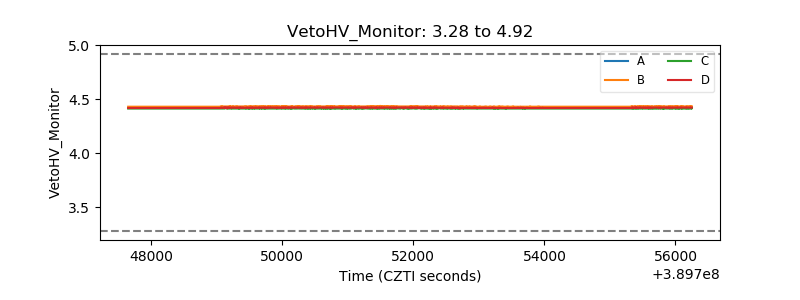 |
| Veto LLD | 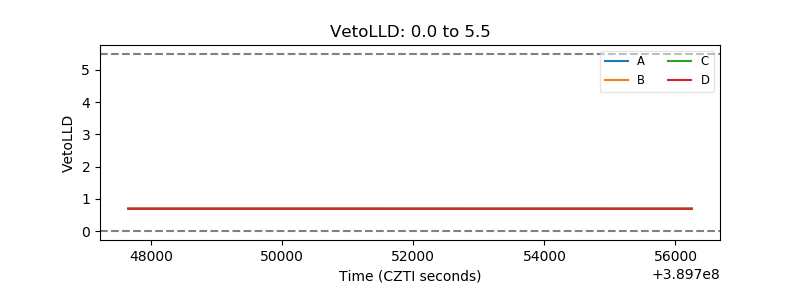 |
| Alpha Counter | 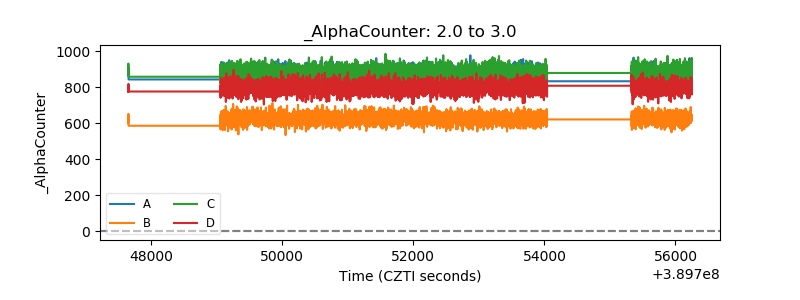 |
| _CPM_Rate | 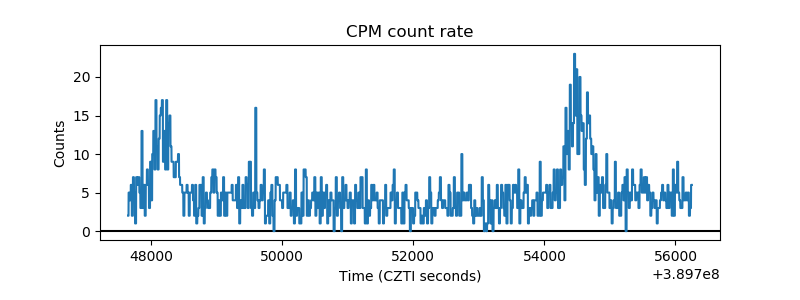 |
| CZT Counter | 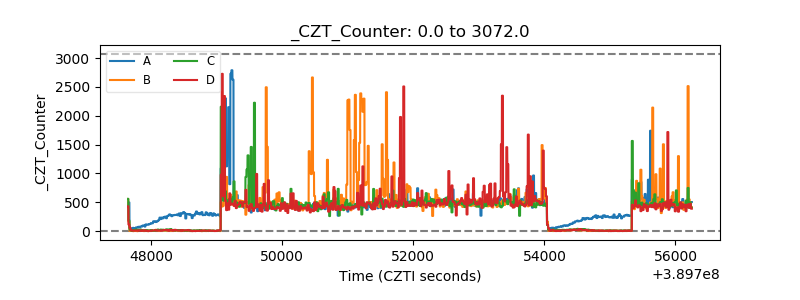 |
| +2.5 Volts monitor | 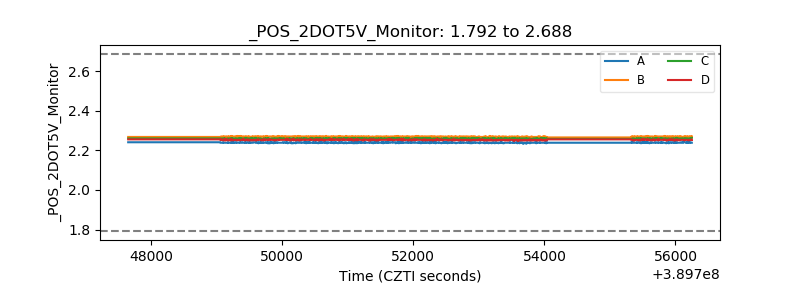 |
| +5 Volts monitor | 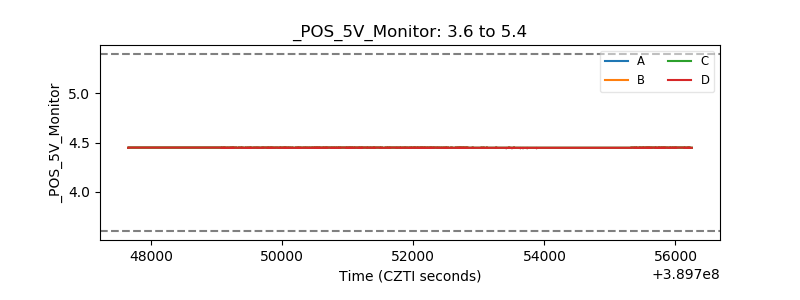 |
| _ROLL_ROT | 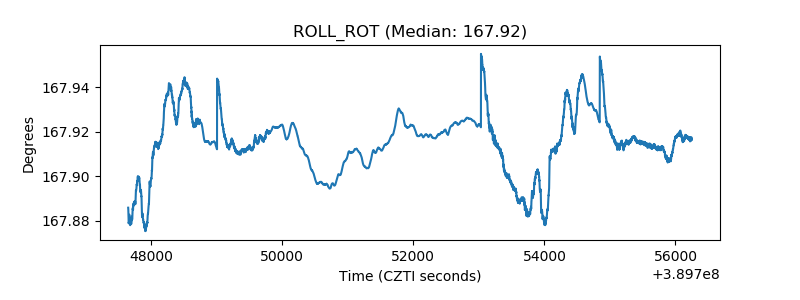 |
| _Roll_DEC | 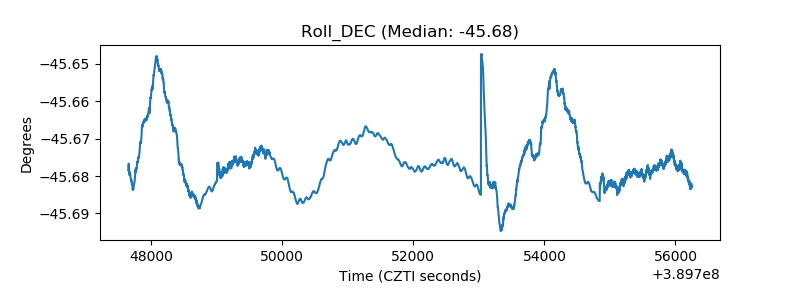 |
| _Roll_RA | 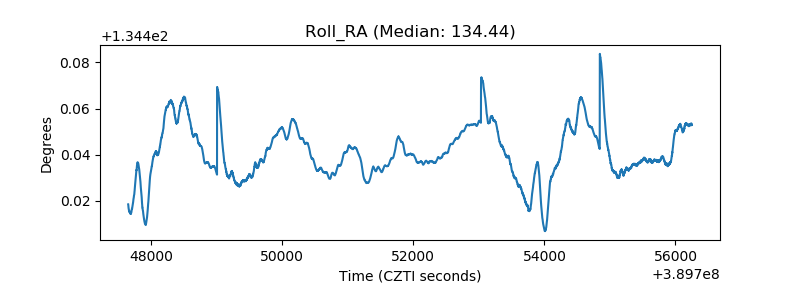 |
| Veto Counter | 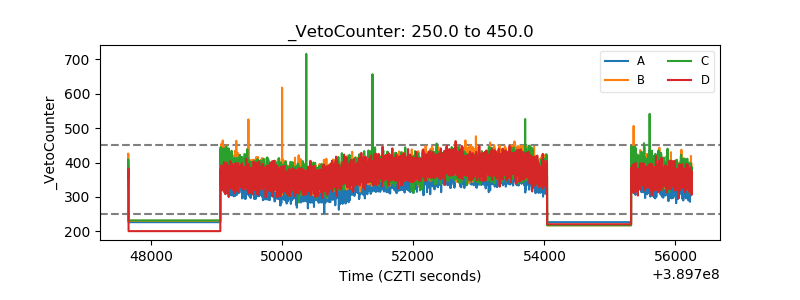 |