| Param | Original file | Final file |
|---|---|---|
| Filename | modeM0/AS1A09_143T04_9000005120_35720cztM0_level2.evt | modeM0/AS1A09_143T04_9000005120_35720cztM0_level2_quad_clean.evt |
| Size (bytes) | 453,003,840 | 85,072,320 |
| Size | 432.0 MB | 81.1 MB |
| Events in quadrant A | 2,807,347 | 556,317 |
| Events in quadrant B | 3,357,999 | 555,824 |
| Events in quadrant C | 3,887,731 | 538,129 |
| Events in quadrant D | 3,274,037 | 522,406 |
| Mode M0 | |||
|---|---|---|---|
| Quadrant | BADHDUFLAG | Total packets | Discarded packets |
| A | 0 | 12038 | 3 |
| B | 0 | 13718 | 2 |
| C | 0 | 15062 | 2 |
| D | 0 | 13623 | 2 |
| Mode SS | |||
|---|---|---|---|
| Quadrant | BADHDUFLAG | Total packets | Discarded packets |
| A | 0 | 118 | 0 |
| B | 0 | 118 | 0 |
| C | 0 | 118 | 0 |
| D | 0 | 118 | 0 |
| Mode M9 | |||
|---|---|---|---|
| Quadrant | BADHDUFLAG | Total packets | Discarded packets |
| A | 0 | 25 | 0 |
| B | 0 | 25 | 0 |
| C | 0 | 25 | 0 |
| D | 0 | 26 | 0 |
| Quadrant | Total seconds | Saturated seconds | Saturation percentage |
|---|---|---|---|
| A | 5771 | 8 | 0.138624% |
| B | 5771 | 153 | 2.651187% |
| C | 5771 | 198 | 3.430948% |
| D | 5771 | 73 | 1.264945% |
Noise dominated data is calculated using 1-second bins in cleaned event files. If a bin has >2000 counts, and if more than 50% of those come from <1% of pixels, then it is considered to be noise-dominated and hence unusable.
| Quadrant | # 1 sec bins | Bins with >0 counts | Bins with >2000 counts | High rate bins dominated by noise | Noise dominated (total time) | Noise dominated (detector-on time) | Marked lightcurve |
|---|---|---|---|---|---|---|---|
| A | 7384 | 5772 | 0 | 0 | 0.00% | 0.00% | 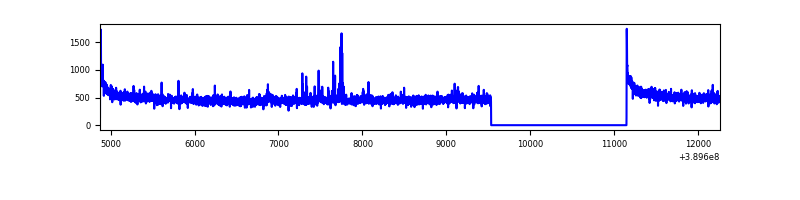 |
| B | 7384 | 5772 | 101 | 101 | 1.37% | 1.75% | 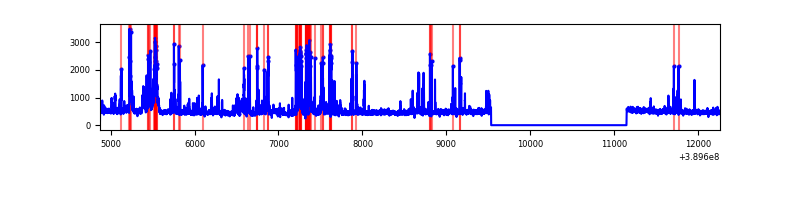 |
| C | 7384 | 5772 | 205 | 205 | 2.78% | 3.55% | 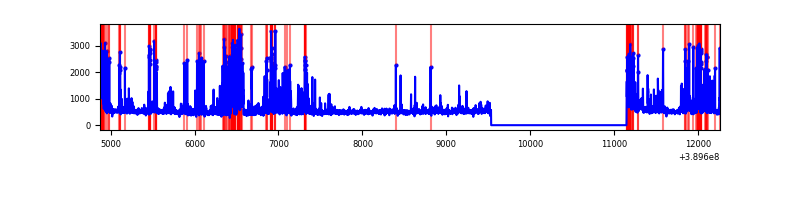 |
| D | 7384 | 5772 | 66 | 66 | 0.89% | 1.14% | 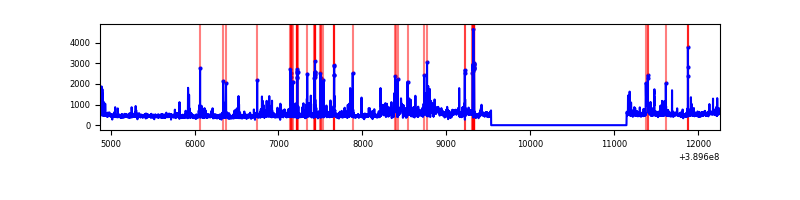 |
Top three noisy pixels from each quadrant. If the there are fewer than three noisy pixels in the level2.evt file, extra rows are filled as -1
| Pixel properties | Quadrant properties | ||||||
|---|---|---|---|---|---|---|---|
| Quadrant | DetID | PixID | Counts | Sigma | Mean | Median | Sigma |
| A | 10 | 83 | 157237 | 1164.14 | 668 | 655 | 134.5 |
| A | 7 | 3 | 38395 | 280.59 | 668 | 655 | 134.5 |
| A | 13 | 6 | 13412 | 94.84 | 668 | 655 | 134.5 |
| B | 5 | 172 | 325475 | 2578.0 | 656 | 637 | 126.0 |
| B | 5 | 255 | 274886 | 2176.51 | 656 | 637 | 126.0 |
| B | 0 | 218 | 66232 | 520.58 | 656 | 637 | 126.0 |
| C | 0 | 207 | 748902 | 5141.58 | 636 | 642 | 145.5 |
| C | 0 | 10 | 339489 | 2328.35 | 636 | 642 | 145.5 |
| C | 15 | 214 | 244857 | 1678.09 | 636 | 642 | 145.5 |
| D | 10 | 203 | 252291 | 1605.92 | 643 | 625 | 156.7 |
| D | 13 | 249 | 180242 | 1146.16 | 643 | 625 | 156.7 |
| D | 2 | 153 | 98944 | 627.39 | 643 | 625 | 156.7 |
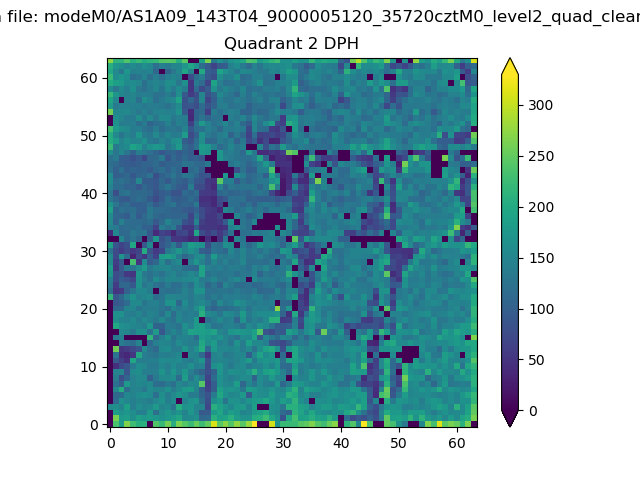
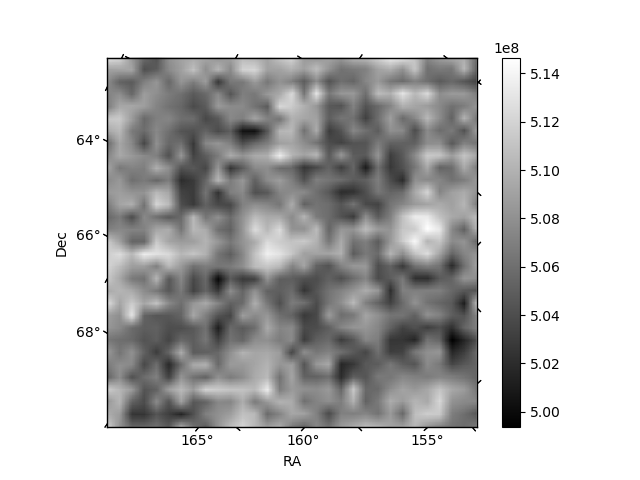
Histogram calculated using DETX and DETY for each event in the final _common_clean file
| Quadrant A | 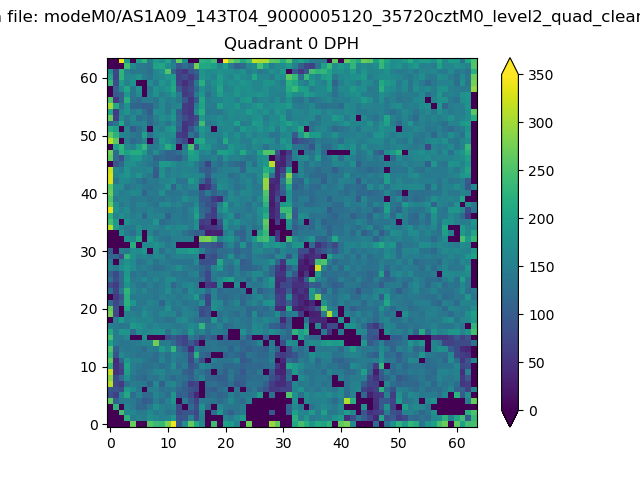 |
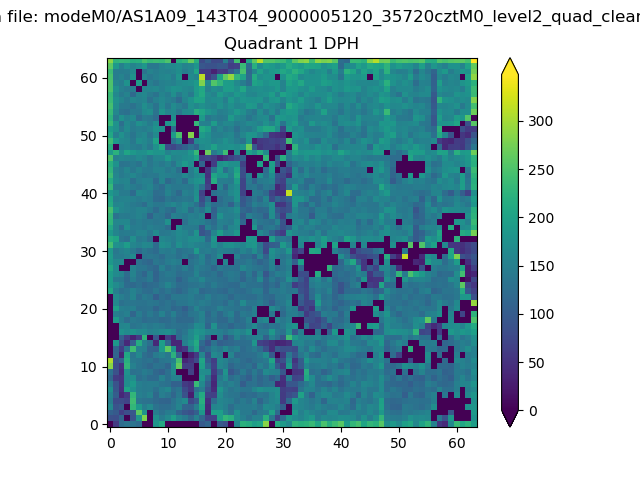 |
Quadrant B |
|---|---|---|---|
| Quadrant D | 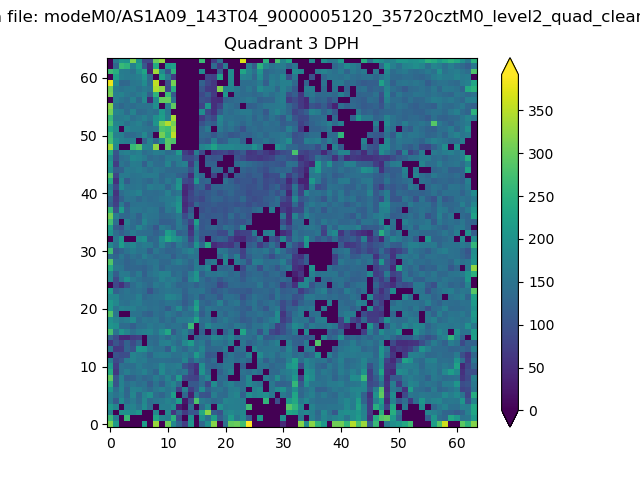 |
 |
Quadrant C |
| Plot type | Count rate plots | Images |
|---|---|---|
| Comparison with Poisson distribution Blue bars denote a histogram of data divided into 1 sec bins. Red curve is a Poisson curve with rate = median count rate of data. |
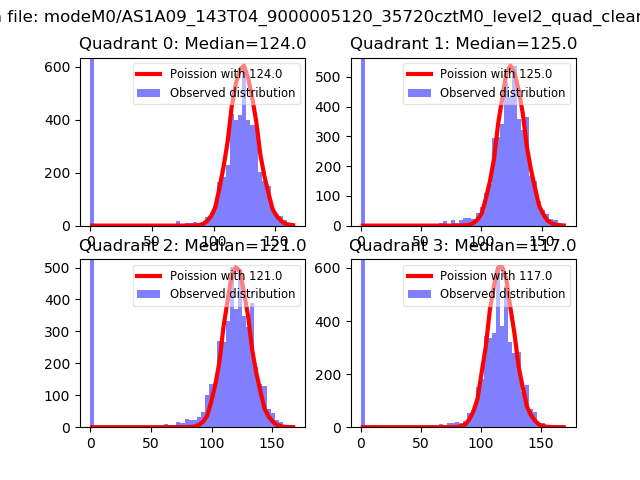 |
 |
| Quadrant-wise count rates Data is divided into 100 sec bins |
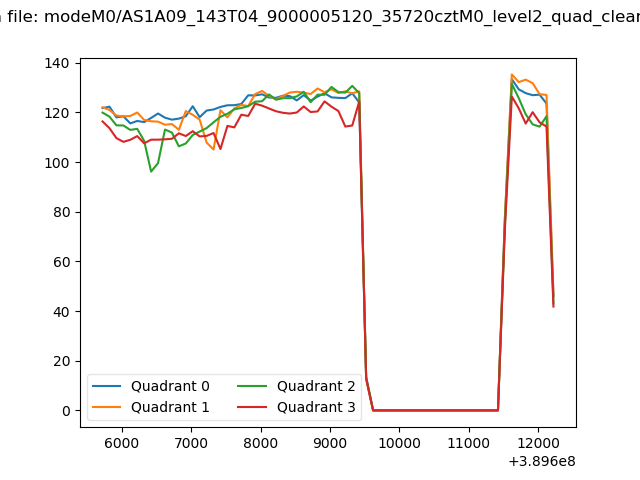 |
|
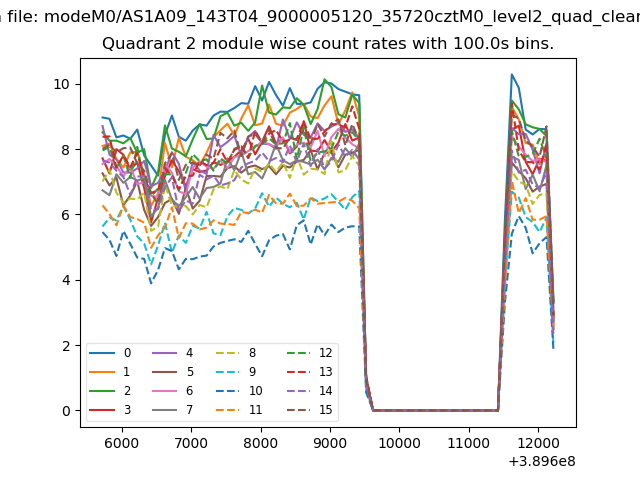
| Module-wise count rates for Quadrant A Data is divided into 100 sec bins |
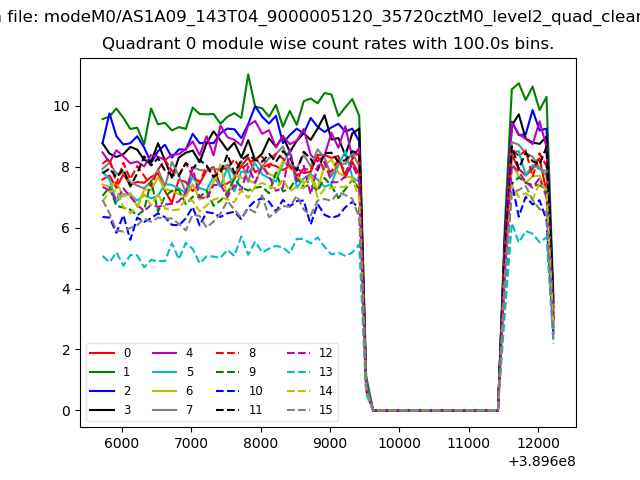 |
 |
| Module-wise count rates for Quadrant B Data is divided into 100 sec bins |
 |
 |
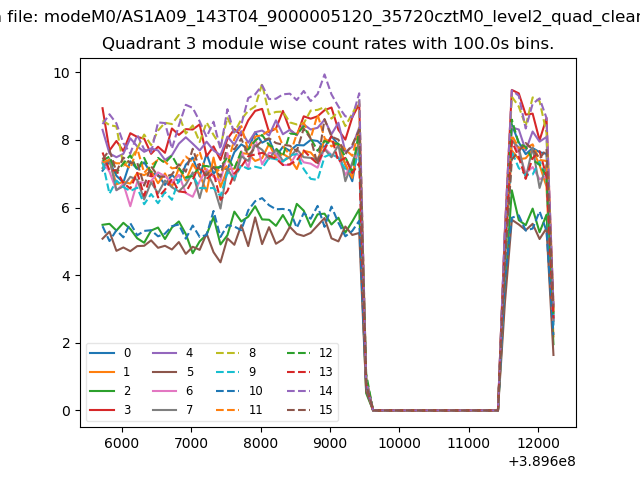
| Module-wise count rates for Quadrant C Data is divided into 100 sec bins |
 |
 |
| Module-wise count rates for Quadrant D Data is divided into 100 sec bins |
 |
 |
| Parameter | Plot |
|---|---|
| CZT HV Monitor | 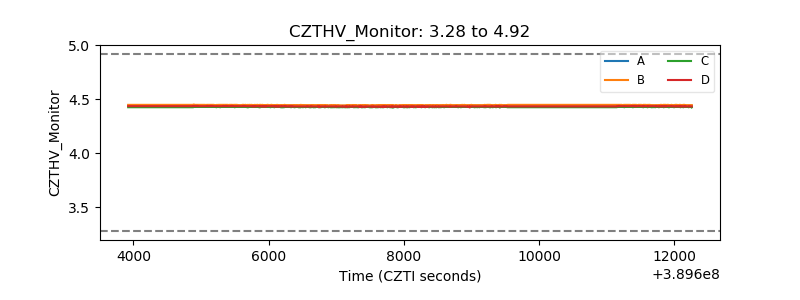 |
| D_VDD | 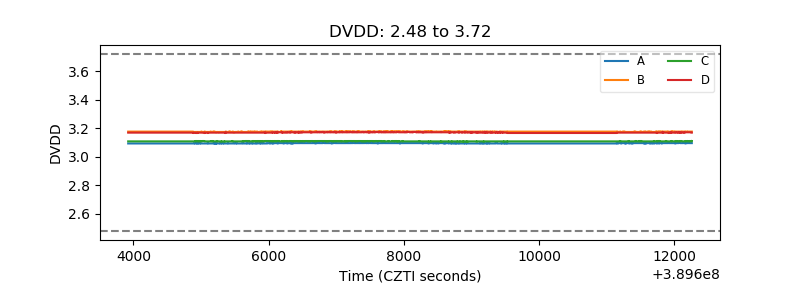 |
| Temperature 1 | 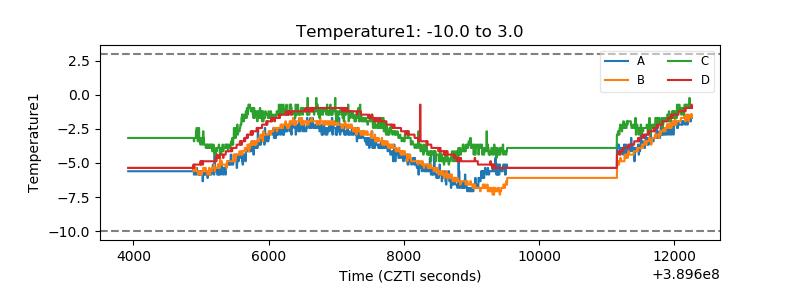 |
| Veto HV Monitor | 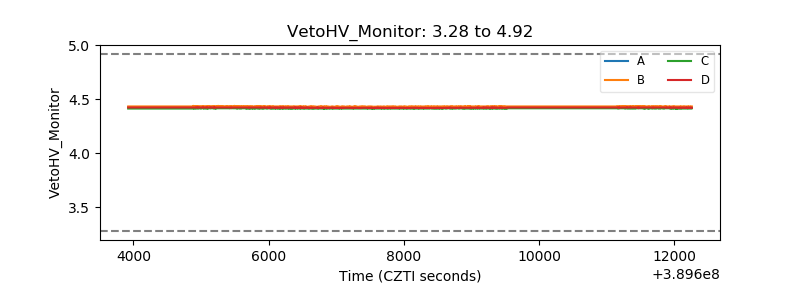 |
| Veto LLD | 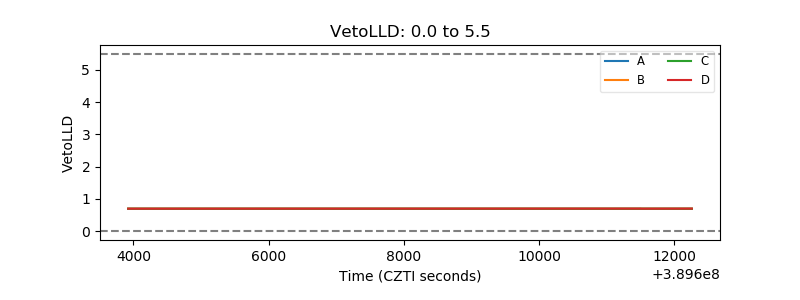 |
| Alpha Counter | 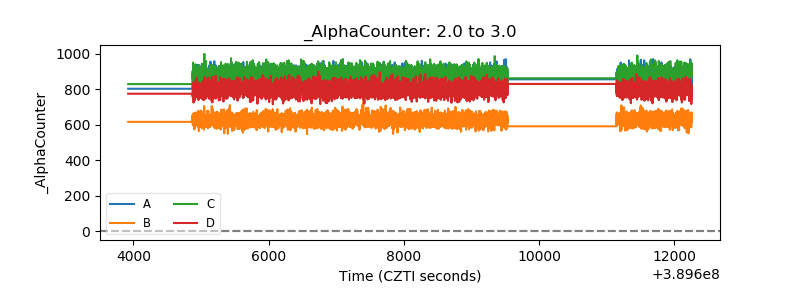 |
| _CPM_Rate | 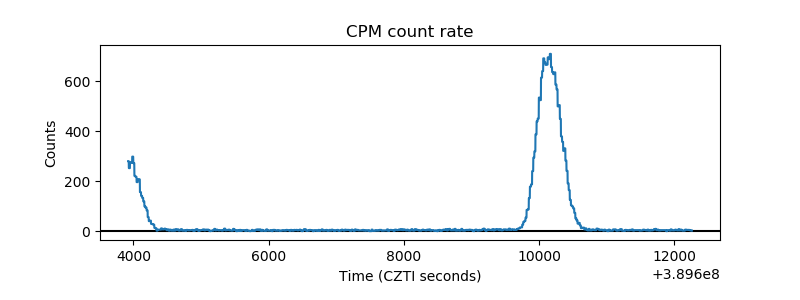 |
| CZT Counter | 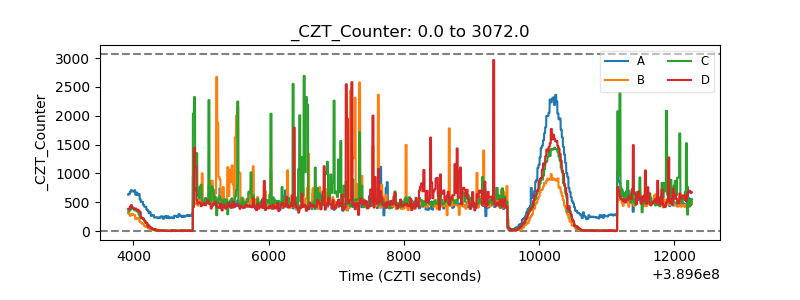 |
| +2.5 Volts monitor | 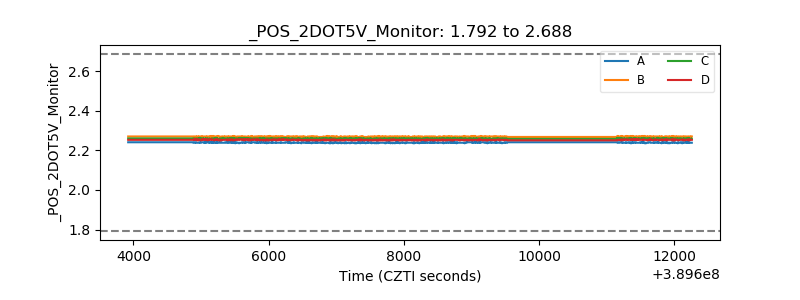 |
| +5 Volts monitor | 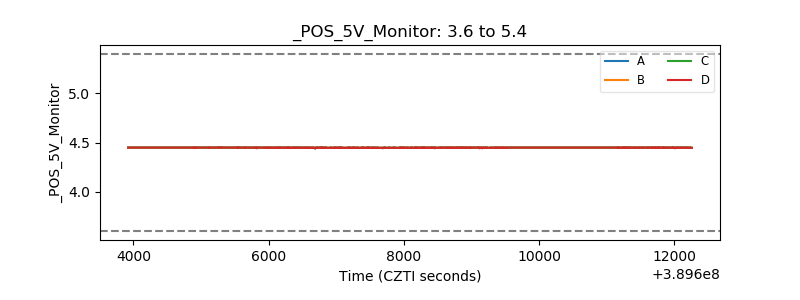 |
| _ROLL_ROT | 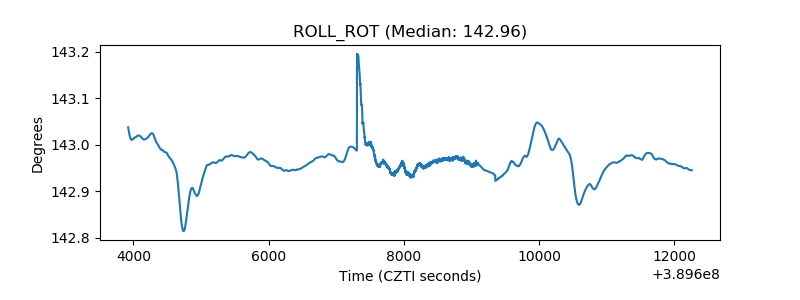 |
| _Roll_DEC | 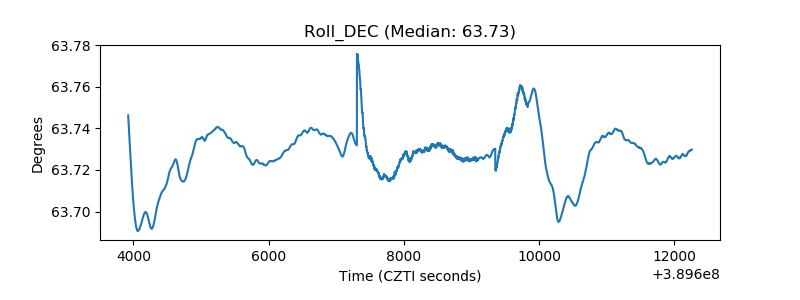 |
| _Roll_RA | 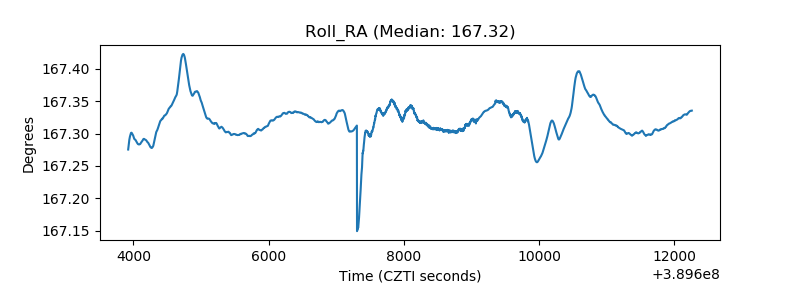 |
| Veto Counter | 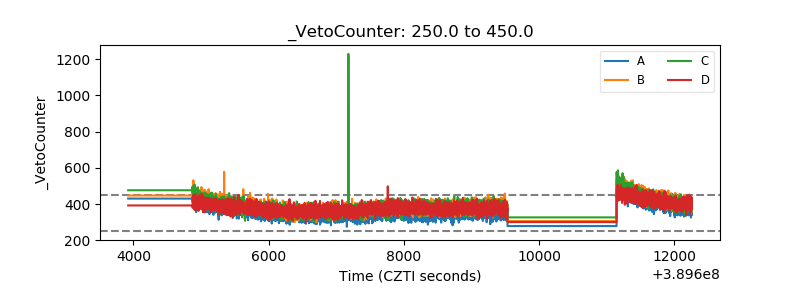 |