| Param | Original file | Final file |
|---|---|---|
| Filename | modeM0/AS1A09_029T05_9000005124_35733cztM0_level2.evt | modeM0/AS1A09_029T05_9000005124_35733cztM0_level2_quad_clean.evt |
| Size (bytes) | 622,324,800 | 122,339,520 |
| Size | 593.5 MB | 116.7 MB |
| Events in quadrant A | 4,763,251 | 776,581 |
| Events in quadrant B | 4,294,942 | 791,337 |
| Events in quadrant C | 4,609,061 | 775,713 |
| Events in quadrant D | 4,577,267 | 744,686 |
| Mode SS | |||
|---|---|---|---|
| Quadrant | BADHDUFLAG | Total packets | Discarded packets |
| A | 0 | 180 | 0 |
| B | 0 | 180 | 0 |
| C | 0 | 180 | 0 |
| D | 0 | 180 | 0 |
| Mode M0 | |||
|---|---|---|---|
| Quadrant | BADHDUFLAG | Total packets | Discarded packets |
| A | 0 | 19868 | 2 |
| B | 0 | 18733 | 2 |
| C | 0 | 19086 | 2 |
| D | 0 | 19561 | 2 |
| Mode M9 | |||
|---|---|---|---|
| Quadrant | BADHDUFLAG | Total packets | Discarded packets |
| A | 0 | 22 | 0 |
| B | 0 | 22 | 0 |
| C | 0 | 22 | 0 |
| D | 0 | 23 | 0 |
| Quadrant | Total seconds | Saturated seconds | Saturation percentage |
|---|---|---|---|
| A | 8887 | 134 | 1.507820% |
| B | 8887 | 55 | 0.618882% |
| C | 8887 | 54 | 0.607629% |
| D | 8887 | 114 | 1.282773% |
Noise dominated data is calculated using 1-second bins in cleaned event files. If a bin has >2000 counts, and if more than 50% of those come from <1% of pixels, then it is considered to be noise-dominated and hence unusable.
| Quadrant | # 1 sec bins | Bins with >0 counts | Bins with >2000 counts | High rate bins dominated by noise | Noise dominated (total time) | Noise dominated (detector-on time) | Marked lightcurve |
|---|---|---|---|---|---|---|---|
| A | 10230 | 8888 | 96 | 96 | 0.94% | 1.08% | 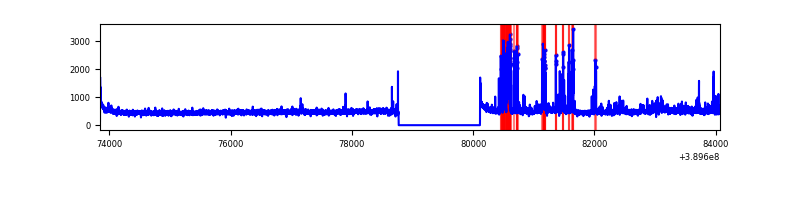 |
| B | 10230 | 8888 | 36 | 36 | 0.35% | 0.41% | 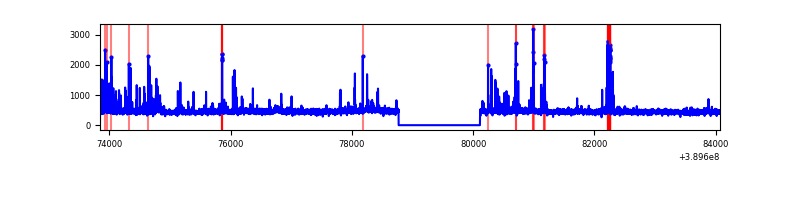 |
| C | 10230 | 8888 | 35 | 35 | 0.34% | 0.39% | 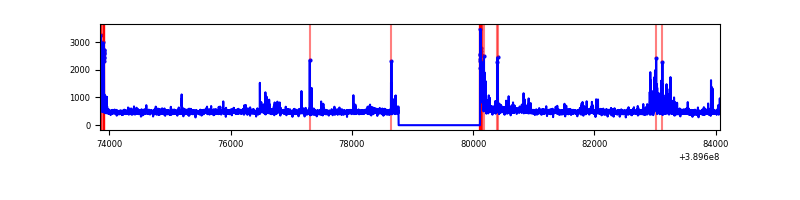 |
| D | 10230 | 8888 | 100 | 100 | 0.98% | 1.13% | 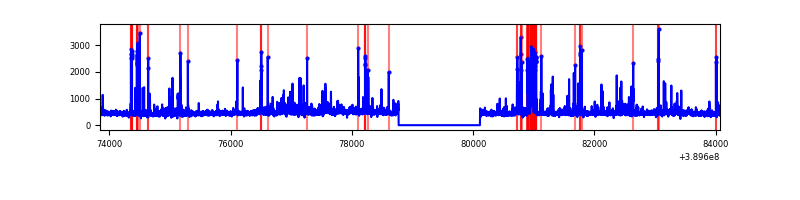 |
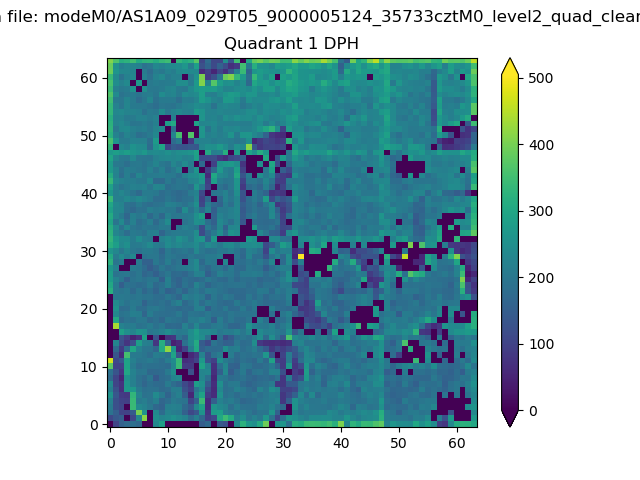
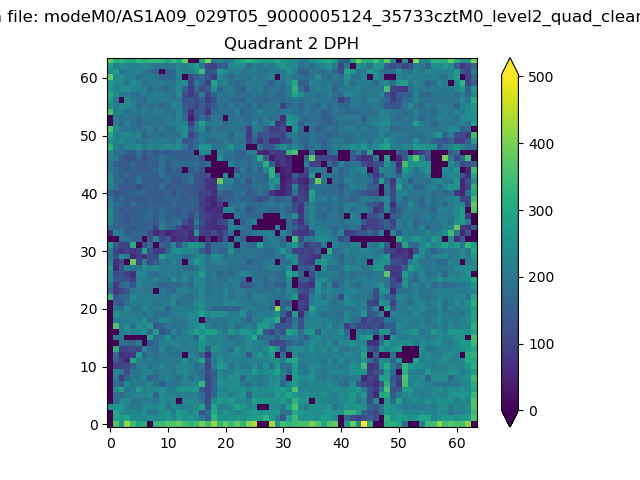
Top three noisy pixels from each quadrant. If the there are fewer than three noisy pixels in the level2.evt file, extra rows are filled as -1
| Pixel properties | Quadrant properties | ||||||
|---|---|---|---|---|---|---|---|
| Quadrant | DetID | PixID | Counts | Sigma | Mean | Median | Sigma |
| A | 15 | 169 | 658815 | 3238.33 | 1001 | 978 | 203.1 |
| A | 10 | 83 | 194201 | 951.18 | 1001 | 978 | 203.1 |
| A | 13 | 6 | 24439 | 115.49 | 1001 | 978 | 203.1 |
| B | 5 | 172 | 306342 | 1603.14 | 996 | 969 | 190.5 |
| B | 5 | 255 | 33094 | 168.65 | 996 | 969 | 190.5 |
| B | 12 | 111 | 23924 | 120.51 | 996 | 969 | 190.5 |
| C | 15 | 214 | 370193 | 1628.07 | 971 | 975 | 226.8 |
| C | 0 | 10 | 366849 | 1613.32 | 971 | 975 | 226.8 |
| C | 0 | 207 | 50534 | 218.53 | 971 | 975 | 226.8 |
| D | 13 | 249 | 415213 | 1748.06 | 974 | 945 | 237.0 |
| D | 1 | 52 | 75259 | 313.58 | 974 | 945 | 237.0 |
| D | 2 | 153 | 67600 | 281.26 | 974 | 945 | 237.0 |
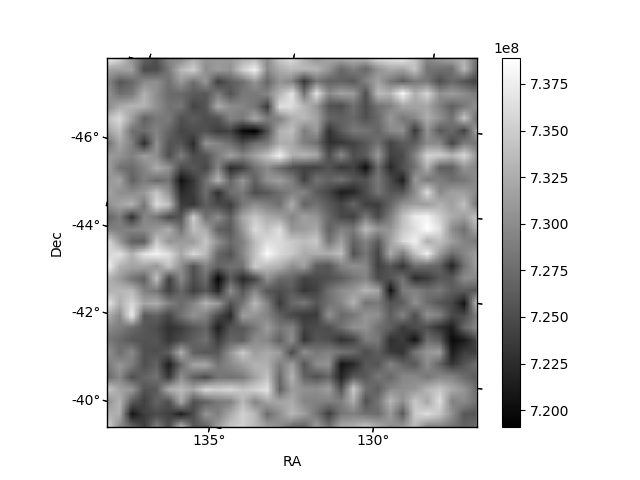
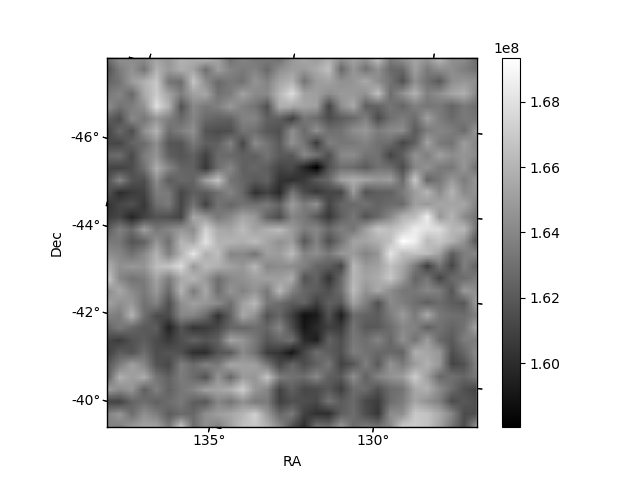
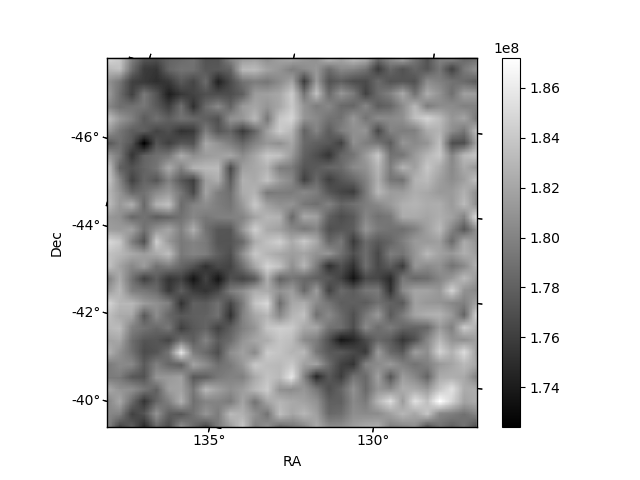
Histogram calculated using DETX and DETY for each event in the final _common_clean file
| Quadrant A | 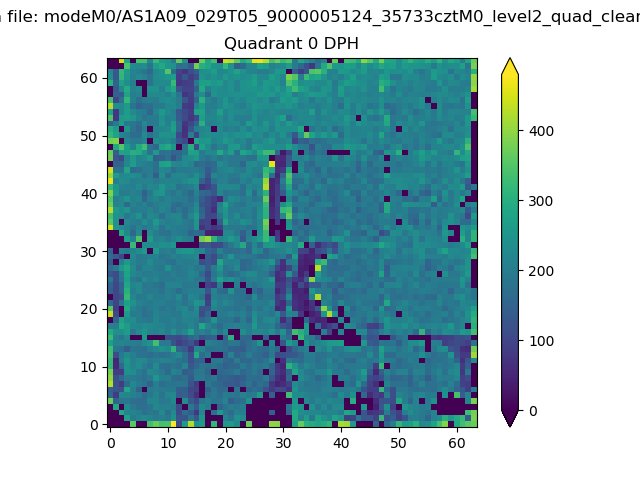 |
 |
Quadrant B |
|---|---|---|---|
| Quadrant D | 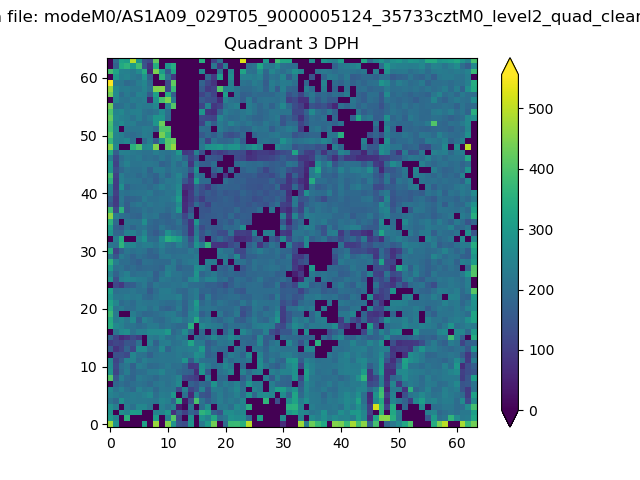 |
 |
Quadrant C |
| Plot type | Count rate plots | Images |
|---|---|---|
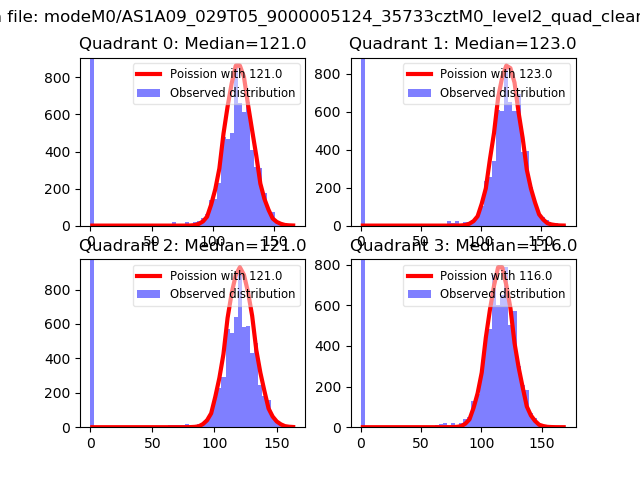
| Comparison with Poisson distribution Blue bars denote a histogram of data divided into 1 sec bins. Red curve is a Poisson curve with rate = median count rate of data. |
 |
 |
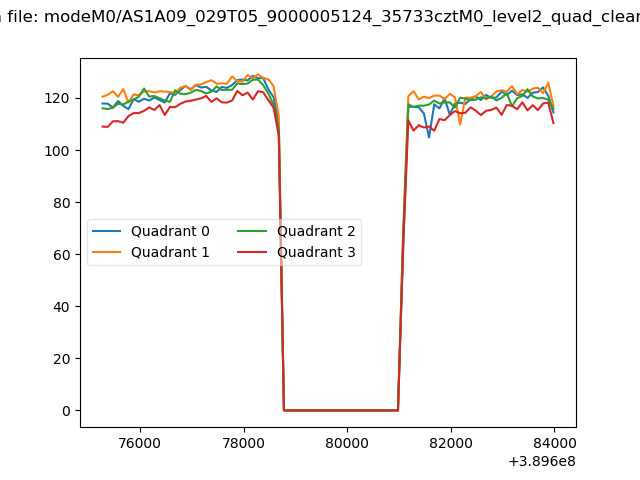
| Quadrant-wise count rates Data is divided into 100 sec bins |
 |
|
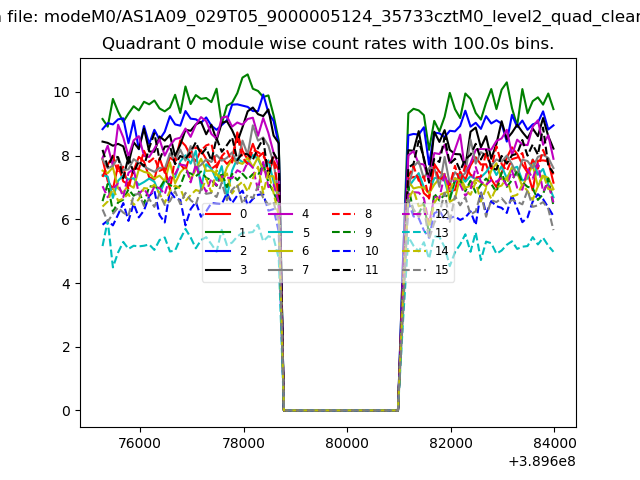
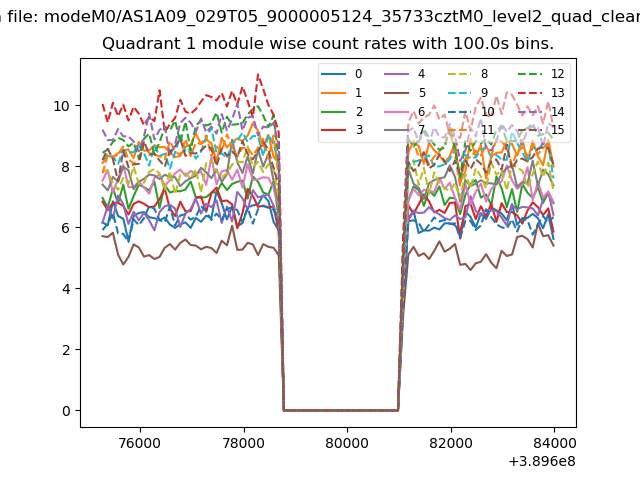
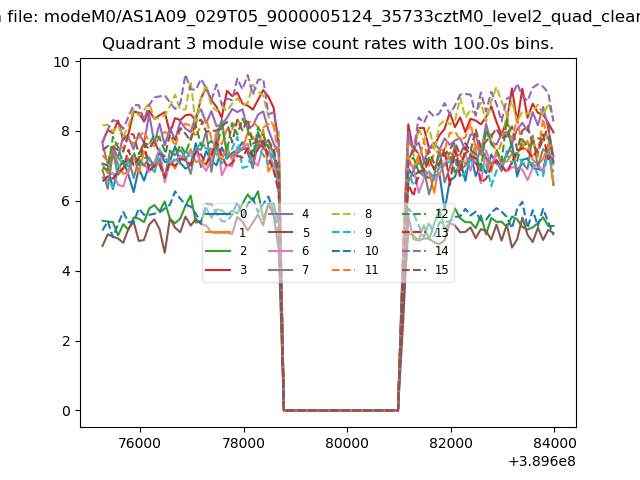
| Module-wise count rates for Quadrant A Data is divided into 100 sec bins |
 |
 |
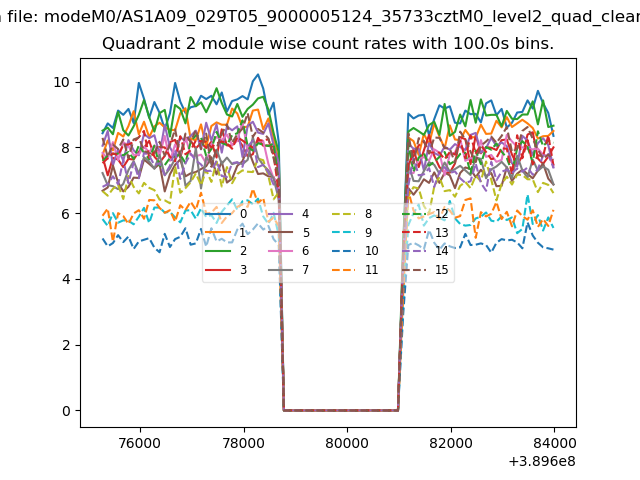
| Module-wise count rates for Quadrant B Data is divided into 100 sec bins |
 |
 |
| Module-wise count rates for Quadrant C Data is divided into 100 sec bins |
 |
 |
| Module-wise count rates for Quadrant D Data is divided into 100 sec bins |
 |
 |
| Parameter | Plot |
|---|---|
| CZT HV Monitor | 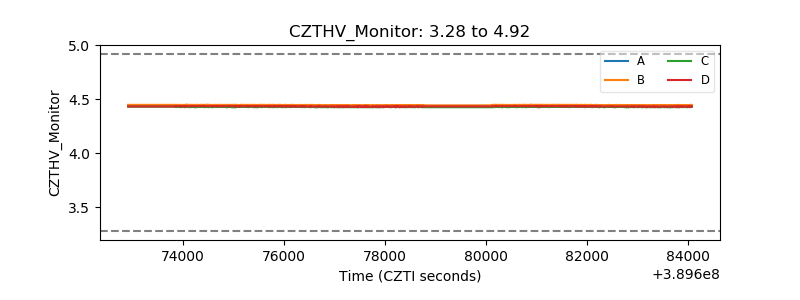 |
| D_VDD | 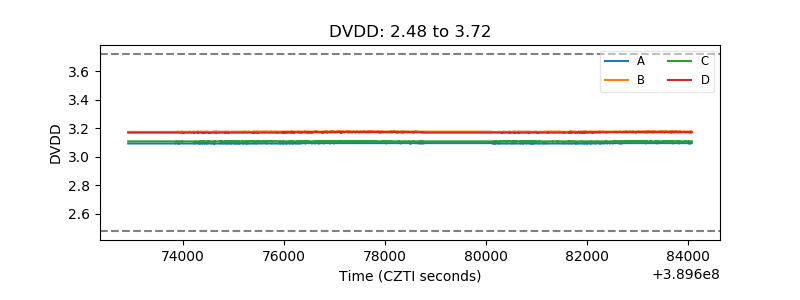 |
| Temperature 1 | 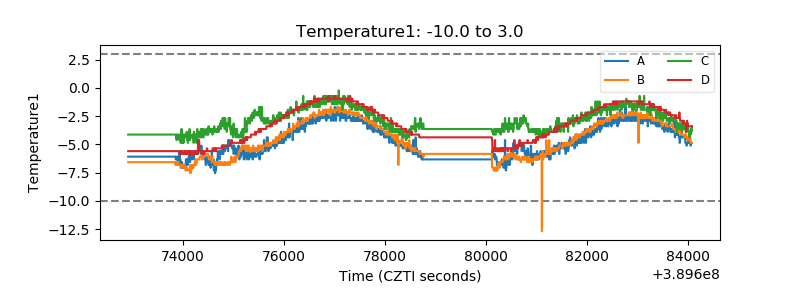 |
| Veto HV Monitor | 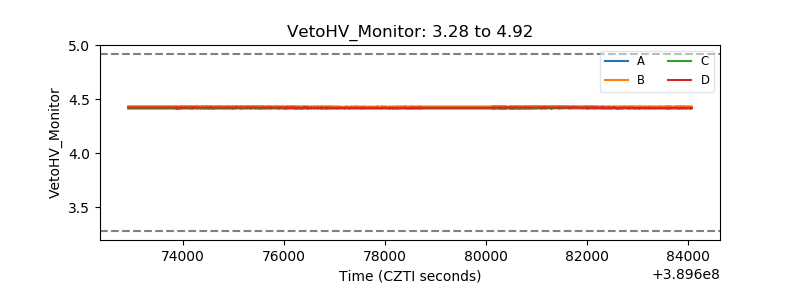 |
| Veto LLD | 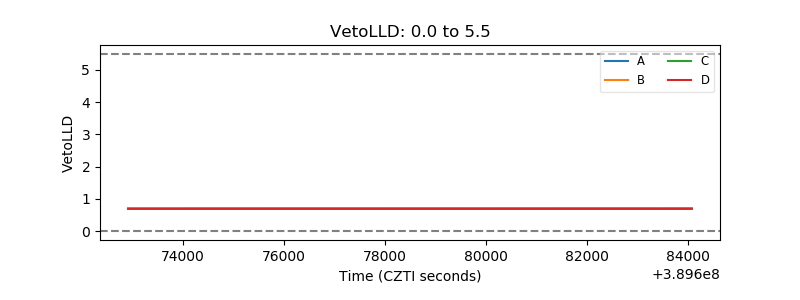 |
| Alpha Counter | 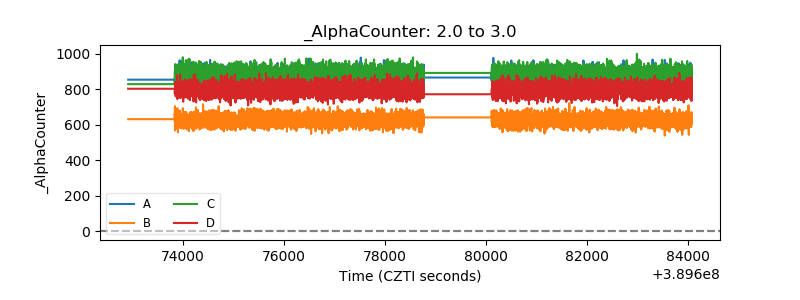 |
| _CPM_Rate | 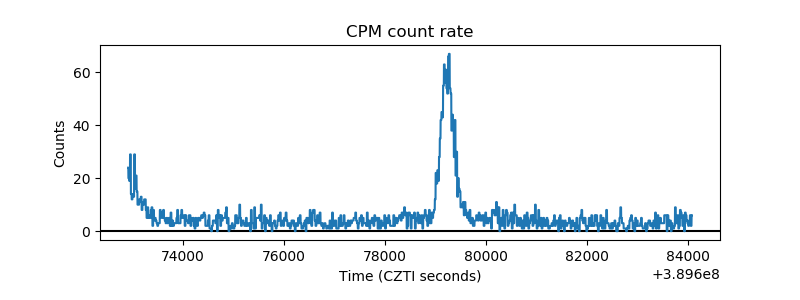 |
| CZT Counter | 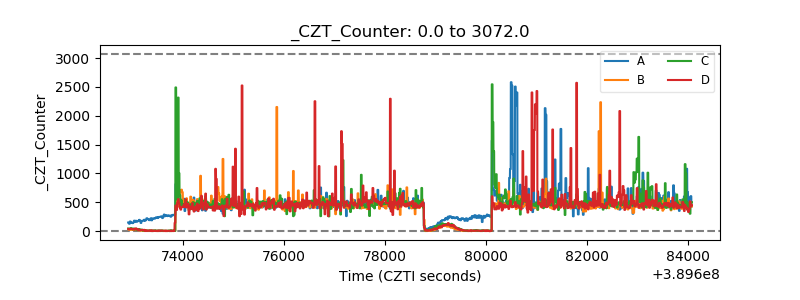 |
| +2.5 Volts monitor | 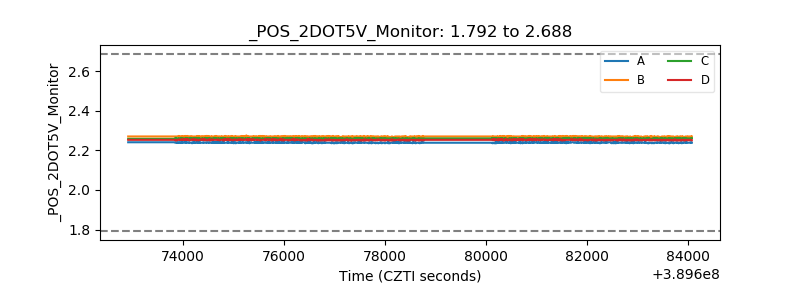 |
| +5 Volts monitor | 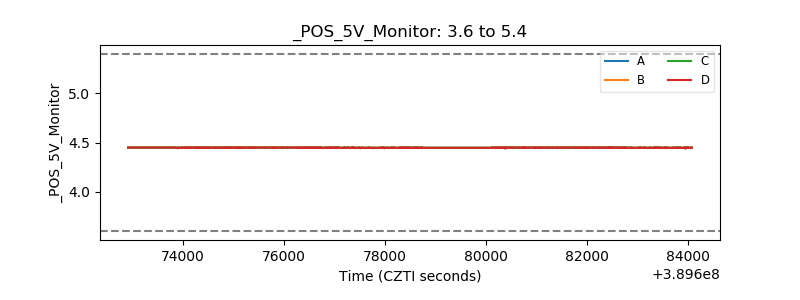 |
| _ROLL_ROT | 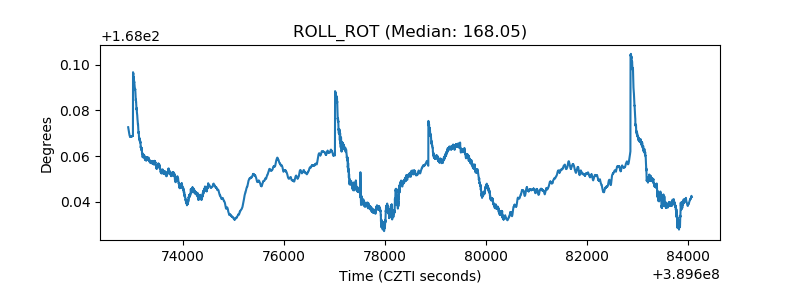 |
| _Roll_DEC | 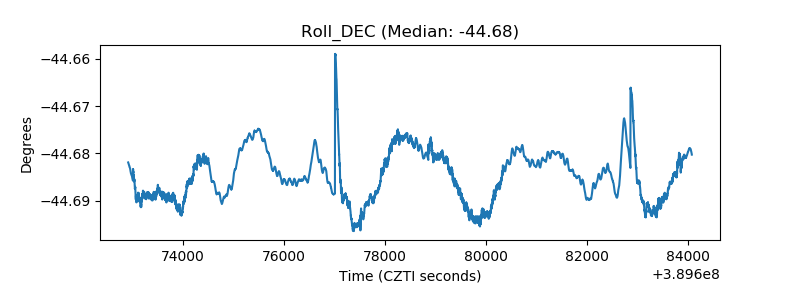 |
| _Roll_RA | 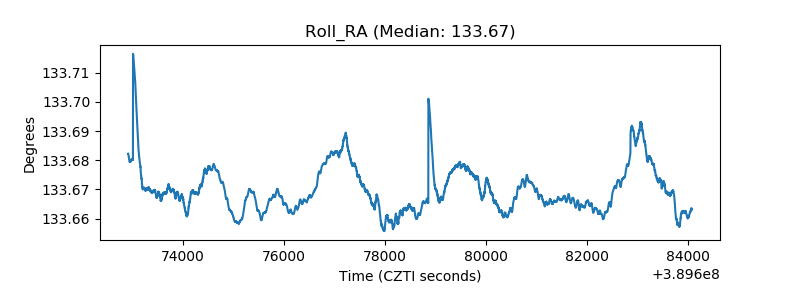 |
| Veto Counter | 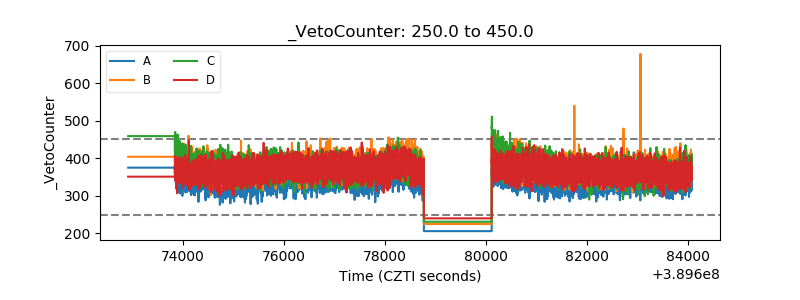 |