| Param | Original file | Final file |
|---|---|---|
| Filename | modeM0/AS1A09_029T05_9000005124_35731cztM0_level2.evt | modeM0/AS1A09_029T05_9000005124_35731cztM0_level2_quad_clean.evt |
| Size (bytes) | 439,966,080 | 71,591,040 |
| Size | 419.6 MB | 68.3 MB |
| Events in quadrant A | 2,976,397 | 437,053 |
| Events in quadrant B | 3,295,595 | 440,059 |
| Events in quadrant C | 3,221,473 | 432,252 |
| Events in quadrant D | 3,399,845 | 415,786 |
| Mode SS | |||
|---|---|---|---|
| Quadrant | BADHDUFLAG | Total packets | Discarded packets |
| A | 0 | 132 | 0 |
| B | 0 | 132 | 0 |
| C | 0 | 132 | 0 |
| D | 0 | 132 | 0 |
| Mode M0 | |||
|---|---|---|---|
| Quadrant | BADHDUFLAG | Total packets | Discarded packets |
| A | 0 | 12914 | 3 |
| B | 0 | 13976 | 2 |
| C | 0 | 13376 | 2 |
| D | 0 | 14446 | 2 |
| Mode M9 | |||
|---|---|---|---|
| Quadrant | BADHDUFLAG | Total packets | Discarded packets |
| A | 0 | 26 | 0 |
| B | 0 | 26 | 0 |
| C | 0 | 26 | 0 |
| D | 0 | 26 | 0 |
| Quadrant | Total seconds | Saturated seconds | Saturation percentage |
|---|---|---|---|
| A | 6338 | 7 | 0.110445% |
| B | 6338 | 76 | 1.199116% |
| C | 6338 | 57 | 0.899337% |
| D | 6338 | 79 | 1.246450% |
Noise dominated data is calculated using 1-second bins in cleaned event files. If a bin has >2000 counts, and if more than 50% of those come from <1% of pixels, then it is considered to be noise-dominated and hence unusable.
| Quadrant | # 1 sec bins | Bins with >0 counts | Bins with >2000 counts | High rate bins dominated by noise | Noise dominated (total time) | Noise dominated (detector-on time) | Marked lightcurve |
|---|---|---|---|---|---|---|---|
| A | 8993 | 6340 | 0 | 0 | 0.00% | 0.00% | 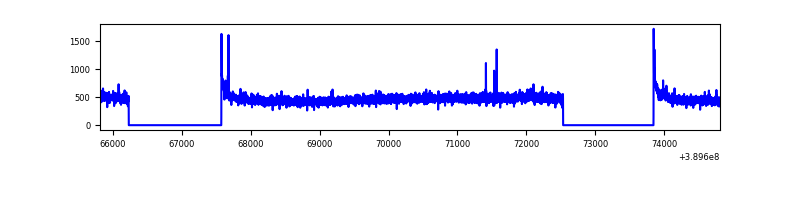 |
| B | 8993 | 6340 | 52 | 52 | 0.58% | 0.82% | 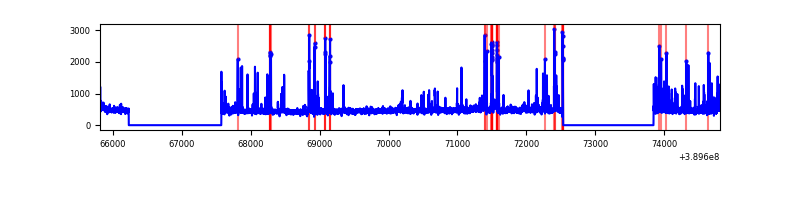 |
| C | 8993 | 6339 | 47 | 47 | 0.52% | 0.74% | 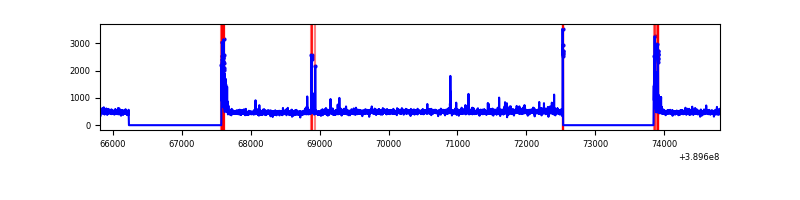 |
| D | 8993 | 6340 | 77 | 77 | 0.86% | 1.21% | 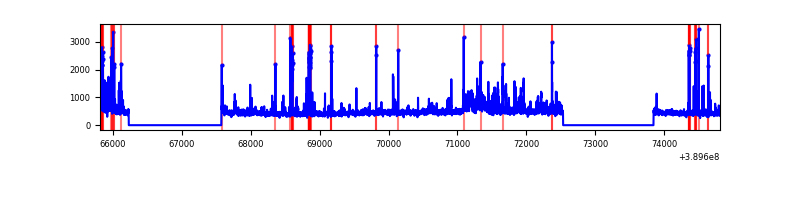 |
Top three noisy pixels from each quadrant. If the there are fewer than three noisy pixels in the level2.evt file, extra rows are filled as -1
| Pixel properties | Quadrant properties | ||||||
|---|---|---|---|---|---|---|---|
| Quadrant | DetID | PixID | Counts | Sigma | Mean | Median | Sigma |
| A | 10 | 83 | 162502 | 1108.26 | 720 | 705 | 146.0 |
| A | 13 | 6 | 19854 | 131.16 | 720 | 705 | 146.0 |
| A | 3 | 137 | 7667 | 47.69 | 720 | 705 | 146.0 |
| B | 5 | 172 | 259464 | 1878.02 | 711 | 691 | 137.8 |
| B | 4 | 81 | 181881 | 1314.97 | 711 | 691 | 137.8 |
| B | 5 | 255 | 33782 | 240.16 | 711 | 691 | 137.8 |
| C | 15 | 214 | 265859 | 1642.87 | 693 | 698 | 161.4 |
| C | 0 | 10 | 177569 | 1095.85 | 693 | 698 | 161.4 |
| C | 1 | 23 | 49054 | 299.6 | 693 | 698 | 161.4 |
| D | 13 | 249 | 226108 | 1327.56 | 694 | 673 | 169.8 |
| D | 14 | 52 | 200171 | 1174.82 | 694 | 673 | 169.8 |
| D | 1 | 52 | 79196 | 462.41 | 694 | 673 | 169.8 |
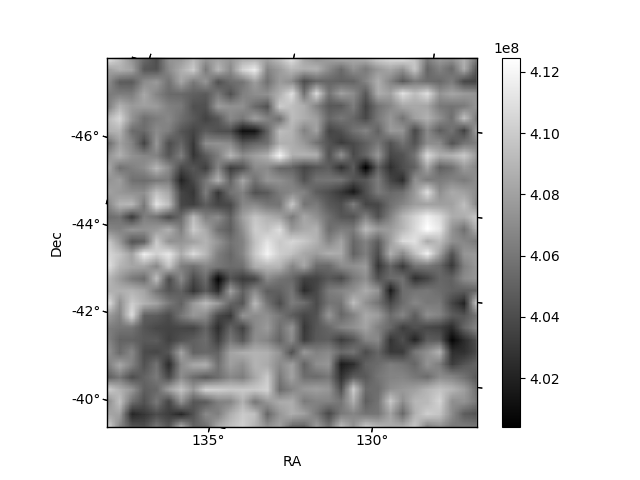
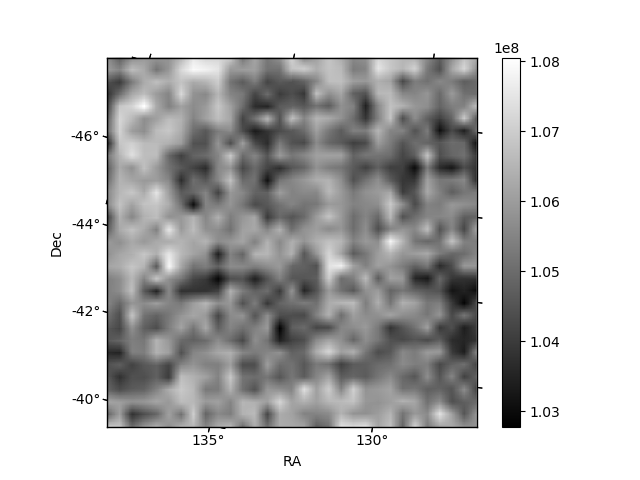
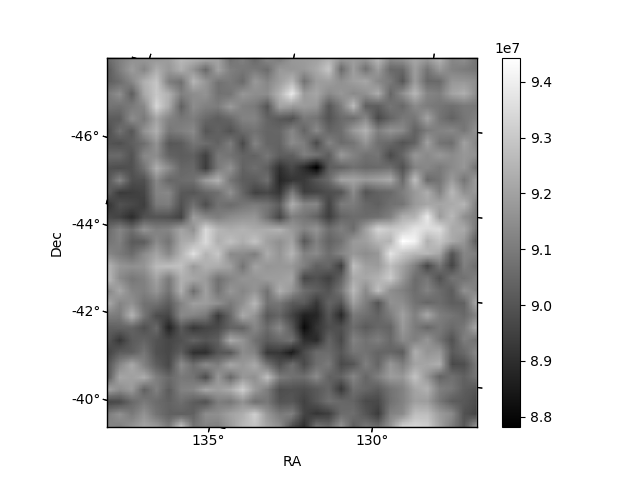
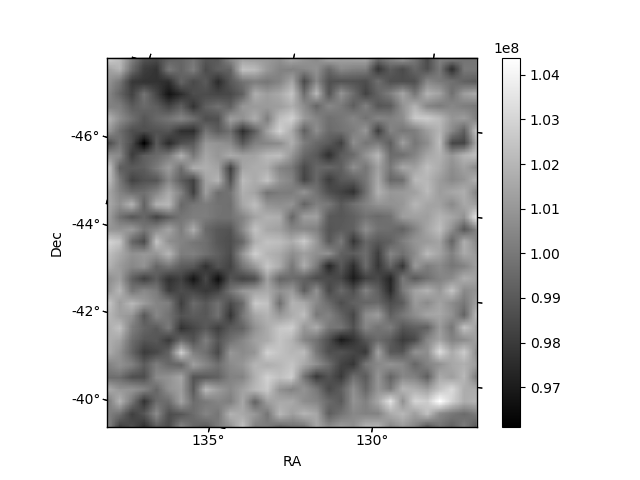
Histogram calculated using DETX and DETY for each event in the final _common_clean file
| Quadrant A | 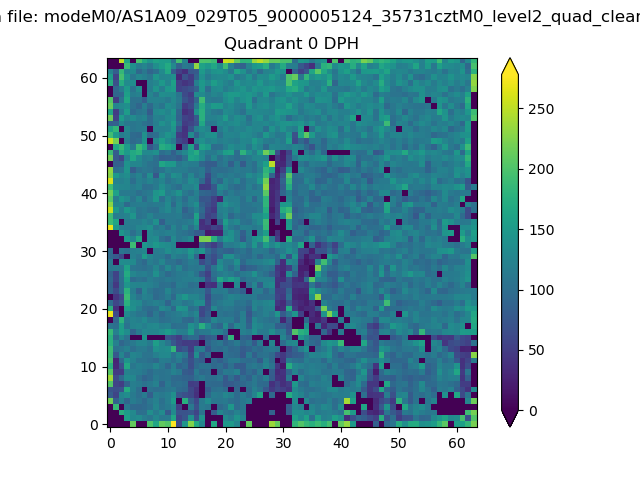 |
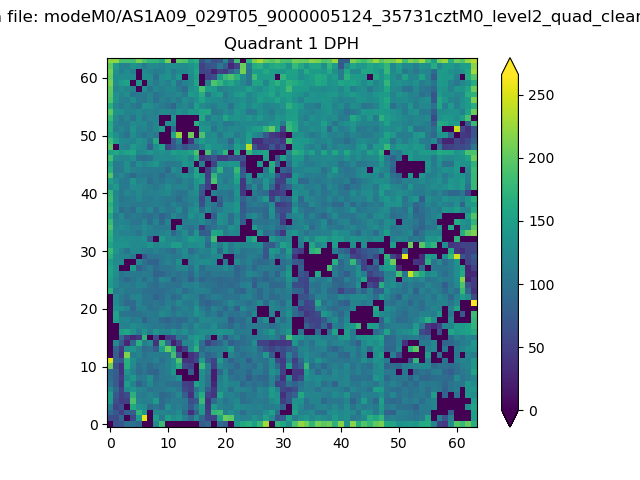 |
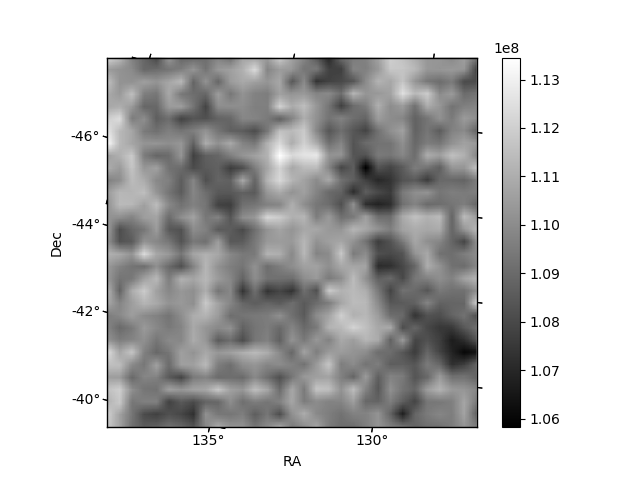
Quadrant B |
|---|---|---|---|
| Quadrant D | 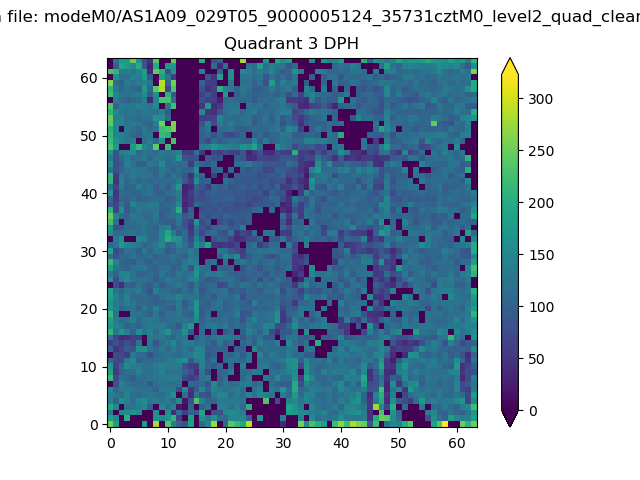 |
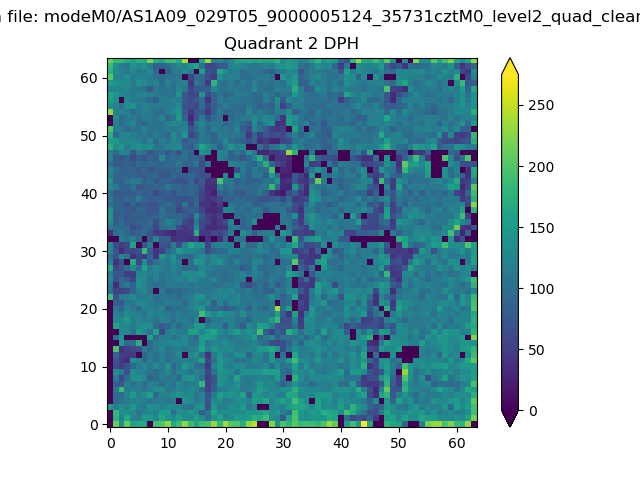 |
Quadrant C |
| Plot type | Count rate plots | Images |
|---|---|---|
| Comparison with Poisson distribution Blue bars denote a histogram of data divided into 1 sec bins. Red curve is a Poisson curve with rate = median count rate of data. |
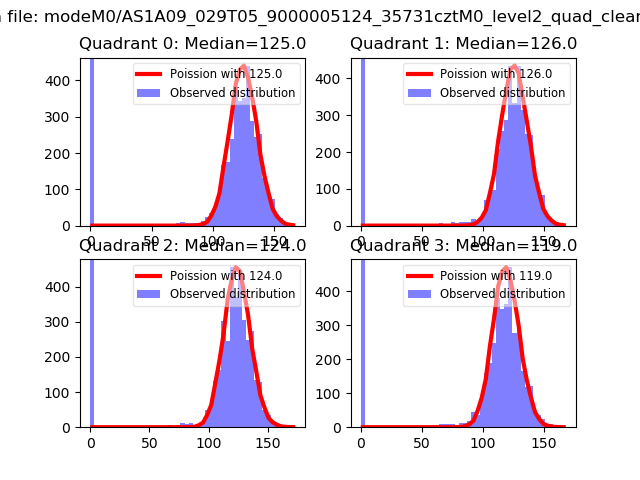 |
 |
| Quadrant-wise count rates Data is divided into 100 sec bins |
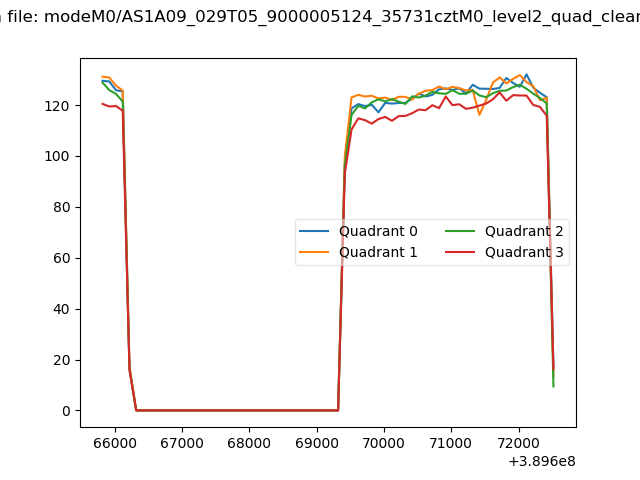 |
|
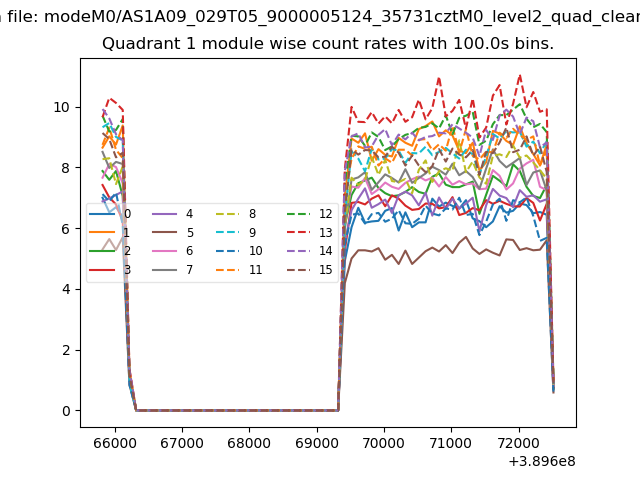
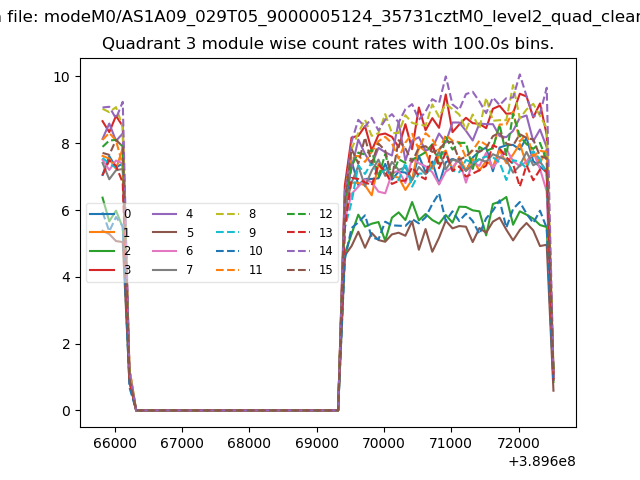
| Module-wise count rates for Quadrant A Data is divided into 100 sec bins |
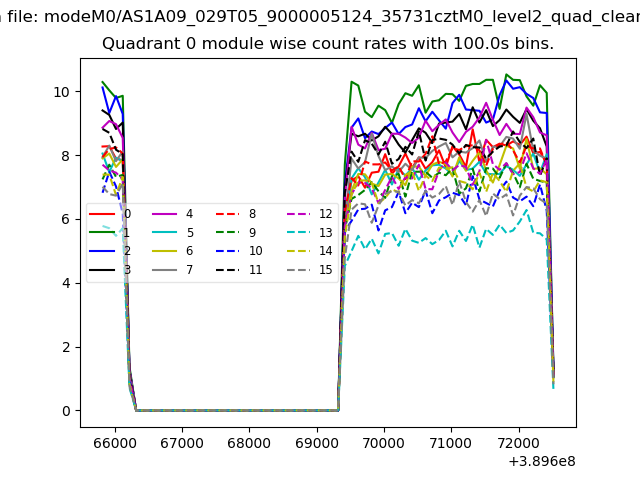 |
 |
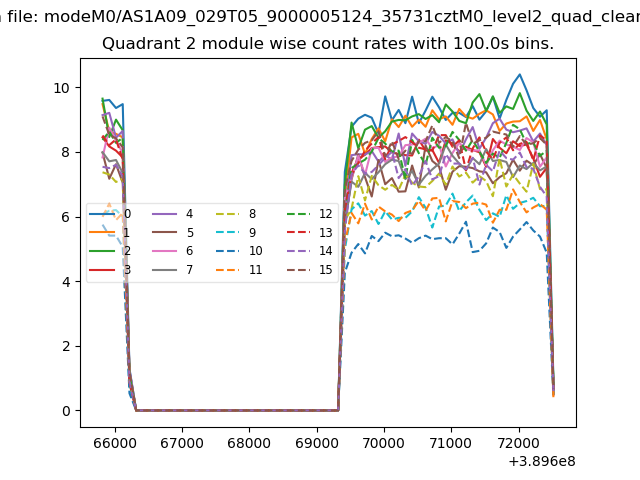
| Module-wise count rates for Quadrant B Data is divided into 100 sec bins |
 |
 |
| Module-wise count rates for Quadrant C Data is divided into 100 sec bins |
 |
 |
| Module-wise count rates for Quadrant D Data is divided into 100 sec bins |
 |
 |
| Parameter | Plot |
|---|---|
| CZT HV Monitor | 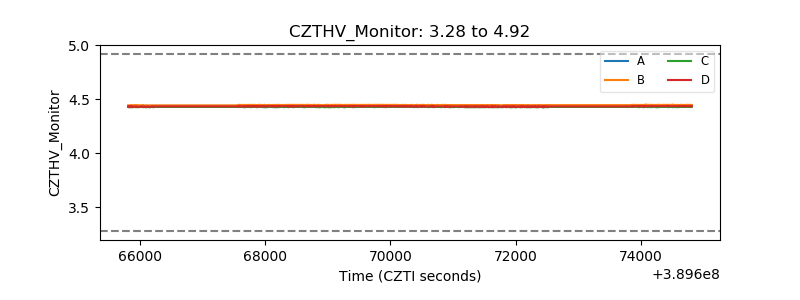 |
| D_VDD | 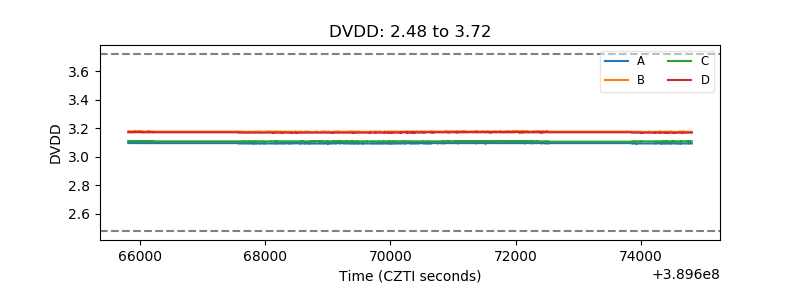 |
| Temperature 1 | 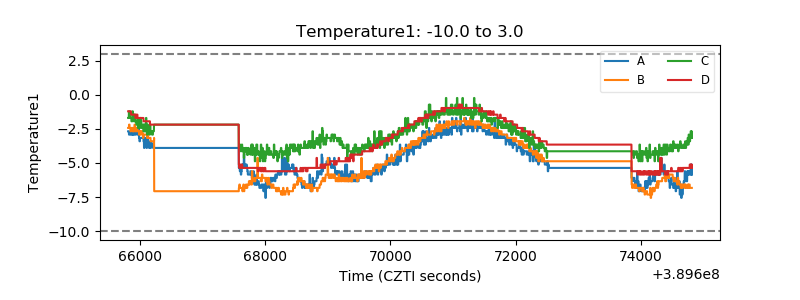 |
| Veto HV Monitor | 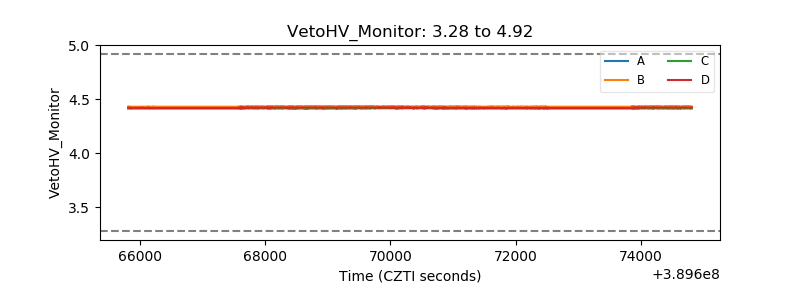 |
| Veto LLD | 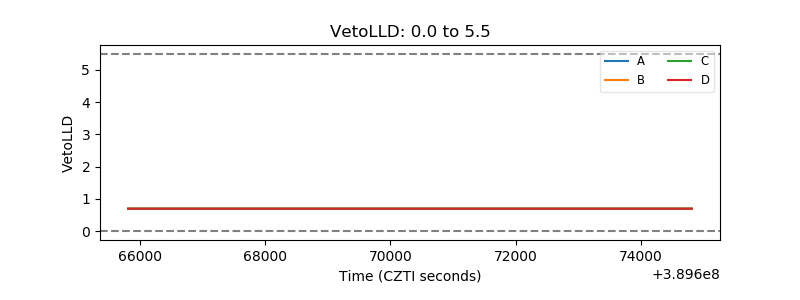 |
| Alpha Counter | 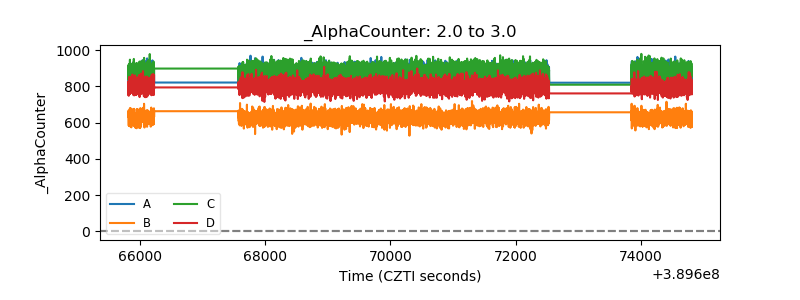 |
| _CPM_Rate | 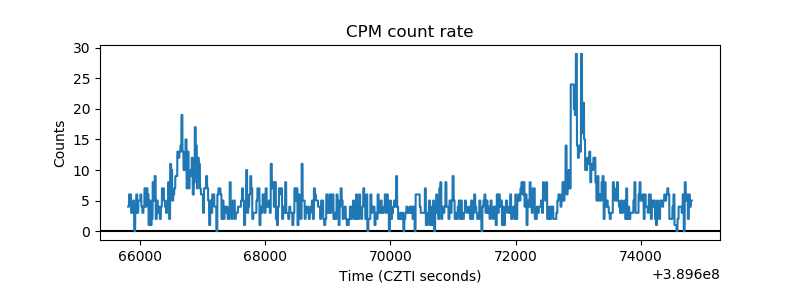 |
| CZT Counter |  |
| +2.5 Volts monitor | 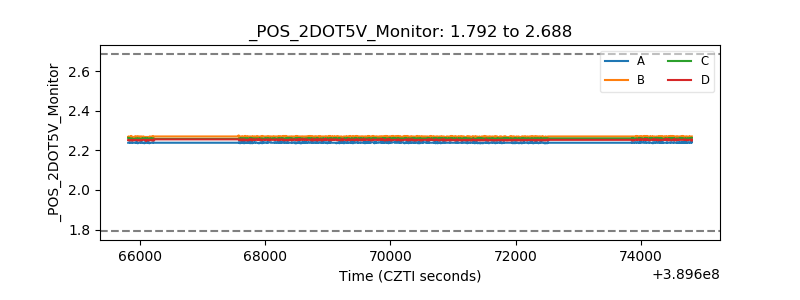 |
| +5 Volts monitor | 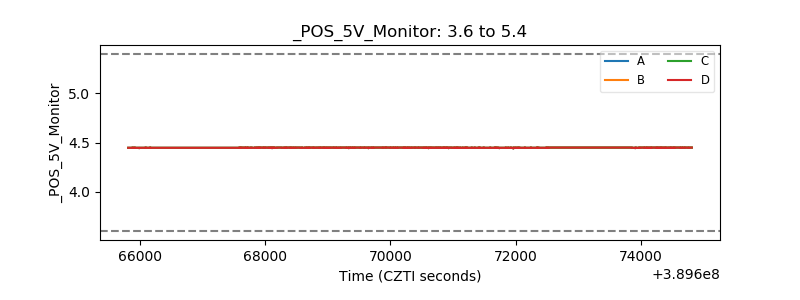 |
| _ROLL_ROT | 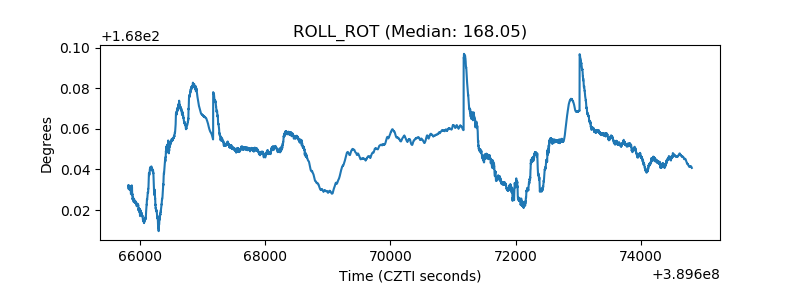 |
| _Roll_DEC | 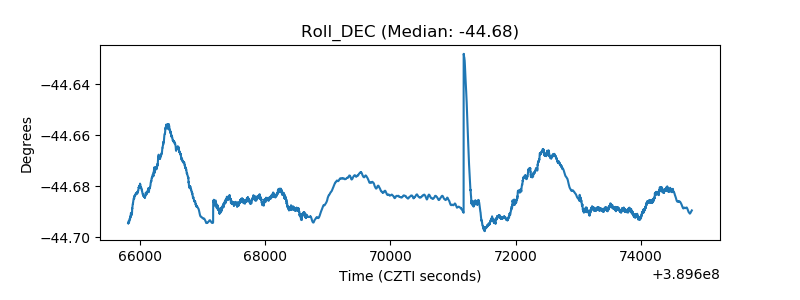 |
| _Roll_RA | 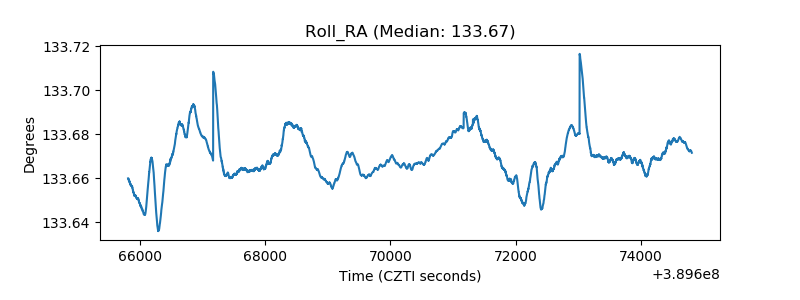 |
| Veto Counter | 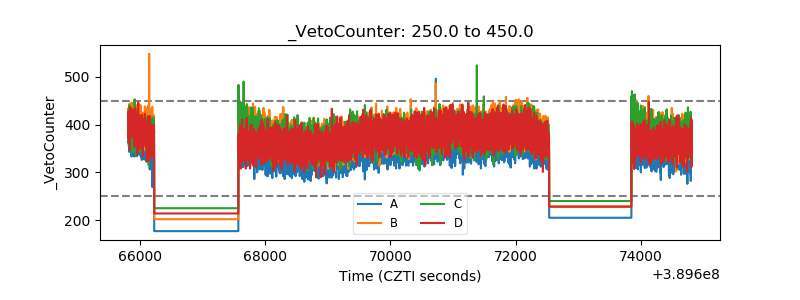 |