| Param | Original file | Final file |
|---|---|---|
| Filename | modeM0/AS1A09_029T05_9000005124_35727cztM0_level2.evt | modeM0/AS1A09_029T05_9000005124_35727cztM0_level2_quad_clean.evt |
| Size (bytes) | 367,369,920 | 62,588,160 |
| Size | 350.4 MB | 59.7 MB |
| Events in quadrant A | 2,391,394 | 397,603 |
| Events in quadrant B | 2,690,575 | 398,954 |
| Events in quadrant C | 2,887,444 | 381,149 |
| Events in quadrant D | 2,819,409 | 370,014 |
| Mode SS | |||
|---|---|---|---|
| Quadrant | BADHDUFLAG | Total packets | Discarded packets |
| A | 0 | 102 | 0 |
| B | 0 | 102 | 0 |
| C | 0 | 102 | 0 |
| D | 0 | 102 | 0 |
| Mode M0 | |||
|---|---|---|---|
| Quadrant | BADHDUFLAG | Total packets | Discarded packets |
| A | 0 | 10252 | 3 |
| B | 0 | 11189 | 2 |
| C | 0 | 11765 | 2 |
| D | 0 | 11808 | 2 |
| Mode M9 | |||
|---|---|---|---|
| Quadrant | BADHDUFLAG | Total packets | Discarded packets |
| A | 0 | 33 | 0 |
| B | 0 | 33 | 0 |
| C | 0 | 33 | 0 |
| D | 0 | 34 | 0 |
| Quadrant | Total seconds | Saturated seconds | Saturation percentage |
|---|---|---|---|
| A | 4948 | 12 | 0.242522% |
| B | 4948 | 84 | 1.697656% |
| C | 4948 | 73 | 1.475344% |
| D | 4948 | 80 | 1.616815% |
Noise dominated data is calculated using 1-second bins in cleaned event files. If a bin has >2000 counts, and if more than 50% of those come from <1% of pixels, then it is considered to be noise-dominated and hence unusable.
| Quadrant | # 1 sec bins | Bins with >0 counts | Bins with >2000 counts | High rate bins dominated by noise | Noise dominated (total time) | Noise dominated (detector-on time) | Marked lightcurve |
|---|---|---|---|---|---|---|---|
| A | 7041 | 4949 | 0 | 0 | 0.00% | 0.00% | 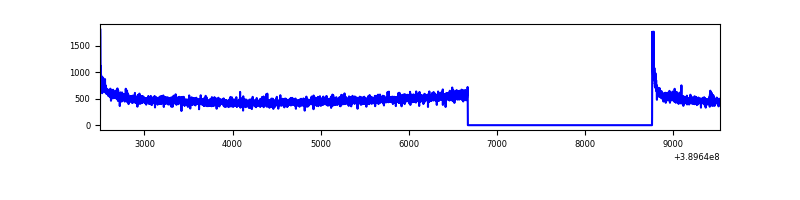 |
| B | 7041 | 4949 | 59 | 59 | 0.84% | 1.19% | 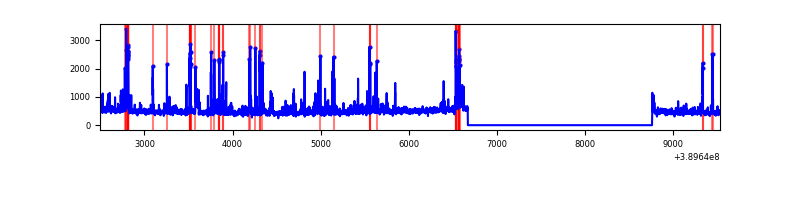 |
| C | 7041 | 4949 | 77 | 77 | 1.09% | 1.56% | 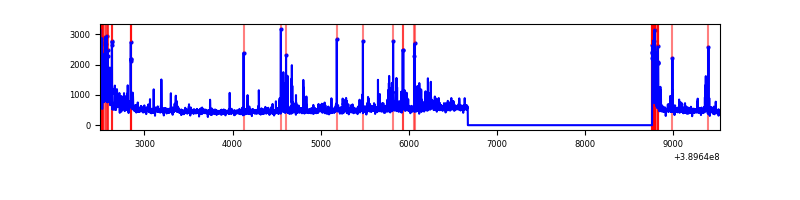 |
| D | 7041 | 4949 | 86 | 86 | 1.22% | 1.74% | 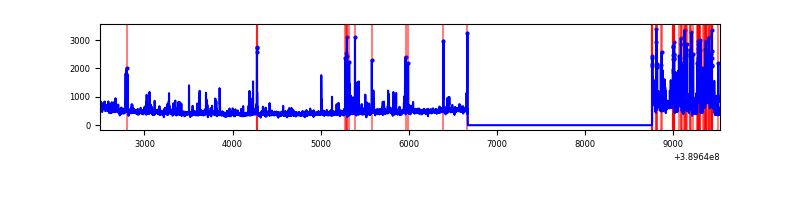 |
Top three noisy pixels from each quadrant. If the there are fewer than three noisy pixels in the level2.evt file, extra rows are filled as -1
| Pixel properties | Quadrant properties | ||||||
|---|---|---|---|---|---|---|---|
| Quadrant | DetID | PixID | Counts | Sigma | Mean | Median | Sigma |
| A | 10 | 83 | 145791 | 1259.61 | 571 | 561 | 115.3 |
| A | 13 | 6 | 15410 | 128.79 | 571 | 561 | 115.3 |
| A | 7 | 48 | 10406 | 85.39 | 571 | 561 | 115.3 |
| B | 5 | 172 | 273952 | 2515.89 | 568 | 555 | 108.7 |
| B | 15 | 85 | 54422 | 495.7 | 568 | 555 | 108.7 |
| B | 5 | 255 | 43627 | 396.36 | 568 | 555 | 108.7 |
| C | 15 | 214 | 210291 | 1661.15 | 544 | 549 | 126.3 |
| C | 0 | 10 | 195307 | 1542.48 | 544 | 549 | 126.3 |
| C | 1 | 23 | 194110 | 1533.0 | 544 | 549 | 126.3 |
| D | 14 | 52 | 344737 | 2559.2 | 544 | 528 | 134.5 |
| D | 13 | 249 | 140120 | 1037.87 | 544 | 528 | 134.5 |
| D | 2 | 249 | 39066 | 286.53 | 544 | 528 | 134.5 |
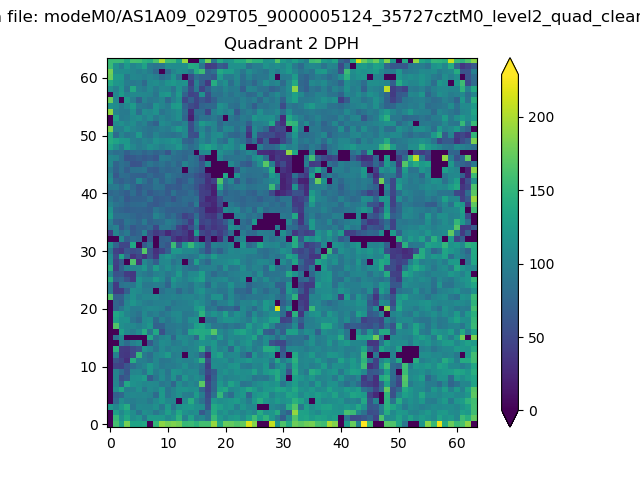
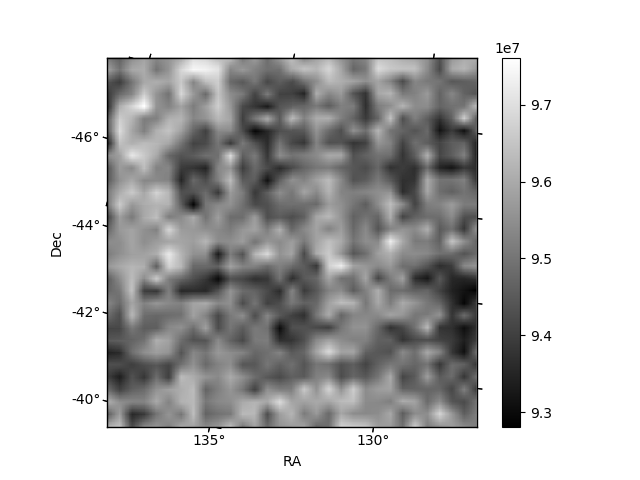
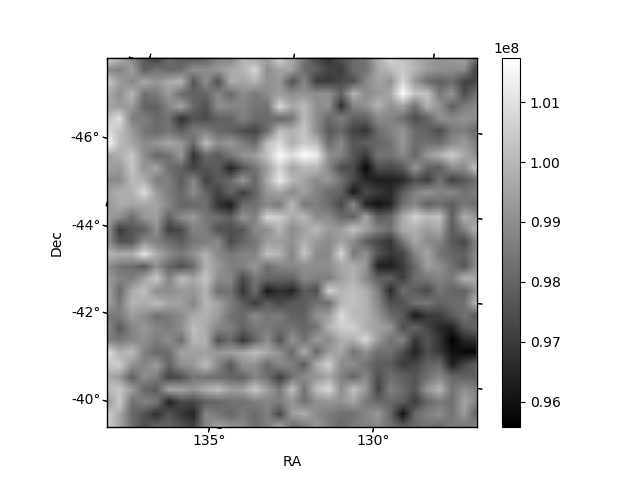
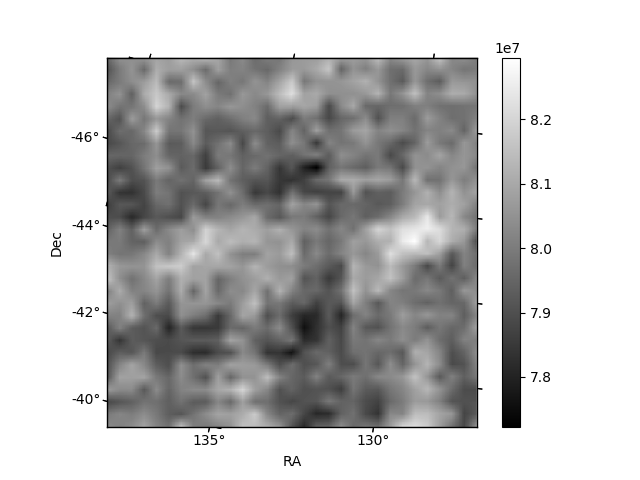
Histogram calculated using DETX and DETY for each event in the final _common_clean file
| Quadrant A | 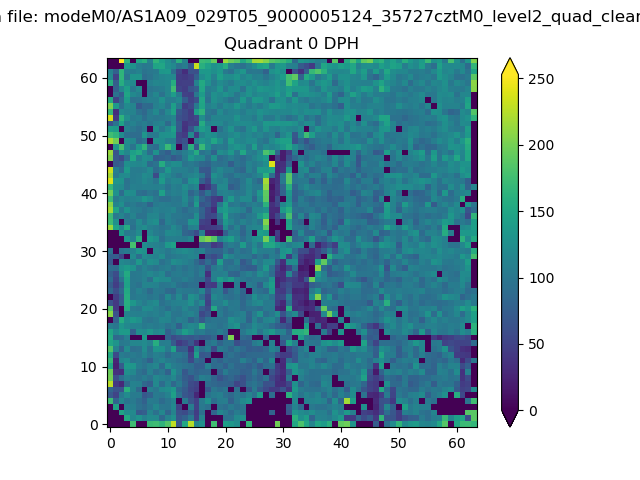 |
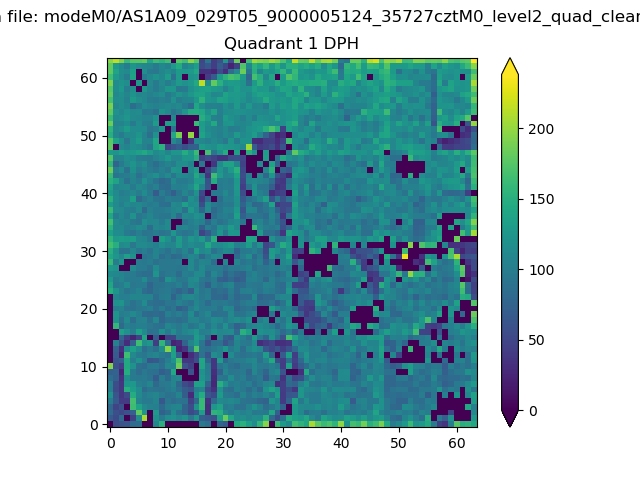 |
Quadrant B |
|---|---|---|---|
| Quadrant D | 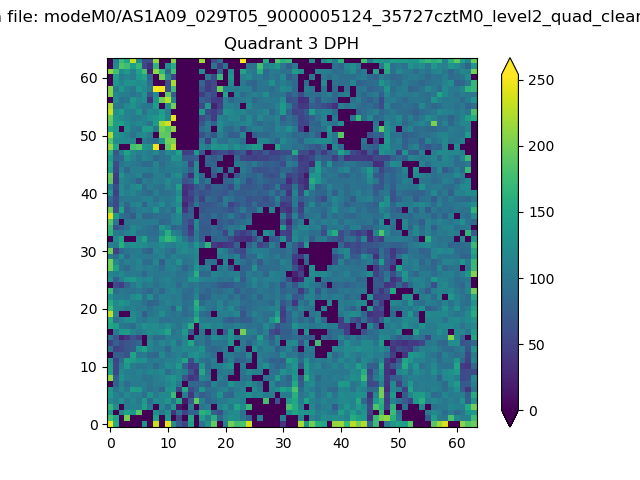 |
 |
Quadrant C |
| Plot type | Count rate plots | Images |
|---|---|---|
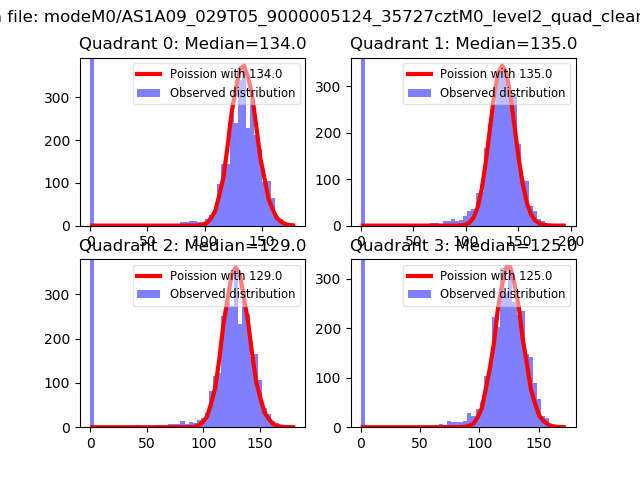
| Comparison with Poisson distribution Blue bars denote a histogram of data divided into 1 sec bins. Red curve is a Poisson curve with rate = median count rate of data. |
 |
 |
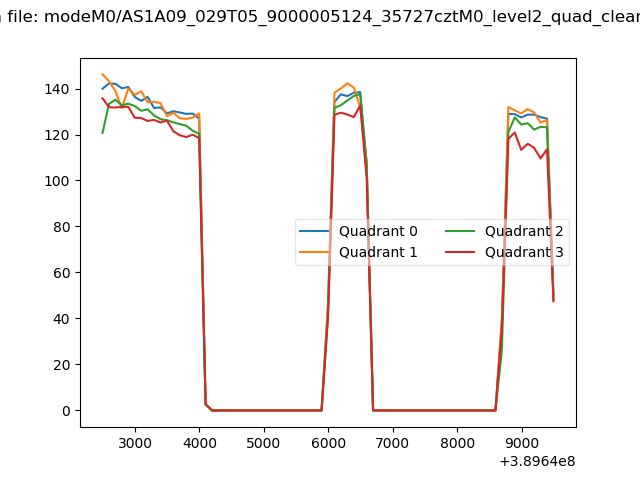
| Quadrant-wise count rates Data is divided into 100 sec bins |
 |
|
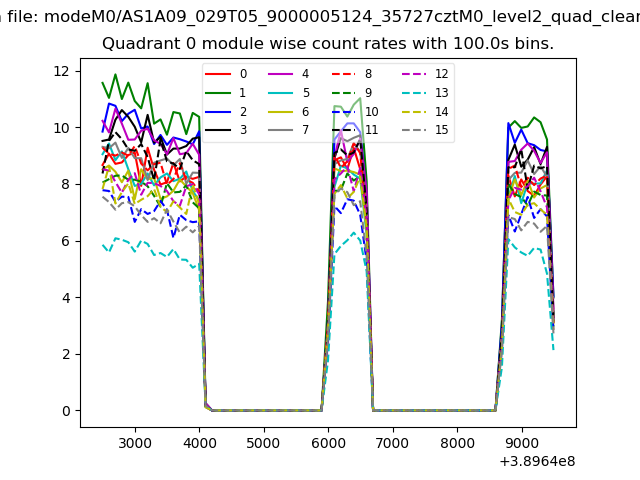
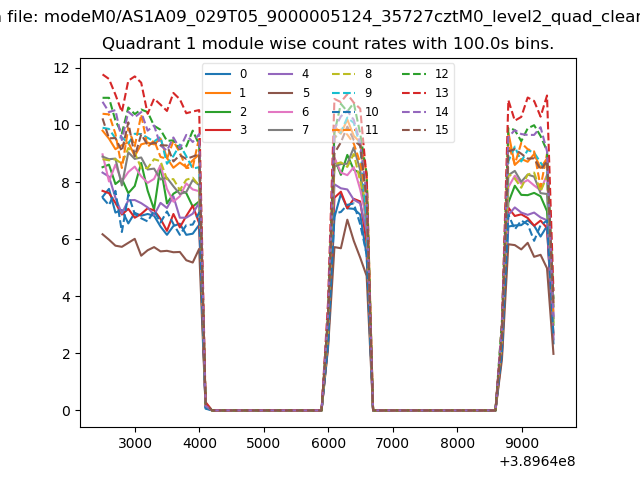
| Module-wise count rates for Quadrant A Data is divided into 100 sec bins |
 |
 |
| Module-wise count rates for Quadrant B Data is divided into 100 sec bins |
 |
 |
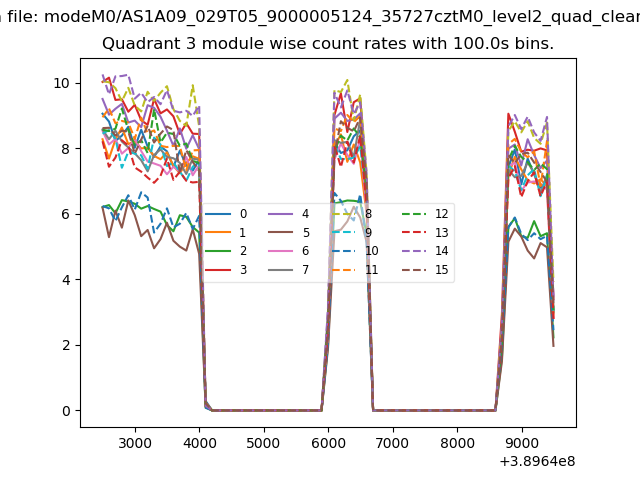
| Module-wise count rates for Quadrant C Data is divided into 100 sec bins |
 |
 |
| Module-wise count rates for Quadrant D Data is divided into 100 sec bins |
 |
 |
| Parameter | Plot |
|---|---|
| CZT HV Monitor | 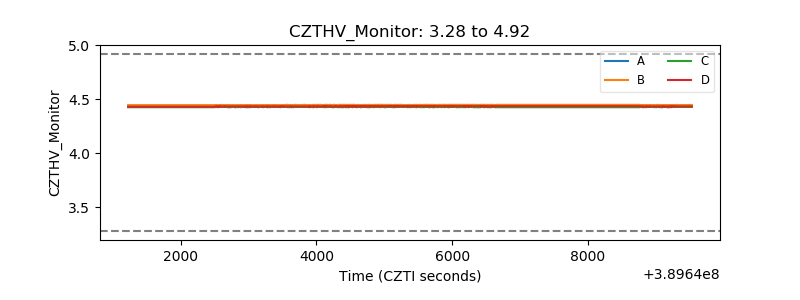 |
| D_VDD | 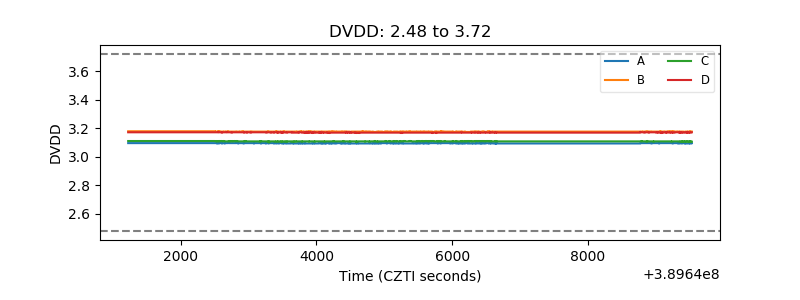 |
| Temperature 1 | 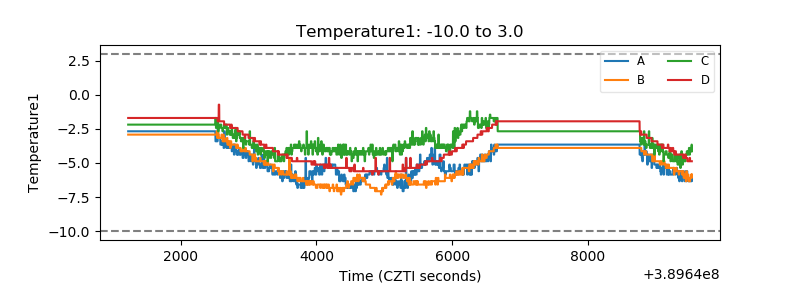 |
| Veto HV Monitor | 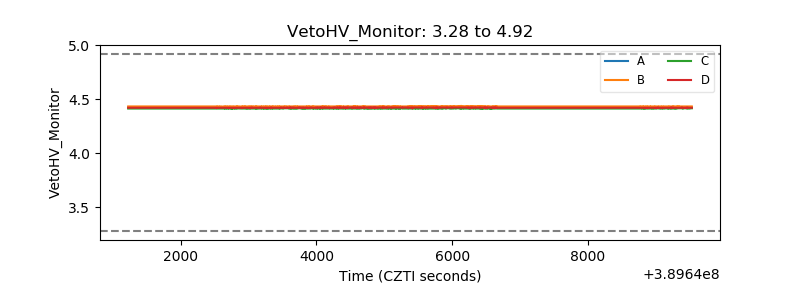 |
| Veto LLD | 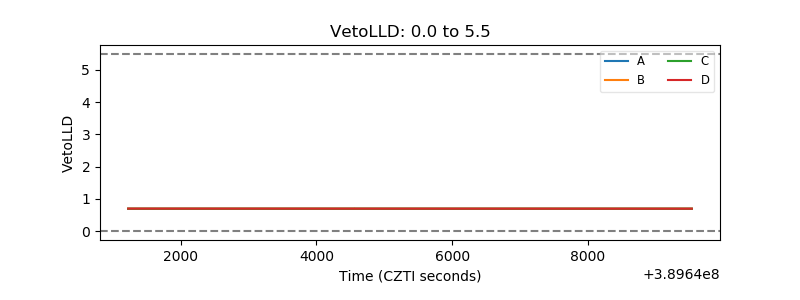 |
| Alpha Counter | 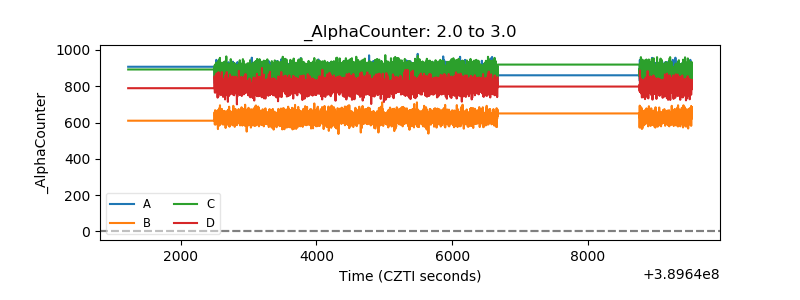 |
| _CPM_Rate | 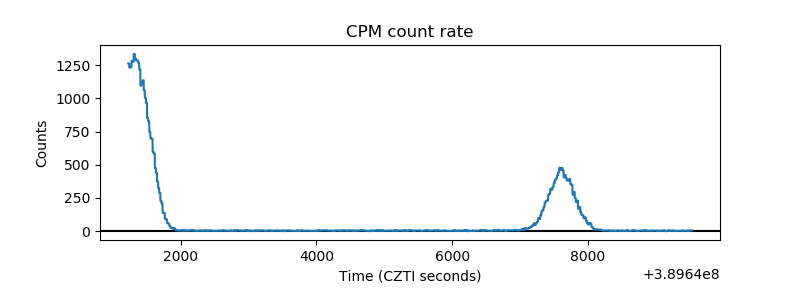 |
| CZT Counter | 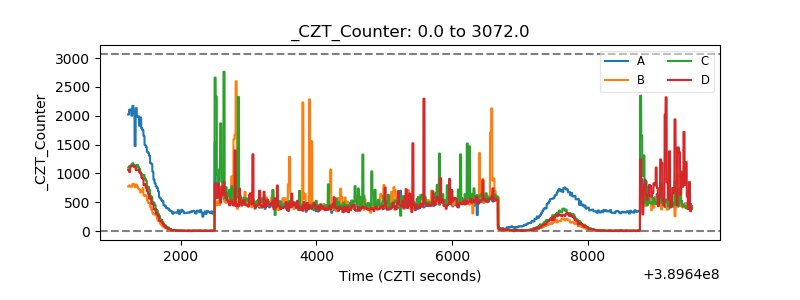 |
| +2.5 Volts monitor | 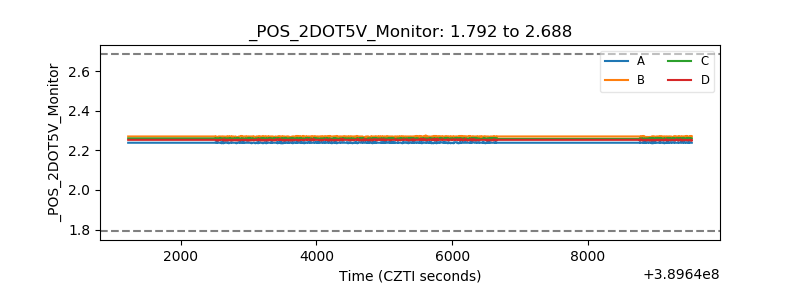 |
| +5 Volts monitor | 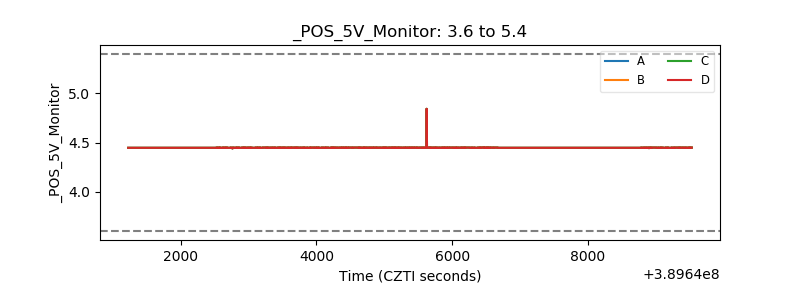 |
| _ROLL_ROT | 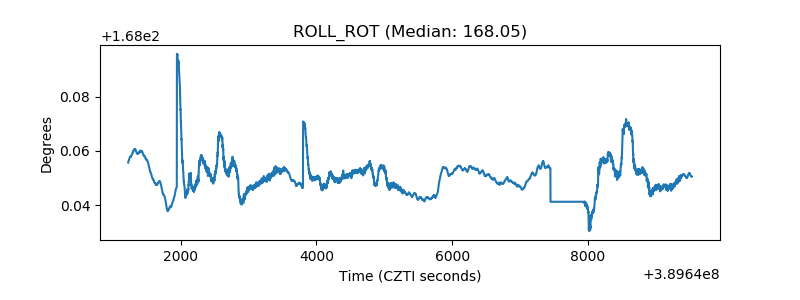 |
| _Roll_DEC | 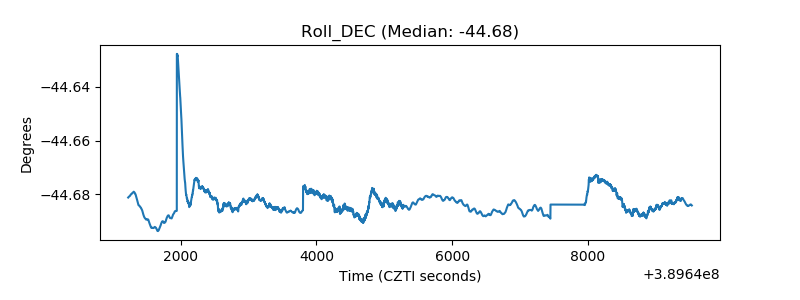 |
| _Roll_RA | 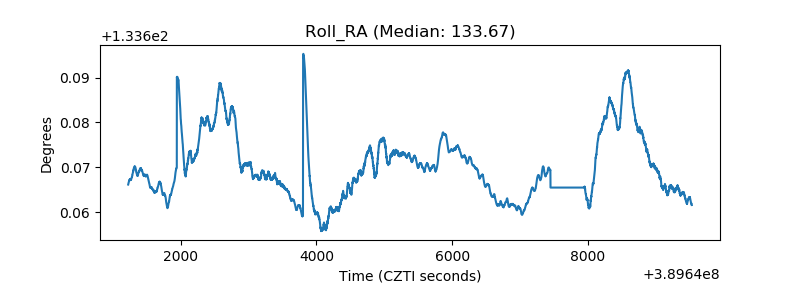 |
| Veto Counter | 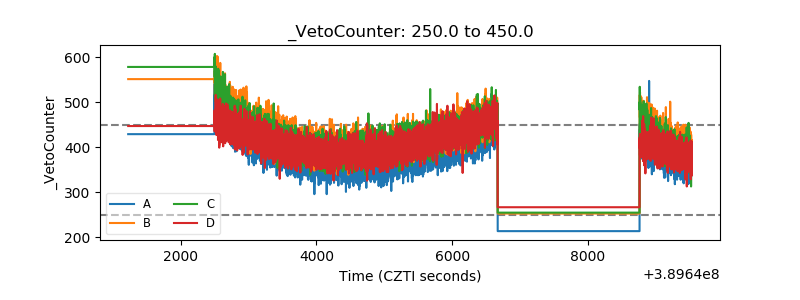 |