| Param | Original file | Final file |
|---|---|---|
| Filename | modeM0/AS1A09_029T05_9000005124cztM0_level2_bc.evt | modeM0/AS1A09_029T05_9000005124cztM0_level2_quad_clean.evt |
| Size (bytes) | 1,171,615,680 | 394,159,680 |
| Size | 1.1 GB | 375.9 MB |
| Events in quadrant A | 7,476,816 | 2,498,639 |
| Events in quadrant B | 7,680,330 | 2,511,301 |
| Events in quadrant C | 9,401,046 | 2,429,366 |
| Events in quadrant D | 8,789,434 | 2,349,755 |
| Mode SS | |||
|---|---|---|---|
| Quadrant | BADHDUFLAG | Total packets | Discarded packets |
| A | 0 | 638 | 0 |
| B | 0 | 638 | 0 |
| C | 0 | 638 | 0 |
| D | 0 | 638 | 0 |
| Mode M0 | |||
|---|---|---|---|
| Quadrant | BADHDUFLAG | Total packets | Discarded packets |
| A | 0 | 65789 | 0 |
| B | 0 | 67930 | 0 |
| C | 0 | 71077 | 0 |
| D | 0 | 71382 | 0 |
| Mode M9 | |||
|---|---|---|---|
| Quadrant | BADHDUFLAG | Total packets | Discarded packets |
| A | 0 | 105 | 0 |
| B | 0 | 105 | 0 |
| C | 0 | 105 | 0 |
| D | 0 | 105 | 0 |
| Quadrant | Total seconds | Saturated seconds | Saturation percentage |
|---|---|---|---|
| A | 31271 | 160 | 0.511656% |
| B | 31271 | 318 | 1.016917% |
| C | 31270 | 438 | 1.400704% |
| D | 31271 | 527 | 1.685268% |
Noise dominated data is calculated using 1-second bins in cleaned event files. If a bin has >2000 counts, and if more than 50% of those come from <1% of pixels, then it is considered to be noise-dominated and hence unusable.
| Quadrant | # 1 sec bins | Bins with >0 counts | Bins with >2000 counts | High rate bins dominated by noise | Noise dominated (total time) | Noise dominated (detector-on time) | Marked lightcurve |
|---|---|---|---|---|---|---|---|
| A | 54119 | 31277 | 15 | 15 | 0.03% | 0.05% | 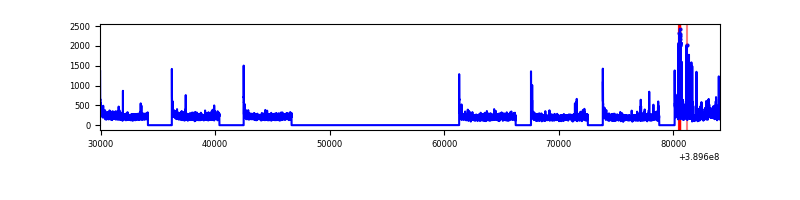 |
| B | 54118 | 31271 | 20 | 20 | 0.04% | 0.06% | 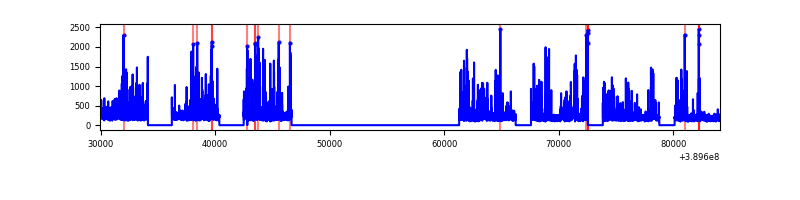 |
| C | 54118 | 31269 | 129 | 129 | 0.24% | 0.41% | 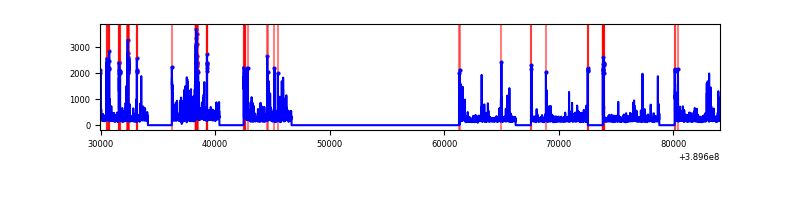 |
| D | 54118 | 31269 | 55 | 55 | 0.10% | 0.18% | 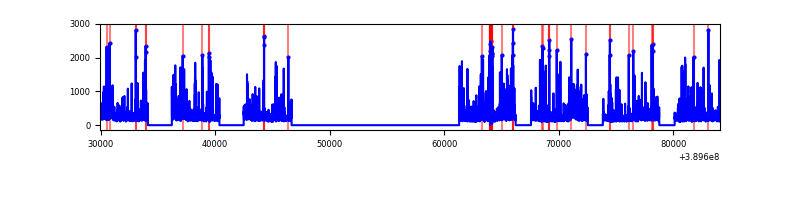 |
Top three noisy pixels from each quadrant. If the there are fewer than three noisy pixels in the level2.evt file, extra rows are filled as -1
| Pixel properties | Quadrant properties | ||||||
|---|---|---|---|---|---|---|---|
| Quadrant | DetID | PixID | Counts | Sigma | Mean | Median | Sigma |
| A | 10 | 83 | 668254 | 1877.07 | 1595 | 1566 | 355.2 |
| A | 15 | 169 | 506596 | 1421.92 | 1595 | 1566 | 355.2 |
| A | 13 | 6 | 81009 | 223.67 | 1595 | 1566 | 355.2 |
| B | 5 | 172 | 945886 | 2945.32 | 1598 | 1562 | 320.6 |
| B | 4 | 81 | 172215 | 532.26 | 1598 | 1562 | 320.6 |
| B | 5 | 255 | 151600 | 467.96 | 1598 | 1562 | 320.6 |
| C | 15 | 214 | 1234954 | 3550.84 | 1522 | 1506 | 347.4 |
| C | 0 | 207 | 920952 | 2646.89 | 1522 | 1506 | 347.4 |
| C | 0 | 10 | 695165 | 1996.9 | 1522 | 1506 | 347.4 |
| D | 13 | 249 | 1070108 | 2926.13 | 1545 | 1500 | 365.2 |
| D | 1 | 52 | 246299 | 670.32 | 1545 | 1500 | 365.2 |
| D | 14 | 52 | 218037 | 592.93 | 1545 | 1500 | 365.2 |
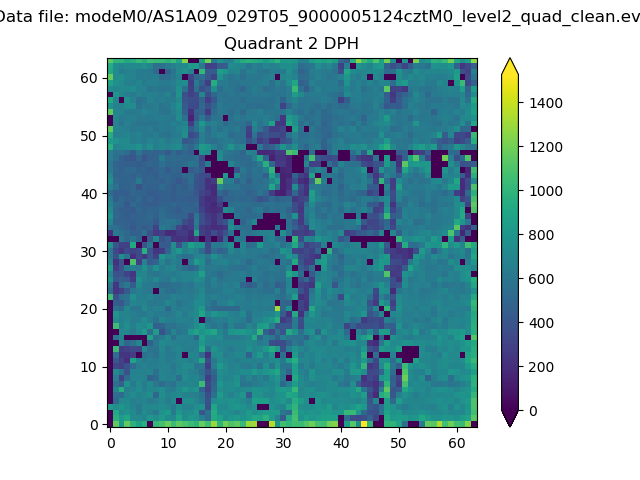
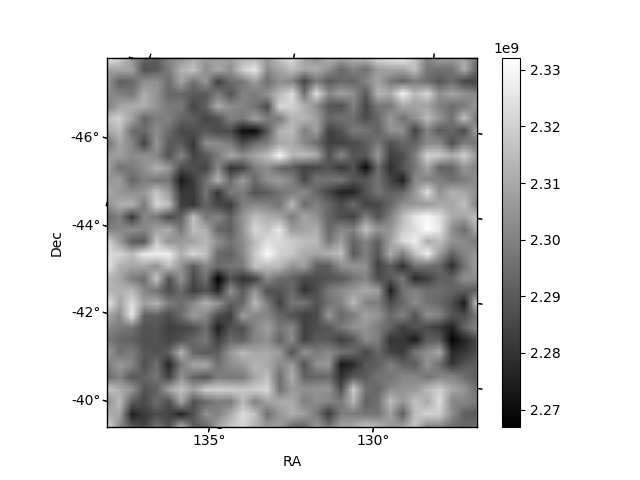
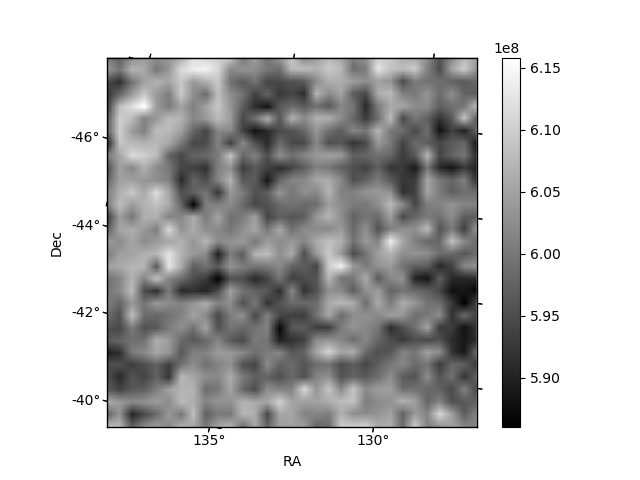
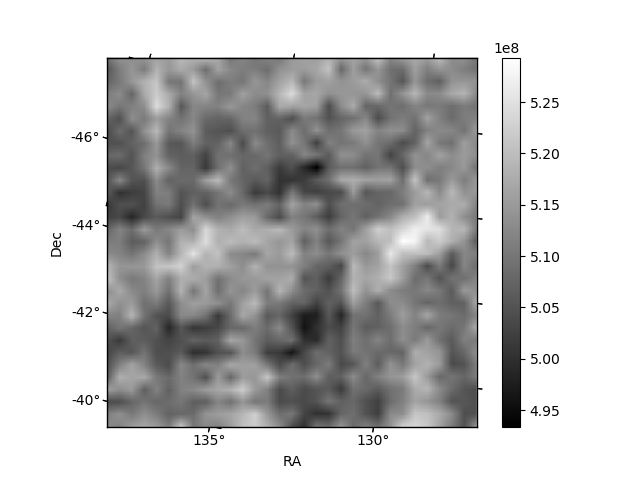
Histogram calculated using DETX and DETY for each event in the final _common_clean file
| Quadrant A | 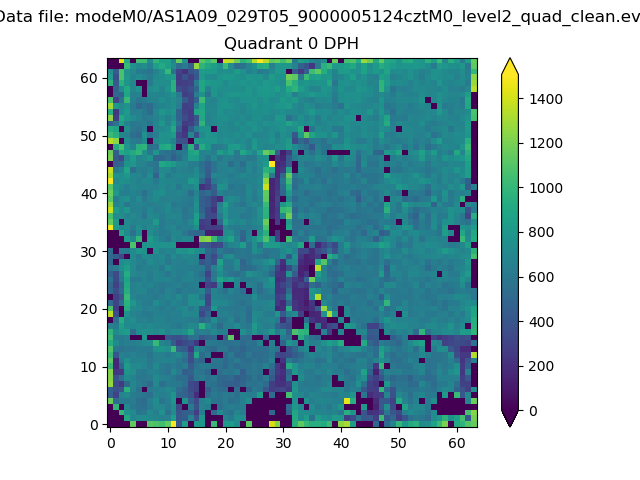 |
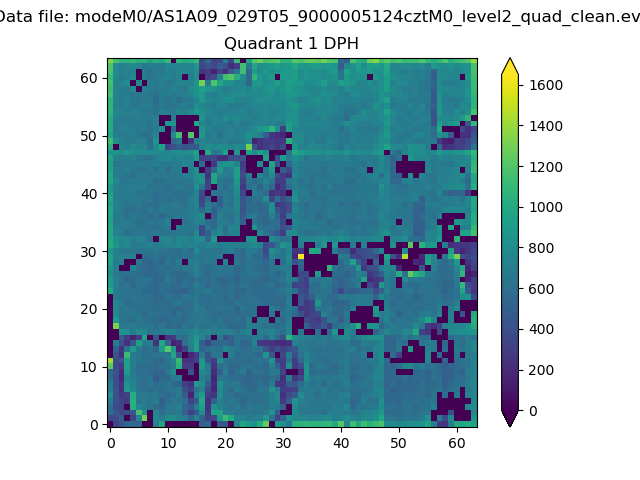 |
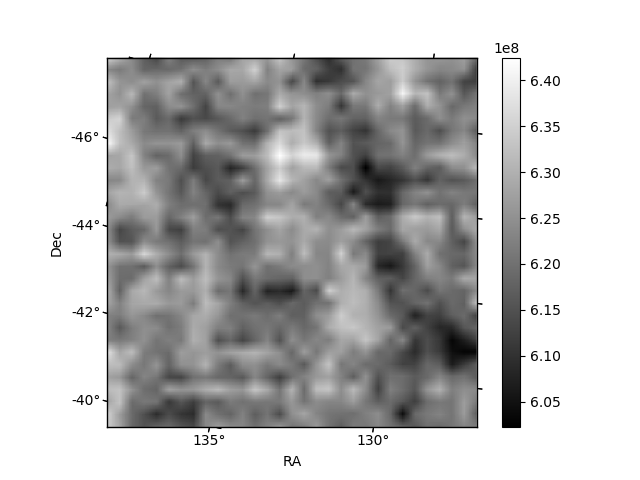
Quadrant B |
|---|---|---|---|
| Quadrant D | 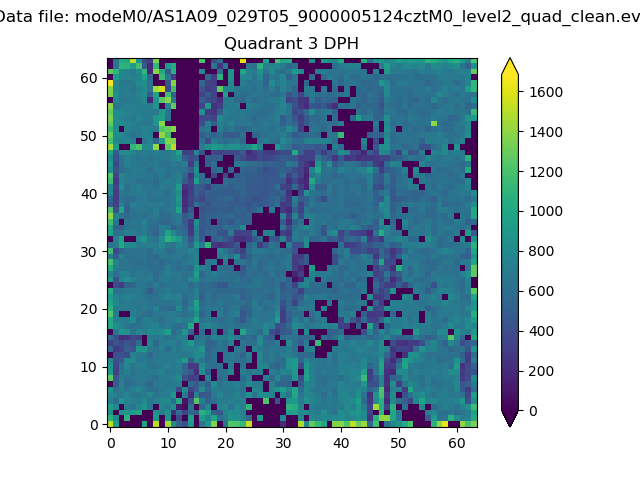 |
 |
Quadrant C |
| Plot type | Count rate plots | Images |
|---|---|---|
| Comparison with Poisson distribution Blue bars denote a histogram of data divided into 1 sec bins. Red curve is a Poisson curve with rate = median count rate of data. |
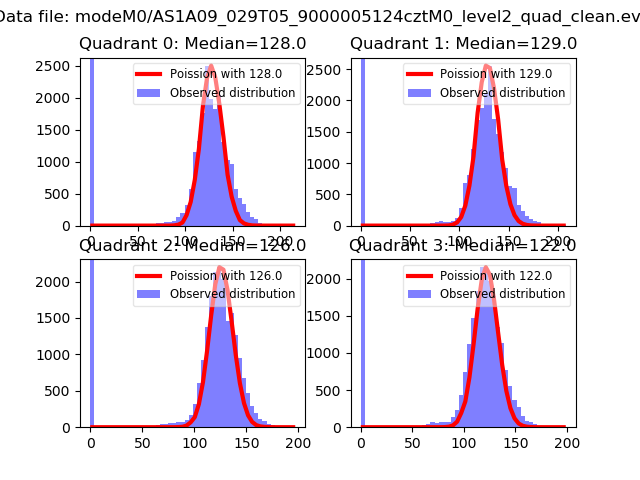 |
 |
| Quadrant-wise count rates Data is divided into 100 sec bins |
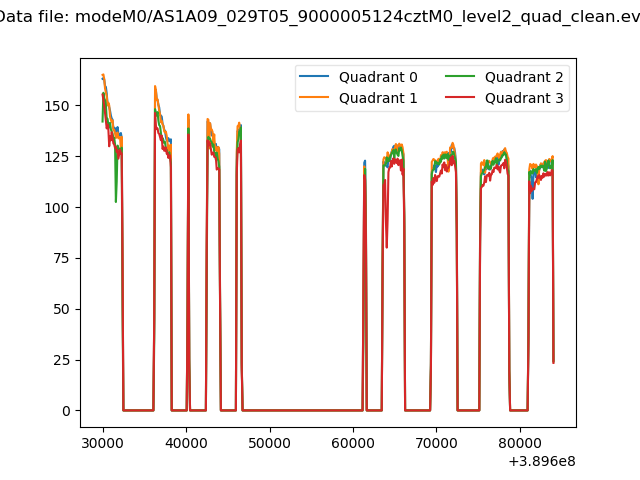 |
|
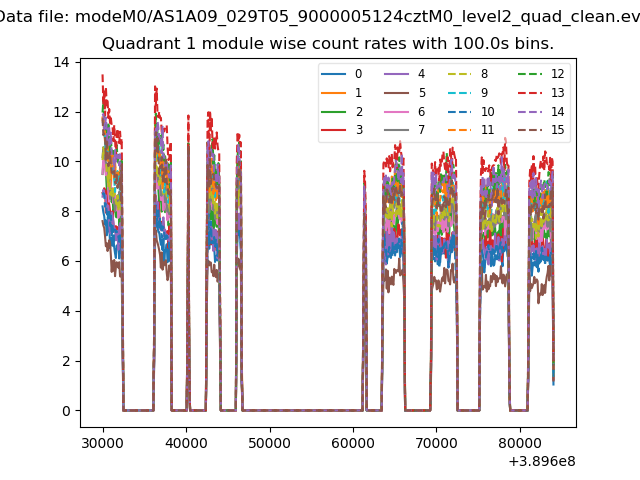
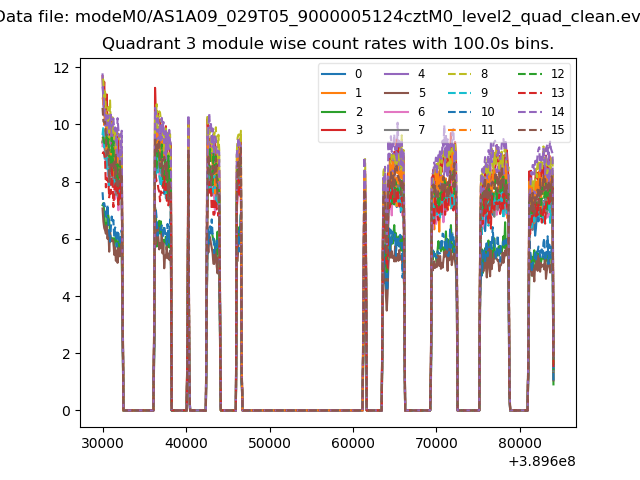
| Module-wise count rates for Quadrant A Data is divided into 100 sec bins |
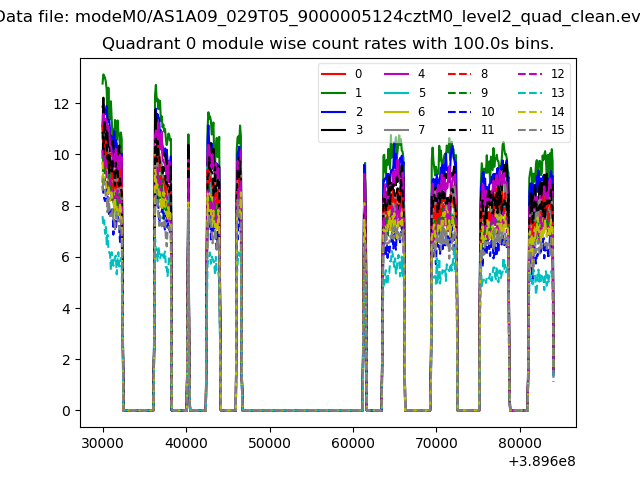 |
 |
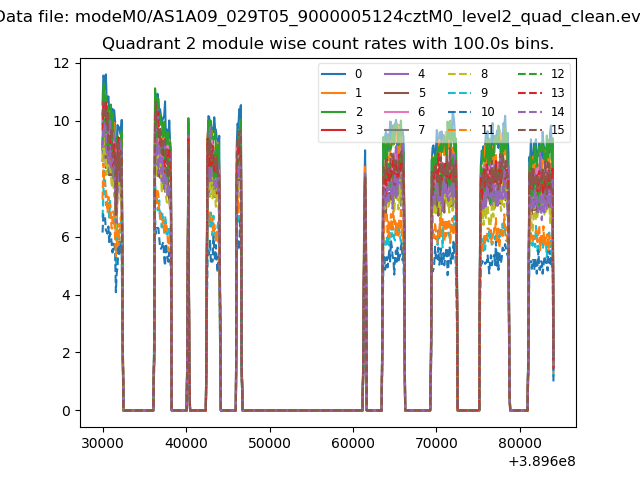
| Module-wise count rates for Quadrant B Data is divided into 100 sec bins |
 |
 |
| Module-wise count rates for Quadrant C Data is divided into 100 sec bins |
 |
 |
| Module-wise count rates for Quadrant D Data is divided into 100 sec bins |
 |
 |
| Parameter | Plot |
|---|---|
| CZT HV Monitor | 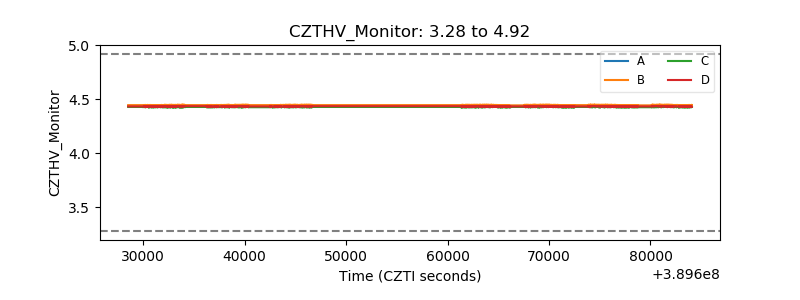 |
| D_VDD | 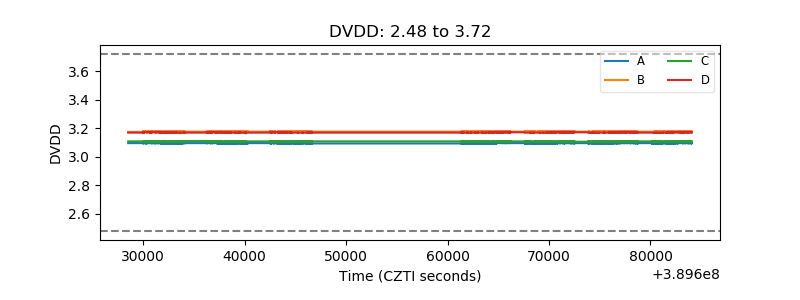 |
| Temperature 1 | 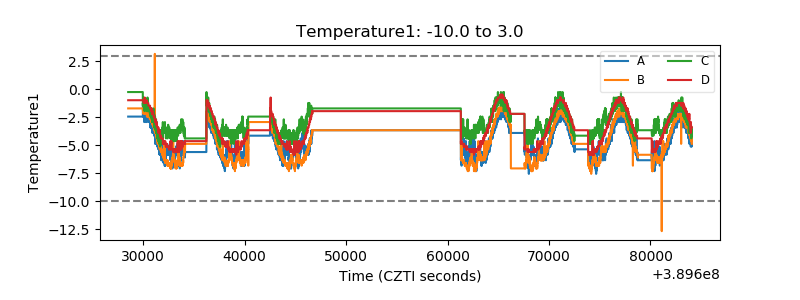 |
| Veto HV Monitor | 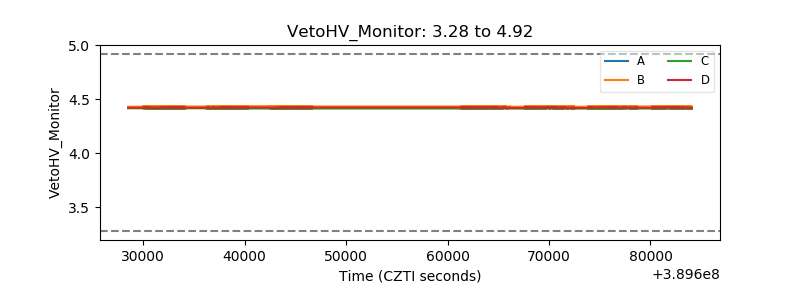 |
| Veto LLD | 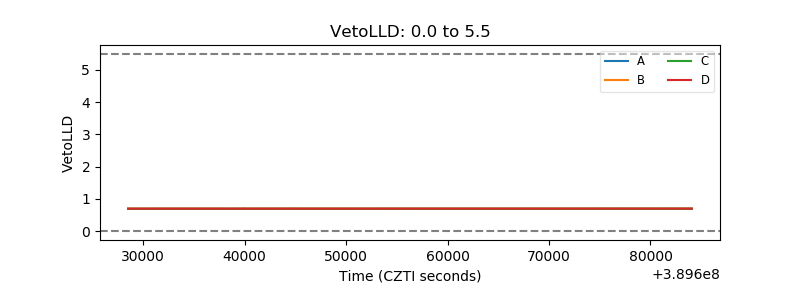 |
| Alpha Counter | 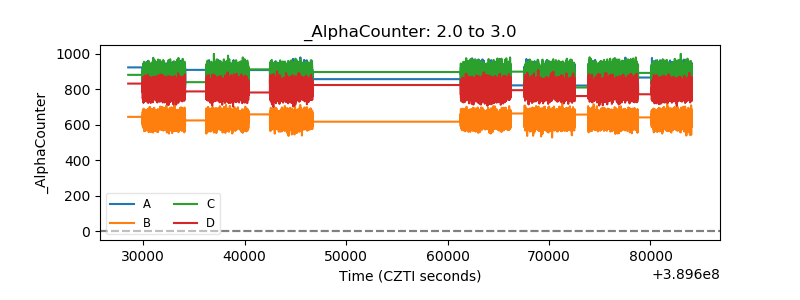 |
| _CPM_Rate | 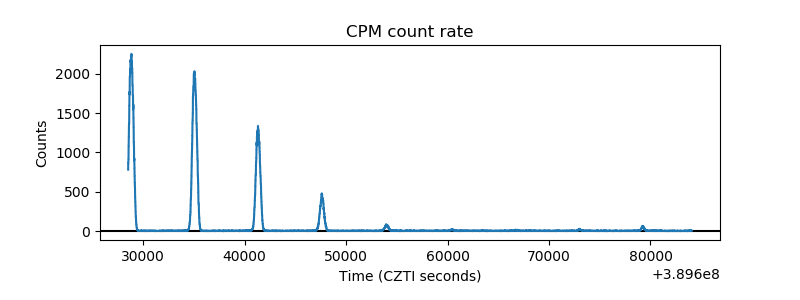 |
| CZT Counter | 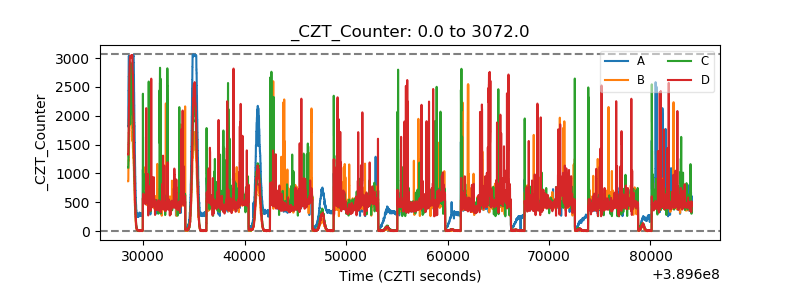 |
| +2.5 Volts monitor | 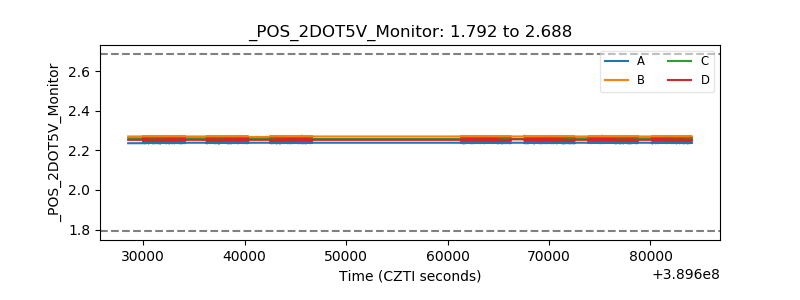 |
| +5 Volts monitor | 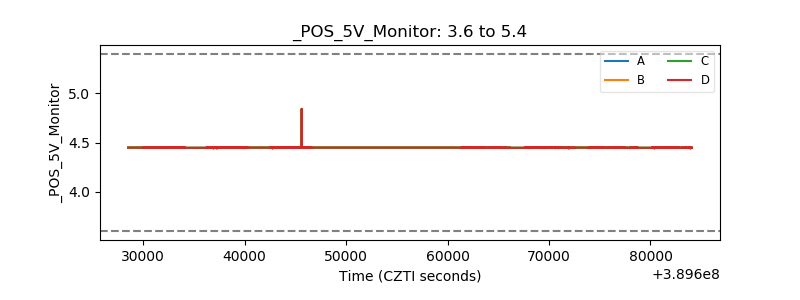 |
| _ROLL_ROT | 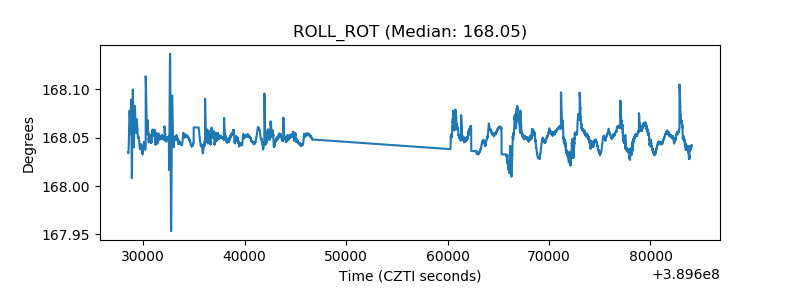 |
| _Roll_DEC | 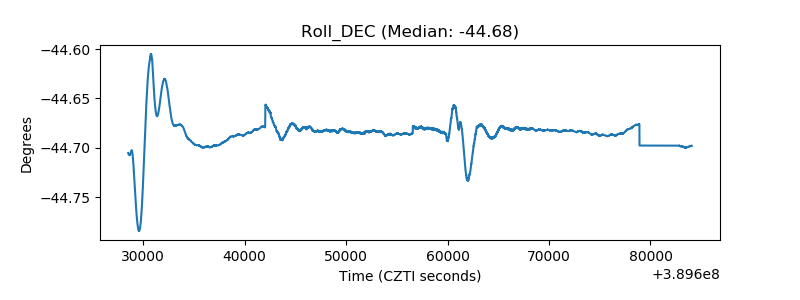 |
| _Roll_RA | 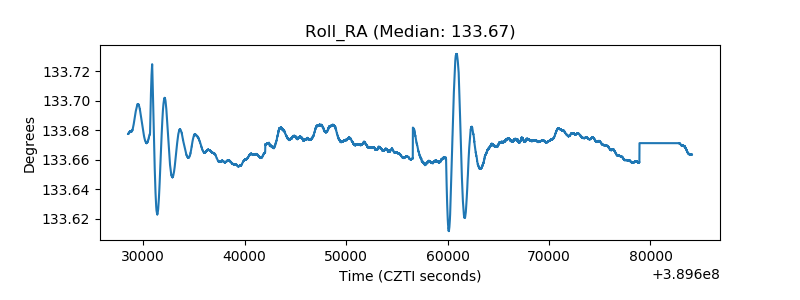 |
| Veto Counter | 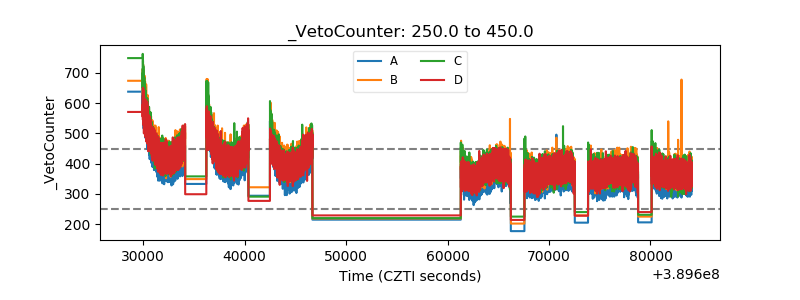 |