| Param | Original file | Final file |
|---|---|---|
| Filename | modeM0/AS1A09_142T05_9000005118_35716cztM0_level2.evt | modeM0/AS1A09_142T05_9000005118_35716cztM0_level2_quad_clean.evt |
| Size (bytes) | 472,550,400 | 66,044,160 |
| Size | 450.7 MB | 63.0 MB |
| Events in quadrant A | 2,751,338 | 405,537 |
| Events in quadrant B | 4,225,812 | 400,209 |
| Events in quadrant C | 4,094,097 | 393,440 |
| Events in quadrant D | 2,841,437 | 390,281 |
| Mode M0 | |||
|---|---|---|---|
| Quadrant | BADHDUFLAG | Total packets | Discarded packets |
| A | 0 | 11972 | 3 |
| B | 0 | 16405 | 2 |
| C | 0 | 15950 | 2 |
| D | 0 | 12704 | 2 |
| Mode SS | |||
|---|---|---|---|
| Quadrant | BADHDUFLAG | Total packets | Discarded packets |
| A | 0 | 120 | 0 |
| B | 0 | 120 | 0 |
| C | 0 | 120 | 0 |
| D | 0 | 120 | 0 |
| Mode M9 | |||
|---|---|---|---|
| Quadrant | BADHDUFLAG | Total packets | Discarded packets |
| A | 0 | 25 | 0 |
| B | 0 | 25 | 0 |
| C | 0 | 25 | 0 |
| D | 0 | 26 | 0 |
| Quadrant | Total seconds | Saturated seconds | Saturation percentage |
|---|---|---|---|
| A | 5866 | 4 | 0.068190% |
| B | 5866 | 501 | 8.540743% |
| C | 5866 | 249 | 4.244801% |
| D | 5866 | 29 | 0.494374% |
Noise dominated data is calculated using 1-second bins in cleaned event files. If a bin has >2000 counts, and if more than 50% of those come from <1% of pixels, then it is considered to be noise-dominated and hence unusable.
| Quadrant | # 1 sec bins | Bins with >0 counts | Bins with >2000 counts | High rate bins dominated by noise | Noise dominated (total time) | Noise dominated (detector-on time) | Marked lightcurve |
|---|---|---|---|---|---|---|---|
| A | 7150 | 5867 | 0 | 0 | 0.00% | 0.00% | 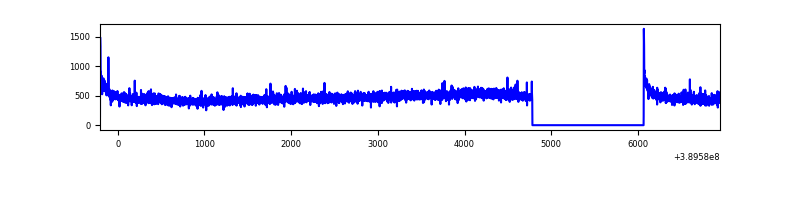 |
| B | 7150 | 5867 | 408 | 408 | 5.71% | 6.95% | 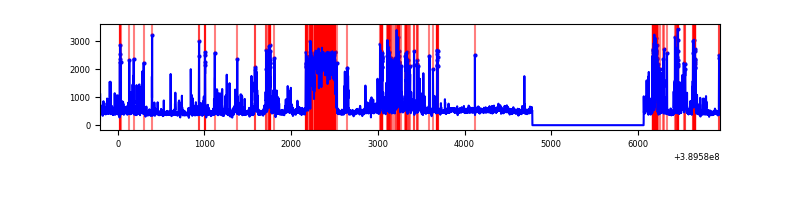 |
| C | 7150 | 5867 | 220 | 220 | 3.08% | 3.75% | 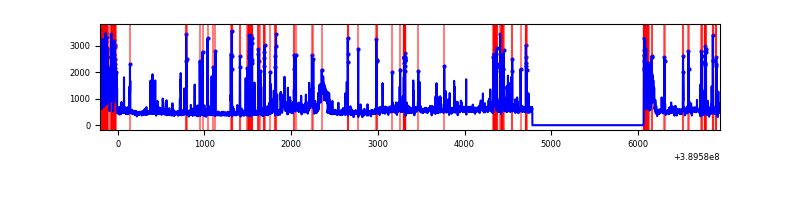 |
| D | 7150 | 5867 | 18 | 18 | 0.25% | 0.31% | 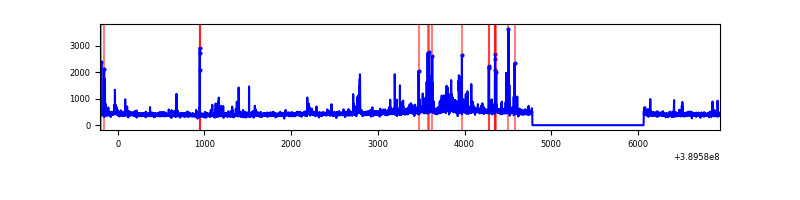 |
Top three noisy pixels from each quadrant. If the there are fewer than three noisy pixels in the level2.evt file, extra rows are filled as -1
| Pixel properties | Quadrant properties | ||||||
|---|---|---|---|---|---|---|---|
| Quadrant | DetID | PixID | Counts | Sigma | Mean | Median | Sigma |
| A | 10 | 83 | 148287 | 1077.94 | 669 | 655 | 137.0 |
| A | 13 | 6 | 9571 | 65.1 | 669 | 655 | 137.0 |
| A | 3 | 137 | 7283 | 48.39 | 669 | 655 | 137.0 |
| B | 5 | 172 | 1478666 | 11795.11 | 646 | 630 | 125.3 |
| B | 5 | 255 | 146048 | 1160.47 | 646 | 630 | 125.3 |
| B | 0 | 189 | 24188 | 188.0 | 646 | 630 | 125.3 |
| C | 0 | 10 | 668138 | 4450.0 | 643 | 647 | 150.0 |
| C | 0 | 207 | 558749 | 3720.73 | 643 | 647 | 150.0 |
| C | 15 | 214 | 244829 | 1627.9 | 643 | 647 | 150.0 |
| D | 2 | 250 | 124628 | 774.12 | 651 | 633 | 160.2 |
| D | 13 | 249 | 116812 | 725.33 | 651 | 633 | 160.2 |
| D | 10 | 118 | 31766 | 194.37 | 651 | 633 | 160.2 |
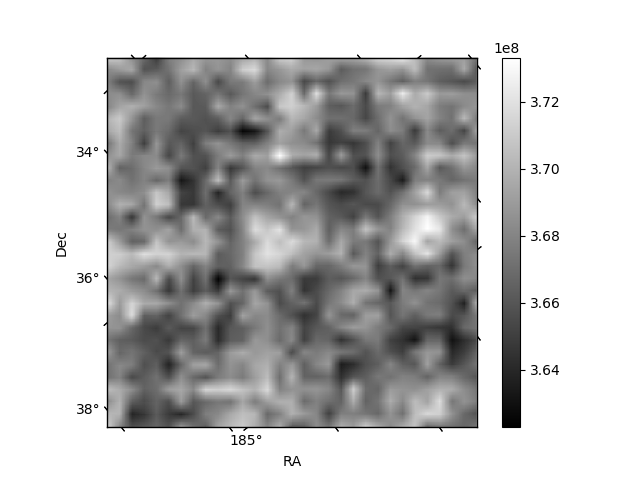
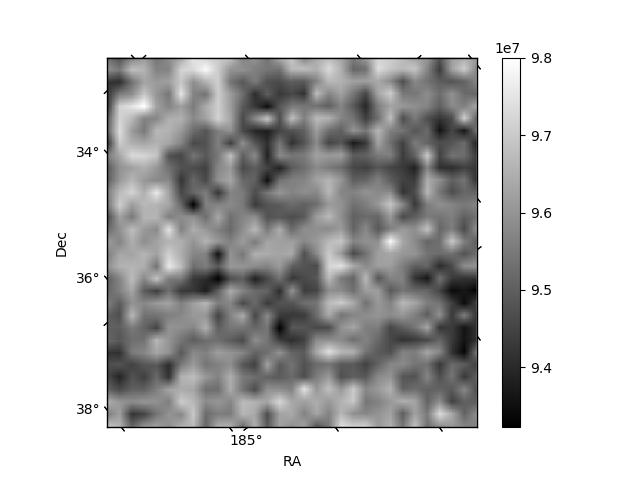
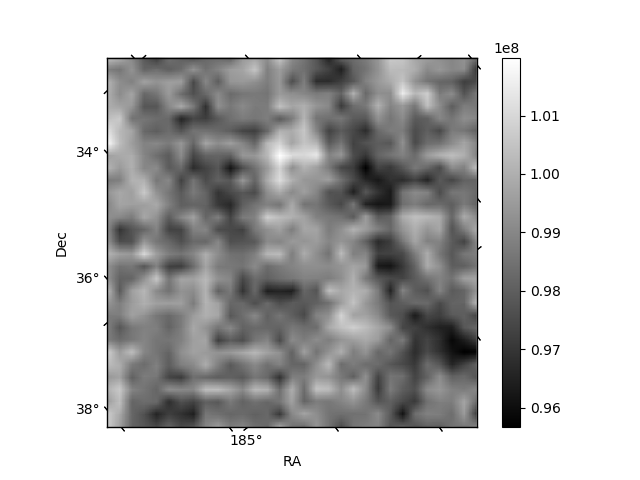
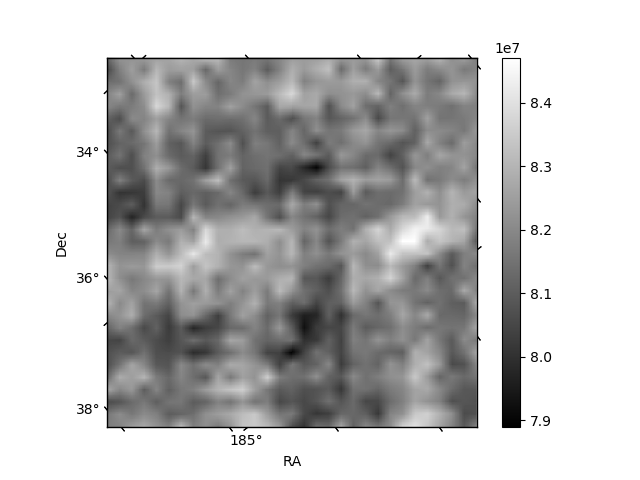
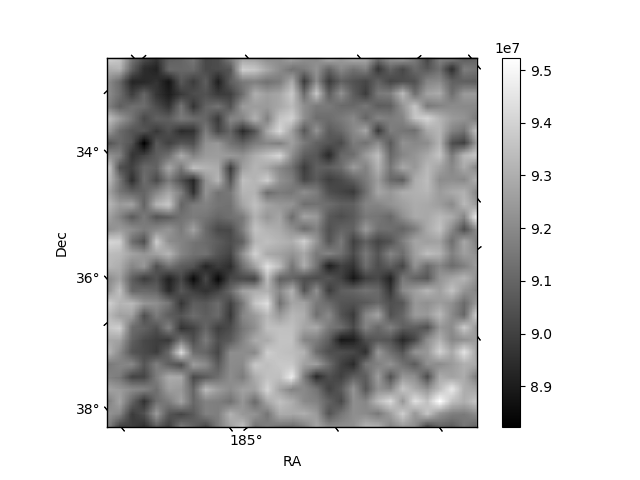
Histogram calculated using DETX and DETY for each event in the final _common_clean file
| Quadrant A | 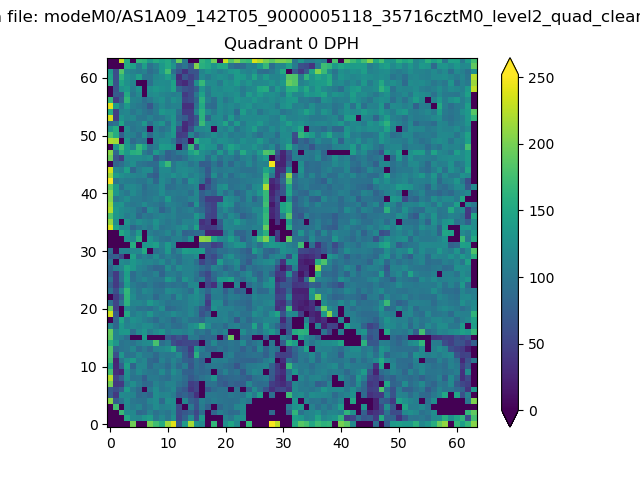 |
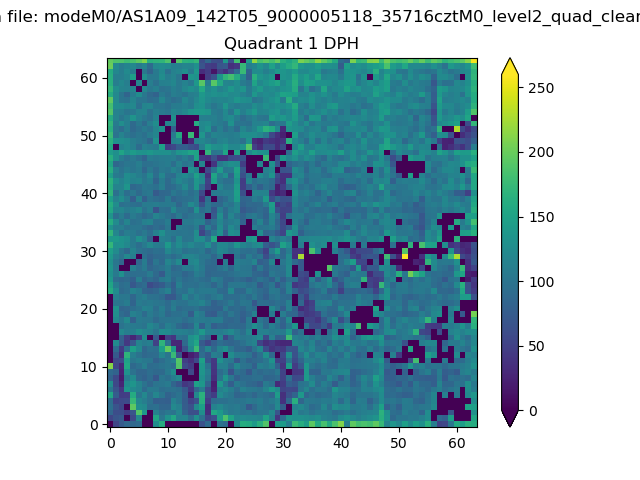 |
Quadrant B |
|---|---|---|---|
| Quadrant D | 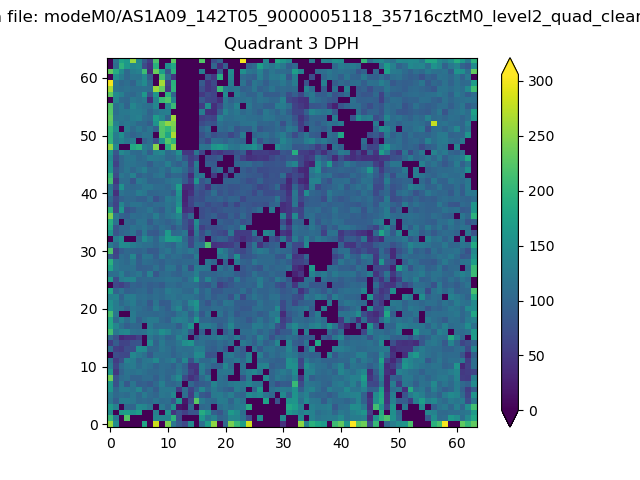 |
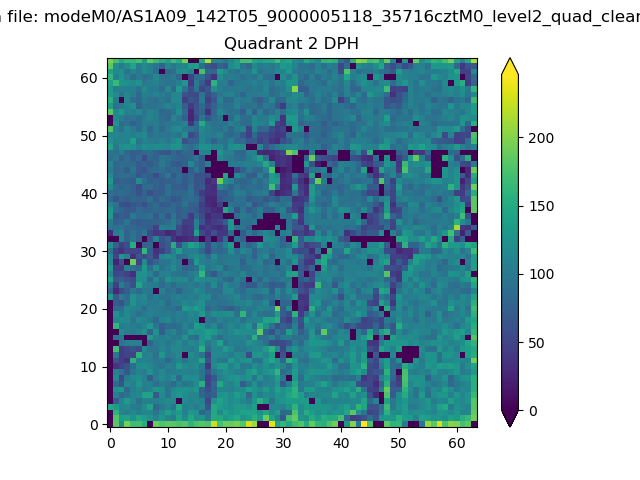 |
Quadrant C |
| Plot type | Count rate plots | Images |
|---|---|---|
| Comparison with Poisson distribution Blue bars denote a histogram of data divided into 1 sec bins. Red curve is a Poisson curve with rate = median count rate of data. |
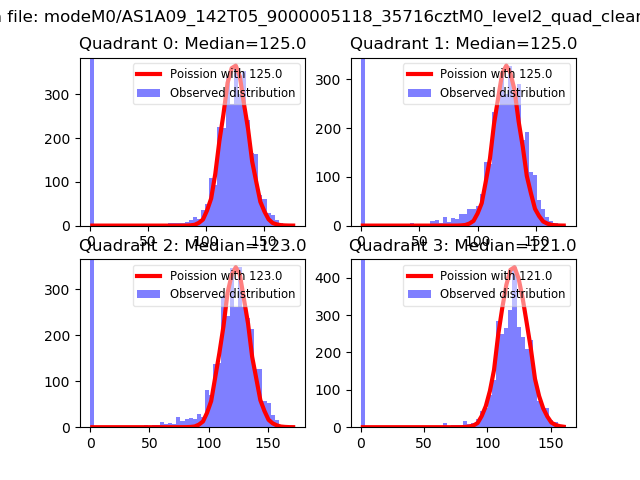 |
 |
| Quadrant-wise count rates Data is divided into 100 sec bins |
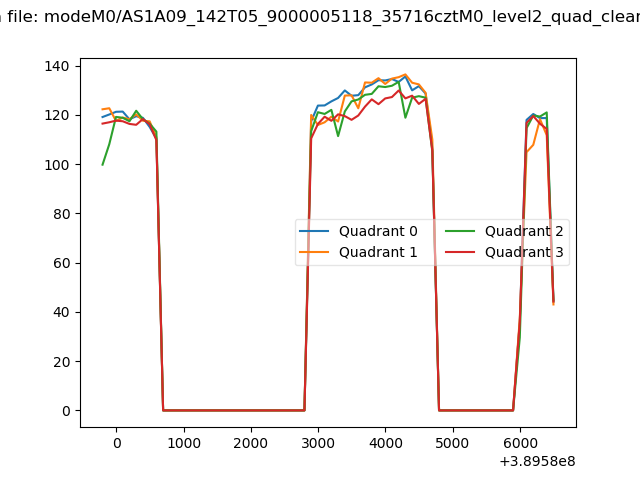 |
|
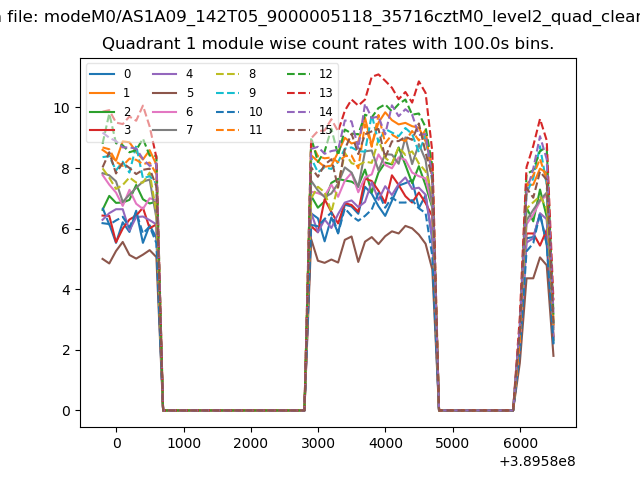
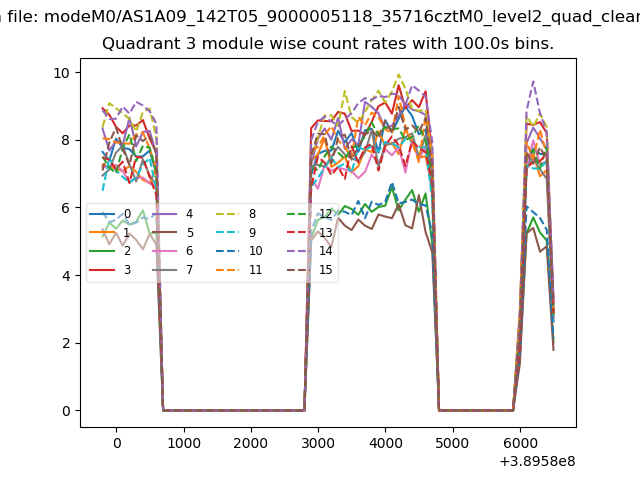
| Module-wise count rates for Quadrant A Data is divided into 100 sec bins |
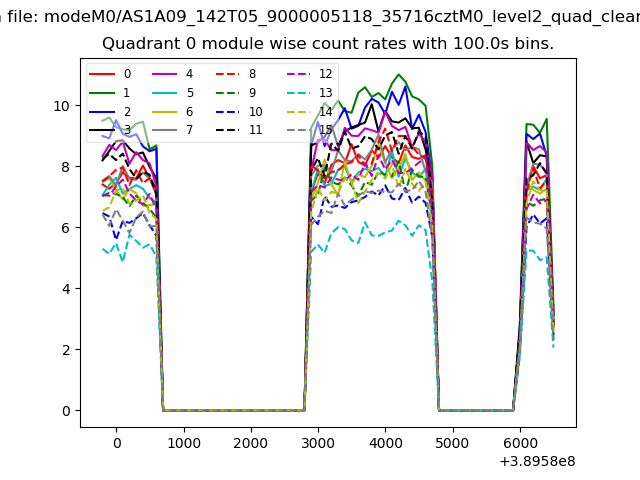 |
 |
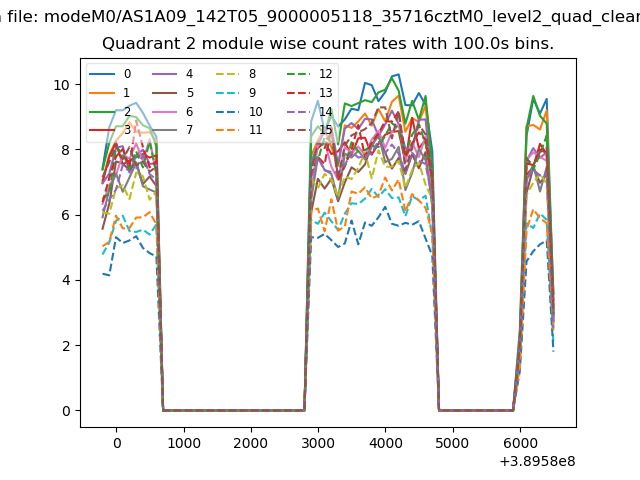
| Module-wise count rates for Quadrant B Data is divided into 100 sec bins |
 |
 |
| Module-wise count rates for Quadrant C Data is divided into 100 sec bins |
 |
 |
| Module-wise count rates for Quadrant D Data is divided into 100 sec bins |
 |
 |
| Parameter | Plot |
|---|---|
| CZT HV Monitor | 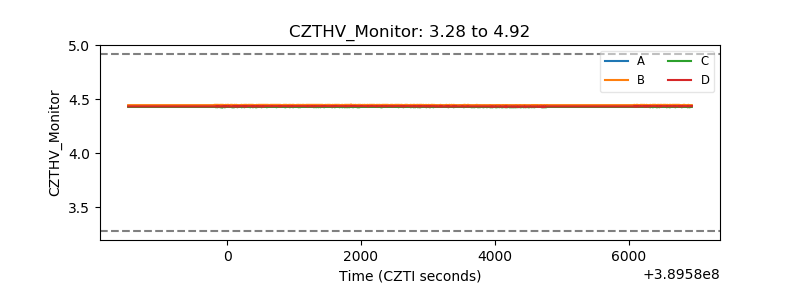 |
| D_VDD | 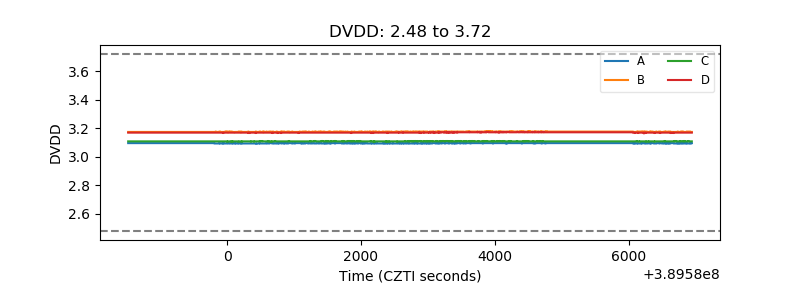 |
| Temperature 1 | 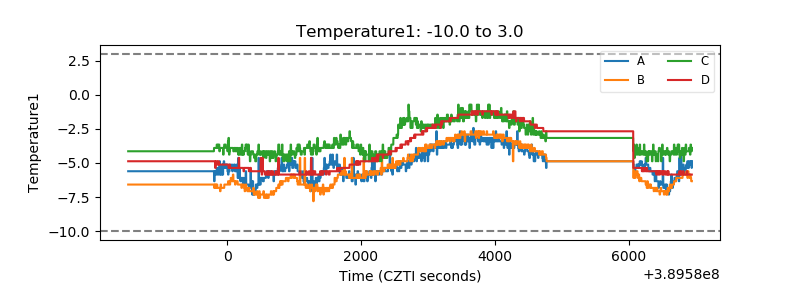 |
| Veto HV Monitor | 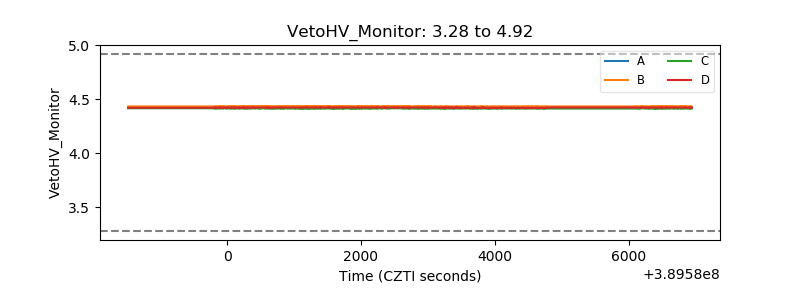 |
| Veto LLD | 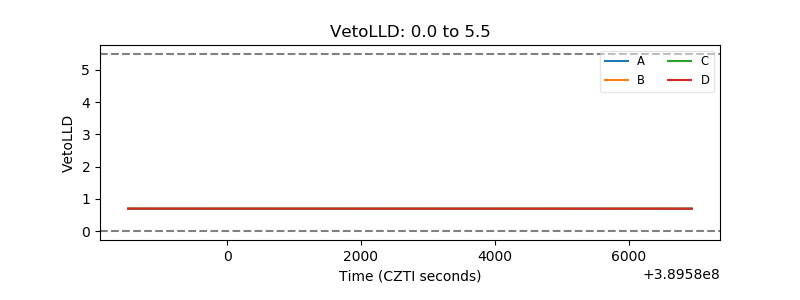 |
| Alpha Counter | 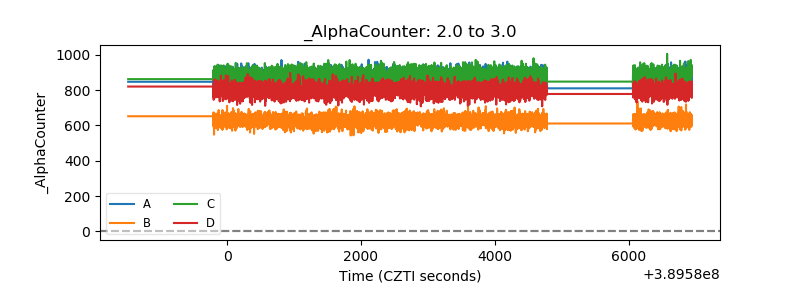 |
| _CPM_Rate | 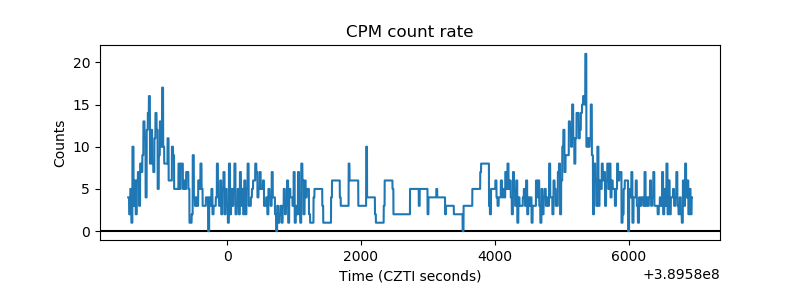 |
| CZT Counter | 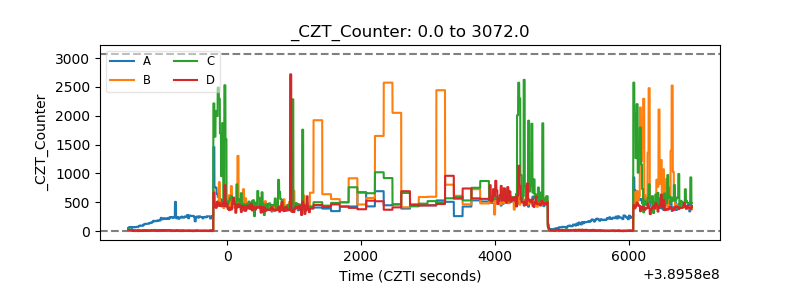 |
| +2.5 Volts monitor | 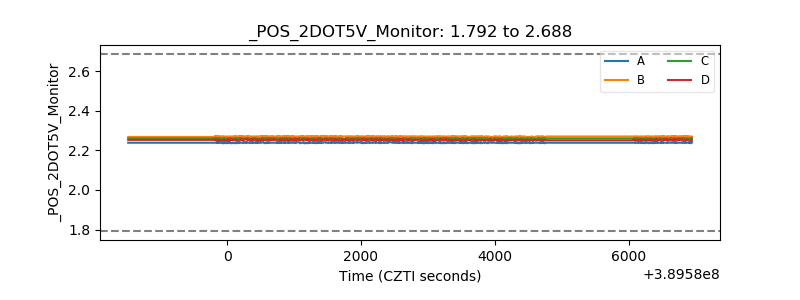 |
| +5 Volts monitor | 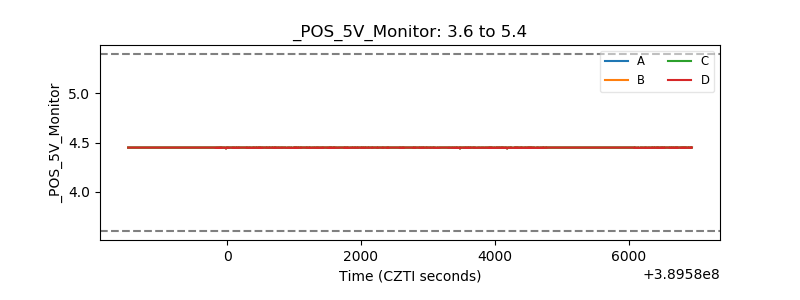 |
| _ROLL_ROT | 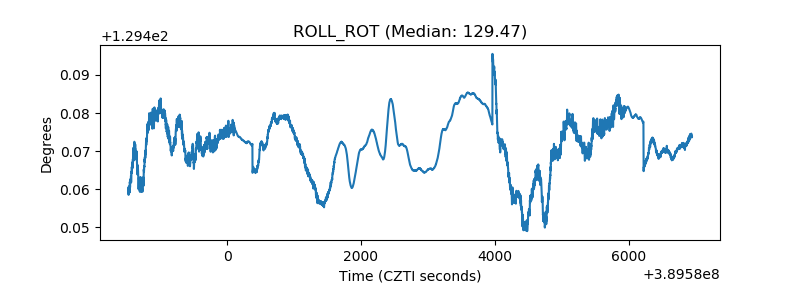 |
| _Roll_DEC | 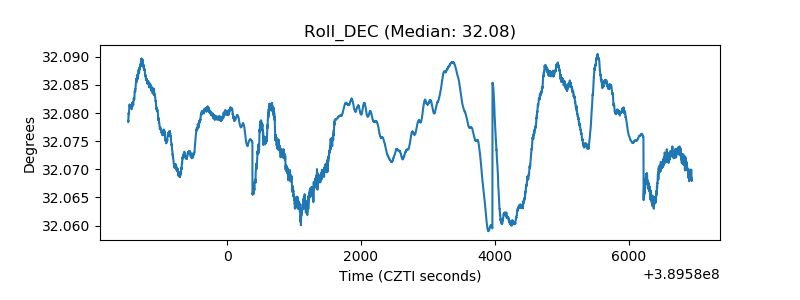 |
| _Roll_RA | 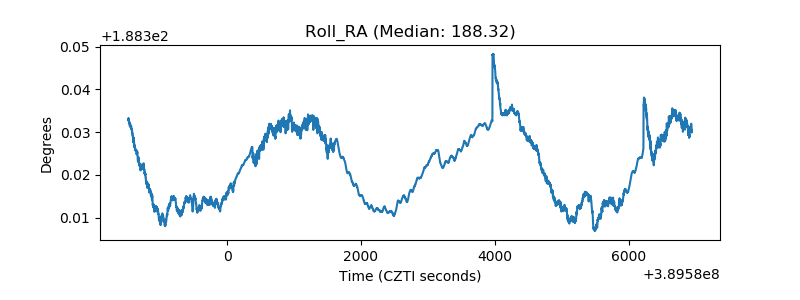 |
| Veto Counter | 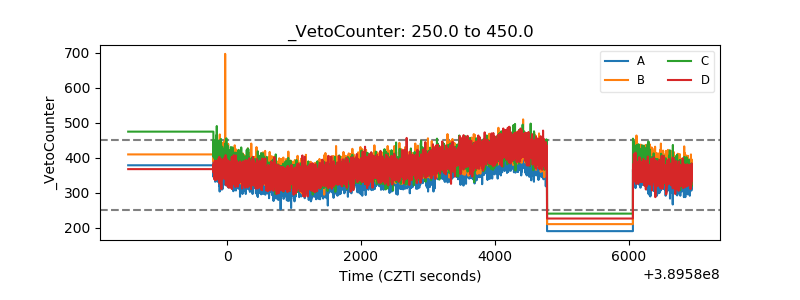 |