| Param | Original file | Final file |
|---|---|---|
| Filename | modeM0/AS1A09_029T01_9000005116_35710cztM0_level2.evt | modeM0/AS1A09_029T01_9000005116_35710cztM0_level2_quad_clean.evt |
| Size (bytes) | 388,045,440 | 76,648,320 |
| Size | 370.1 MB | 73.1 MB |
| Events in quadrant A | 2,569,299 | 508,363 |
| Events in quadrant B | 2,901,111 | 506,477 |
| Events in quadrant C | 2,910,413 | 480,874 |
| Events in quadrant D | 3,023,275 | 466,673 |
| Mode M9 | |||
|---|---|---|---|
| Quadrant | BADHDUFLAG | Total packets | Discarded packets |
| A | 0 | 21 | 0 |
| B | 0 | 21 | 0 |
| C | 0 | 21 | 0 |
| D | 0 | 21 | 0 |
| Mode SS | |||
|---|---|---|---|
| Quadrant | BADHDUFLAG | Total packets | Discarded packets |
| A | 0 | 104 | 0 |
| B | 0 | 104 | 0 |
| C | 0 | 104 | 0 |
| D | 0 | 104 | 0 |
| Mode M0 | |||
|---|---|---|---|
| Quadrant | BADHDUFLAG | Total packets | Discarded packets |
| A | 0 | 10781 | 2 |
| B | 0 | 11751 | 1 |
| C | 0 | 11658 | 1 |
| D | 0 | 12339 | 1 |
| Quadrant | Total seconds | Saturated seconds | Saturation percentage |
|---|---|---|---|
| A | 5118 | 4 | 0.078156% |
| B | 5118 | 103 | 2.012505% |
| C | 5118 | 85 | 1.660805% |
| D | 5118 | 78 | 1.524033% |
Noise dominated data is calculated using 1-second bins in cleaned event files. If a bin has >2000 counts, and if more than 50% of those come from <1% of pixels, then it is considered to be noise-dominated and hence unusable.
| Quadrant | # 1 sec bins | Bins with >0 counts | Bins with >2000 counts | High rate bins dominated by noise | Noise dominated (total time) | Noise dominated (detector-on time) | Marked lightcurve |
|---|---|---|---|---|---|---|---|
| A | 7179 | 5119 | 0 | 0 | 0.00% | 0.00% | 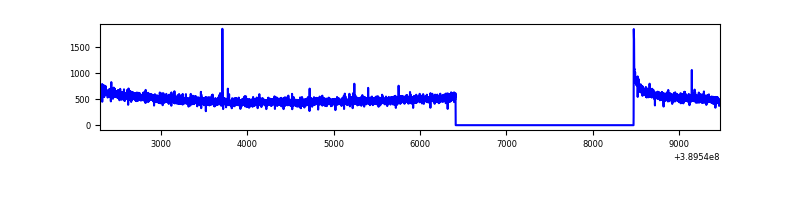 |
| B | 7179 | 5119 | 65 | 65 | 0.91% | 1.27% | 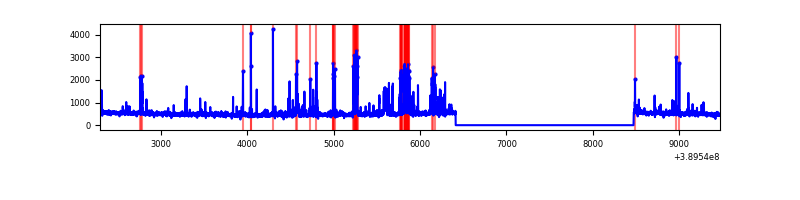 |
| C | 7179 | 5119 | 77 | 77 | 1.07% | 1.50% | 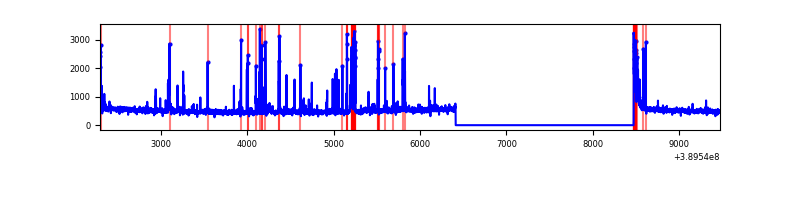 |
| D | 7179 | 5119 | 90 | 90 | 1.25% | 1.76% | 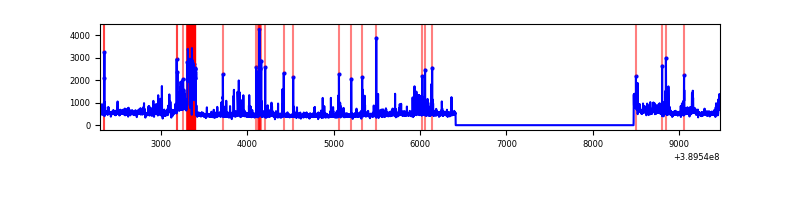 |
Top three noisy pixels from each quadrant. If the there are fewer than three noisy pixels in the level2.evt file, extra rows are filled as -1
| Pixel properties | Quadrant properties | ||||||
|---|---|---|---|---|---|---|---|
| Quadrant | DetID | PixID | Counts | Sigma | Mean | Median | Sigma |
| A | 10 | 83 | 126403 | 992.69 | 628 | 617 | 126.7 |
| A | 13 | 6 | 7111 | 51.25 | 628 | 617 | 126.7 |
| A | 7 | 48 | 6279 | 44.68 | 628 | 617 | 126.7 |
| B | 5 | 172 | 345397 | 2958.88 | 615 | 601 | 116.5 |
| B | 5 | 255 | 66587 | 566.26 | 615 | 601 | 116.5 |
| B | 15 | 85 | 26605 | 223.15 | 615 | 601 | 116.5 |
| C | 0 | 10 | 251943 | 1852.01 | 586 | 591 | 135.7 |
| C | 15 | 214 | 214893 | 1579.02 | 586 | 591 | 135.7 |
| C | 9 | 187 | 143515 | 1053.09 | 586 | 591 | 135.7 |
| D | 7 | 223 | 245289 | 1703.56 | 593 | 579 | 143.6 |
| D | 1 | 52 | 122782 | 850.72 | 593 | 579 | 143.6 |
| D | 2 | 153 | 101288 | 701.09 | 593 | 579 | 143.6 |
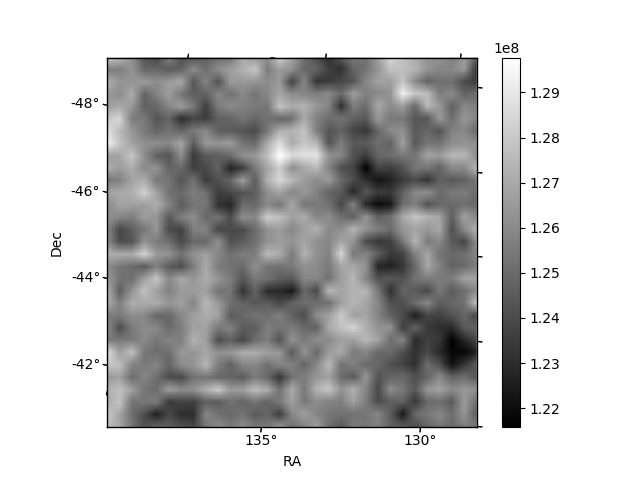
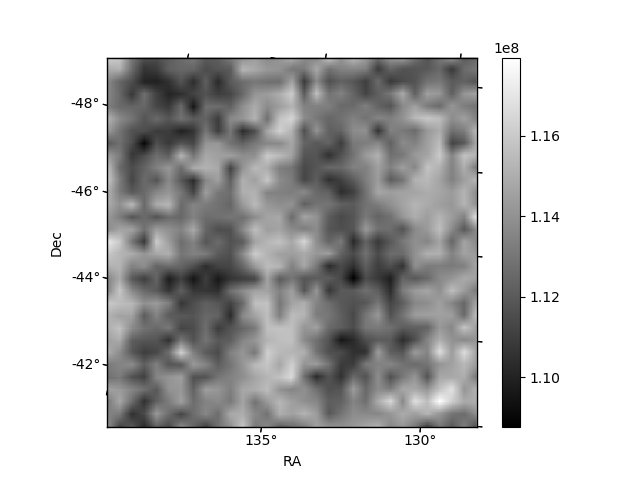
Histogram calculated using DETX and DETY for each event in the final _common_clean file
| Quadrant A | 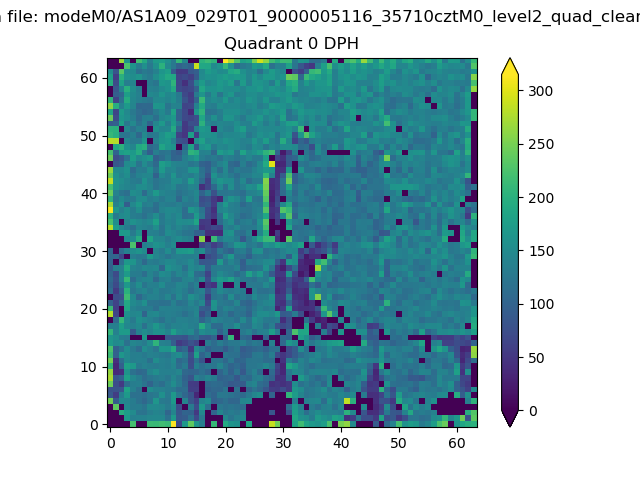 |
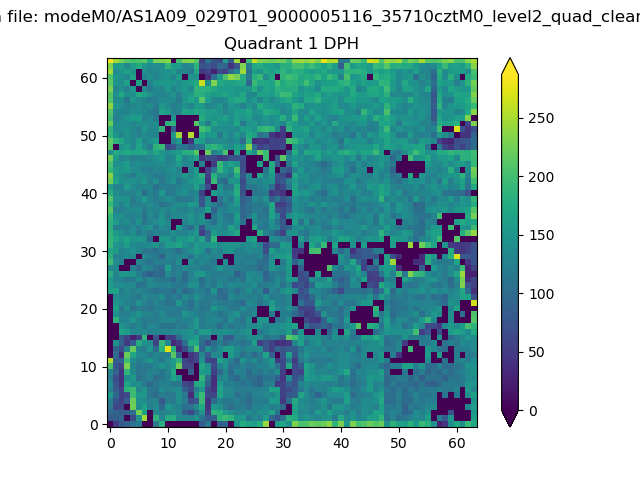 |
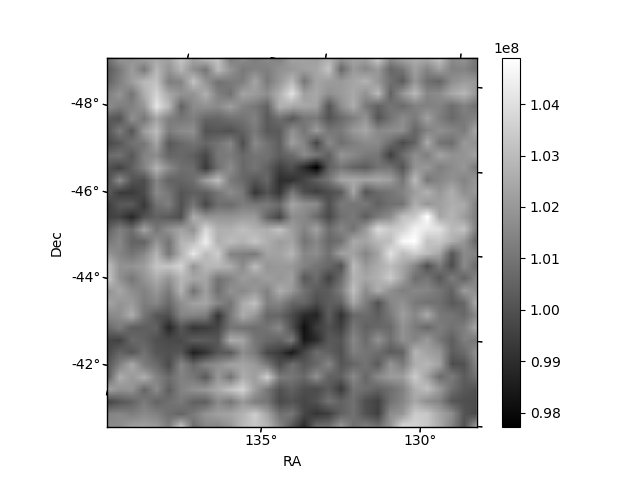
Quadrant B |
|---|---|---|---|
| Quadrant D | 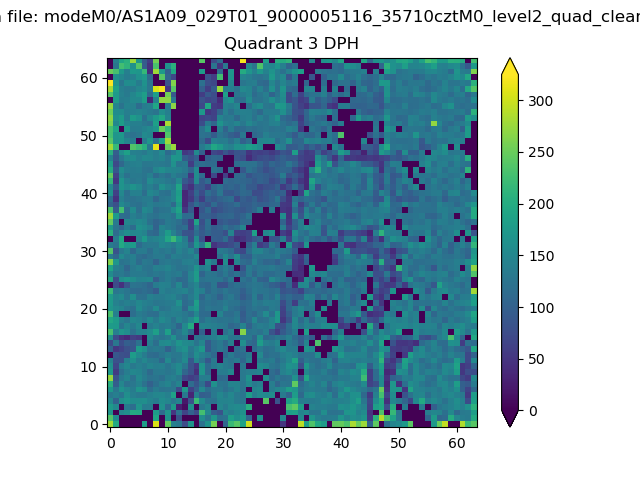 |
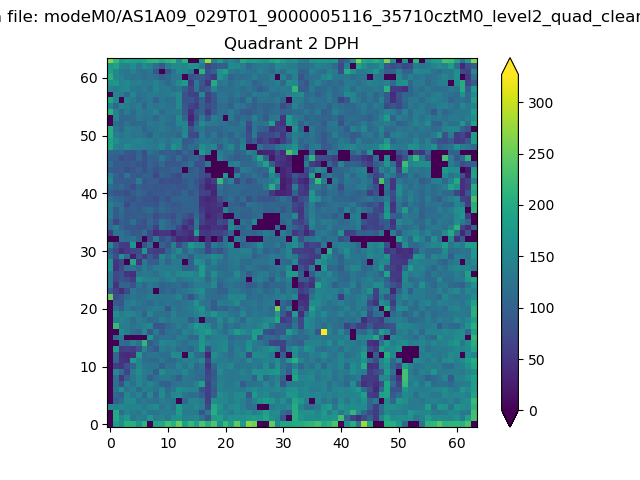 |
Quadrant C |
| Plot type | Count rate plots | Images |
|---|---|---|
| Comparison with Poisson distribution Blue bars denote a histogram of data divided into 1 sec bins. Red curve is a Poisson curve with rate = median count rate of data. |
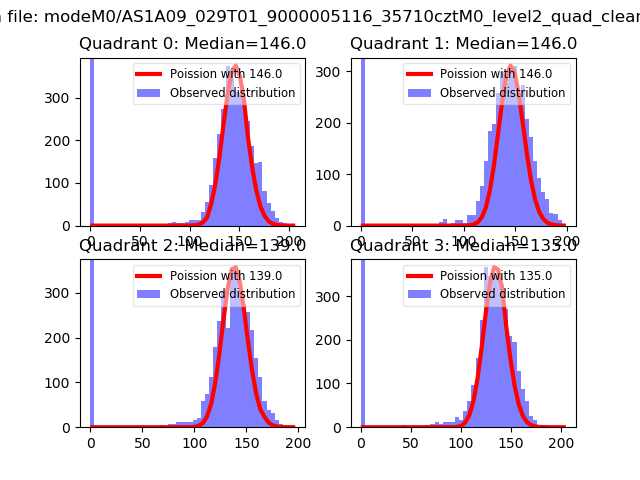 |
 |
| Quadrant-wise count rates Data is divided into 100 sec bins |
 |
|
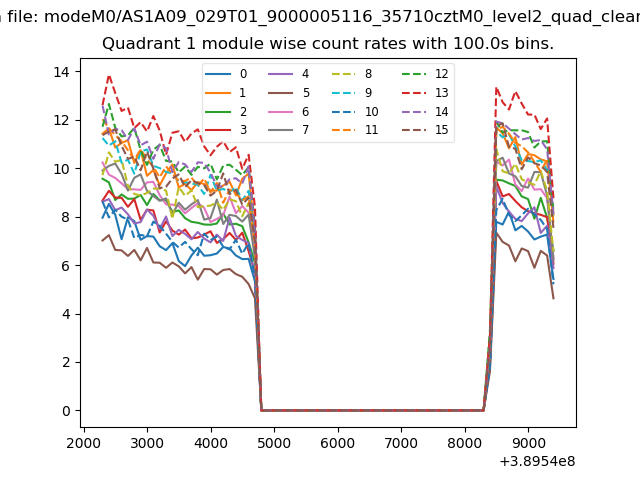
| Module-wise count rates for Quadrant A Data is divided into 100 sec bins |
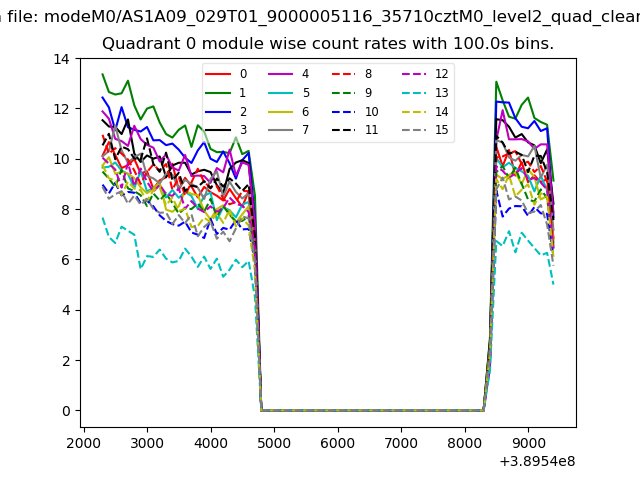 |
 |
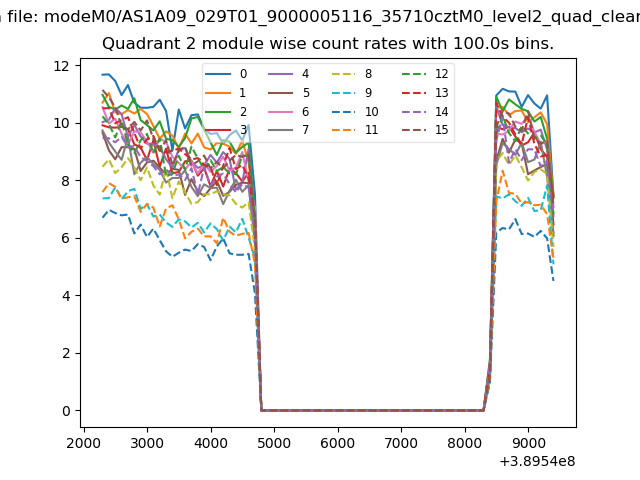
| Module-wise count rates for Quadrant B Data is divided into 100 sec bins |
 |
 |
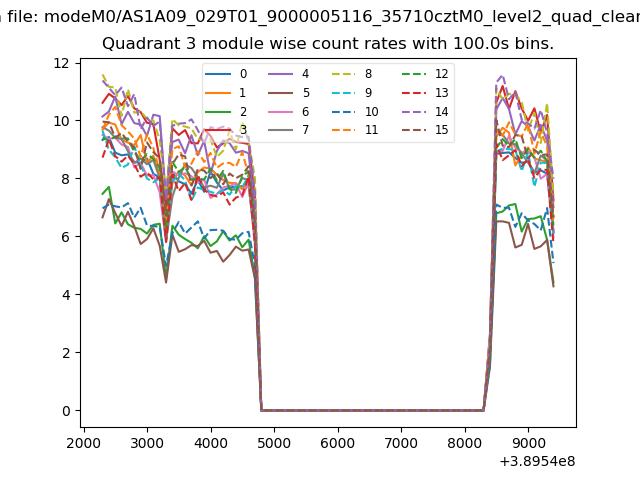
| Module-wise count rates for Quadrant C Data is divided into 100 sec bins |
 |
 |
| Module-wise count rates for Quadrant D Data is divided into 100 sec bins |
 |
 |
| Parameter | Plot |
|---|---|
| CZT HV Monitor | 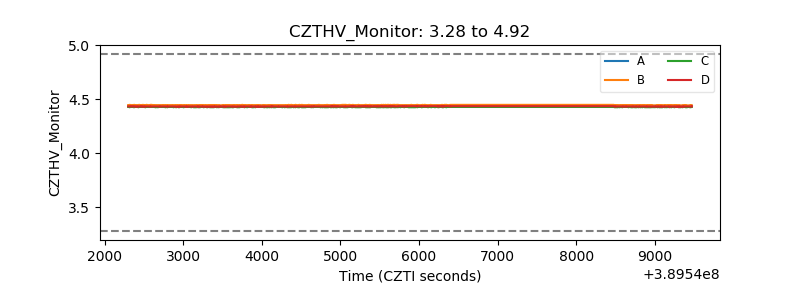 |
| D_VDD | 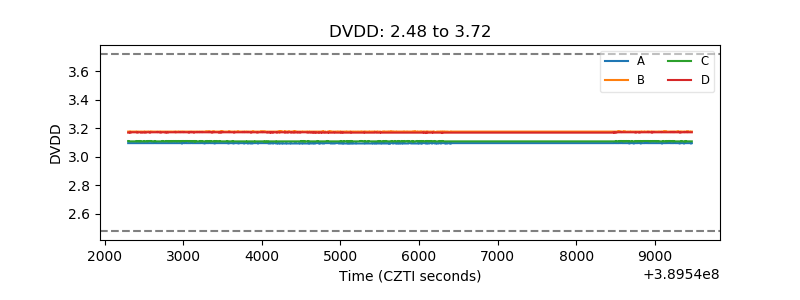 |
| Temperature 1 | 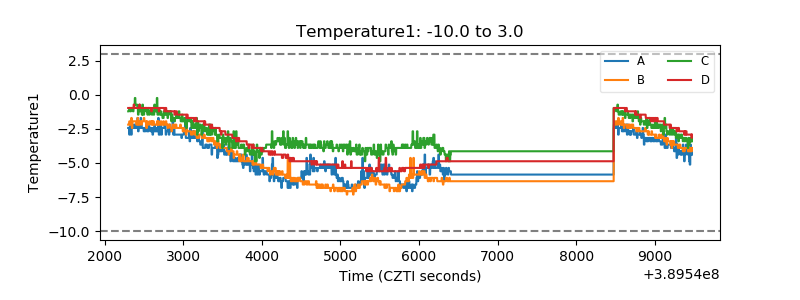 |
| Veto HV Monitor | 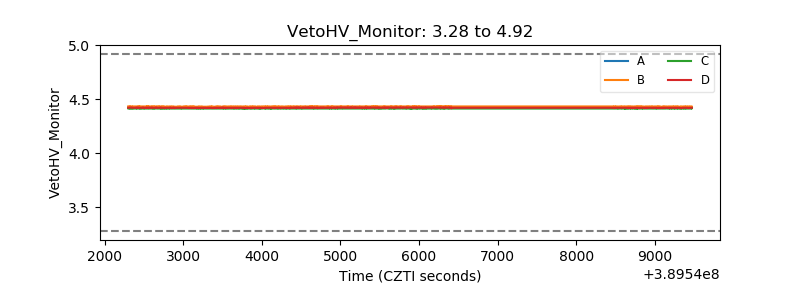 |
| Veto LLD | 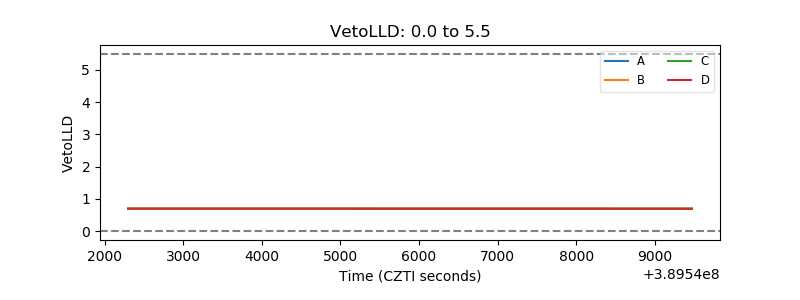 |
| Alpha Counter | 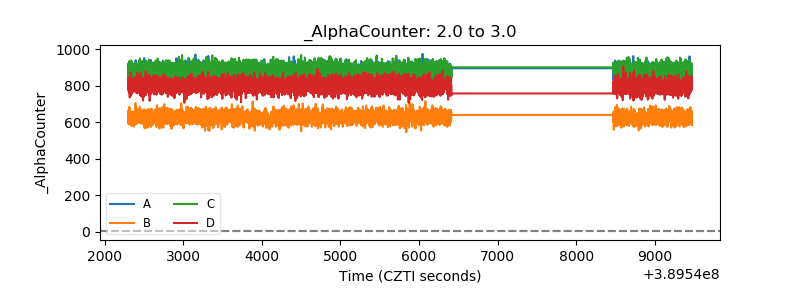 |
| _CPM_Rate | 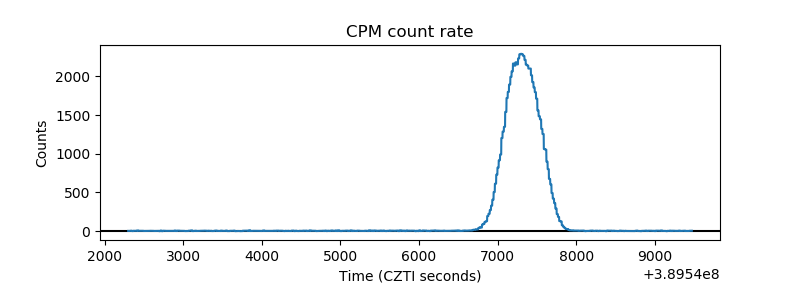 |
| CZT Counter | 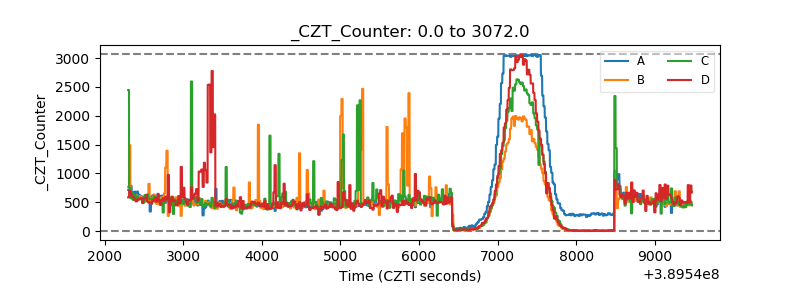 |
| +2.5 Volts monitor | 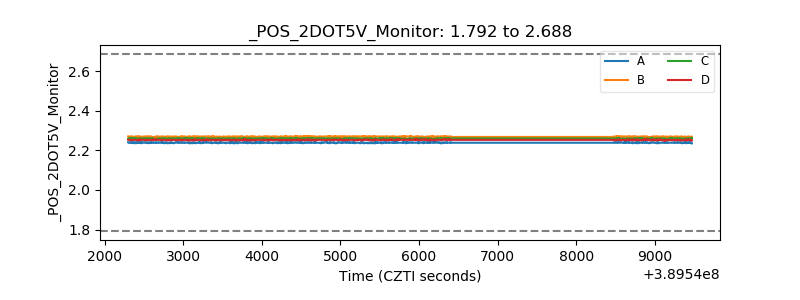 |
| +5 Volts monitor | 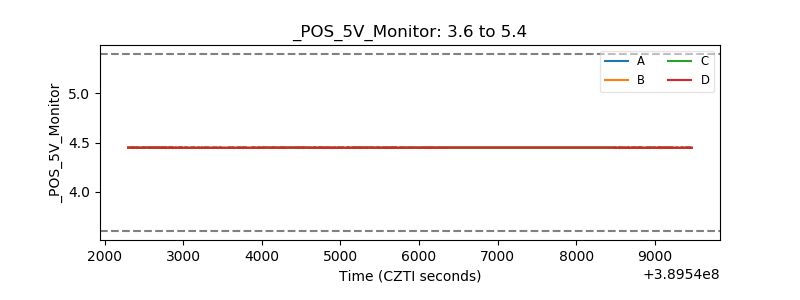 |
| _ROLL_ROT | 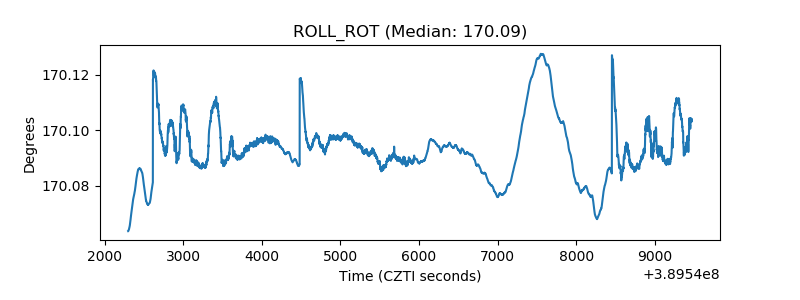 |
| _Roll_DEC | 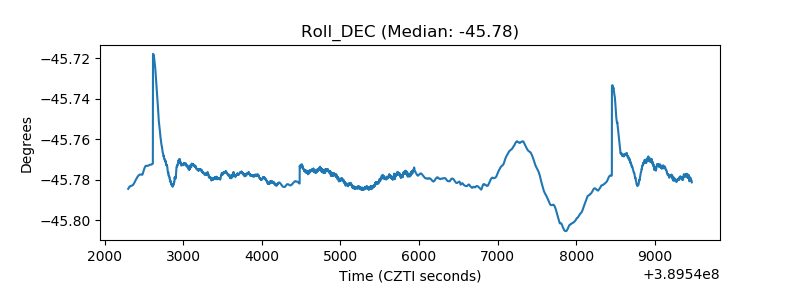 |
| _Roll_RA | 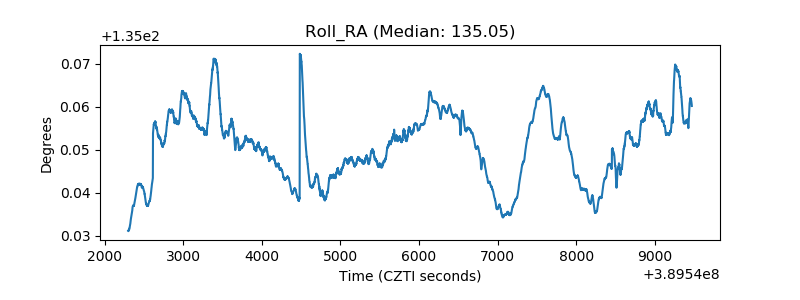 |
| Veto Counter | 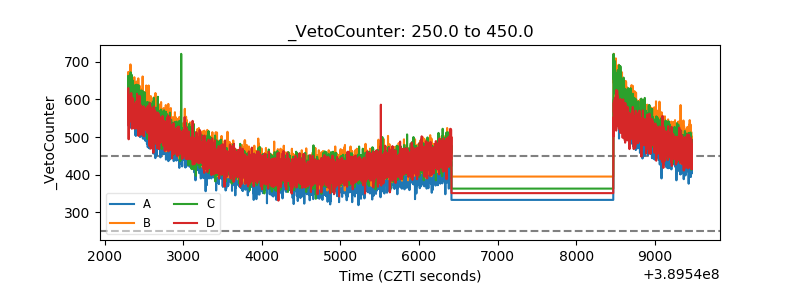 |