| Param | Original file | Final file |
|---|---|---|
| Filename | modeM0/AS1A09_029T01_9000005116cztM0_level2_bc.evt | modeM0/AS1A09_029T01_9000005116cztM0_level2_quad_clean.evt |
| Size (bytes) | 940,521,600 | 335,917,440 |
| Size | 897.0 MB | 320.4 MB |
| Events in quadrant A | 5,427,187 | 2,208,218 |
| Events in quadrant B | 7,269,135 | 2,194,572 |
| Events in quadrant C | 7,078,658 | 2,123,255 |
| Events in quadrant D | 7,133,001 | 2,061,488 |
| Mode M9 | |||
|---|---|---|---|
| Quadrant | BADHDUFLAG | Total packets | Discarded packets |
| A | 0 | 105 | 0 |
| B | 0 | 105 | 0 |
| C | 0 | 105 | 0 |
| D | 0 | 105 | 0 |
| Mode SS | |||
|---|---|---|---|
| Quadrant | BADHDUFLAG | Total packets | Discarded packets |
| A | 0 | 470 | 0 |
| B | 0 | 470 | 0 |
| C | 0 | 470 | 0 |
| D | 0 | 470 | 0 |
| Mode M0 | |||
|---|---|---|---|
| Quadrant | BADHDUFLAG | Total packets | Discarded packets |
| A | 0 | 48047 | 0 |
| B | 0 | 56632 | 0 |
| C | 0 | 52814 | 0 |
| D | 0 | 53987 | 0 |
| Quadrant | Total seconds | Saturated seconds | Saturation percentage |
|---|---|---|---|
| A | 23070 | 37 | 0.160381% |
| B | 23070 | 933 | 4.044213% |
| C | 23070 | 474 | 2.054616% |
| D | 23070 | 375 | 1.625488% |
Noise dominated data is calculated using 1-second bins in cleaned event files. If a bin has >2000 counts, and if more than 50% of those come from <1% of pixels, then it is considered to be noise-dominated and hence unusable.
| Quadrant | # 1 sec bins | Bins with >0 counts | Bins with >2000 counts | High rate bins dominated by noise | Noise dominated (total time) | Noise dominated (detector-on time) | Marked lightcurve |
|---|---|---|---|---|---|---|---|
| A | 32691 | 23075 | 2 | 2 | 0.01% | 0.01% | 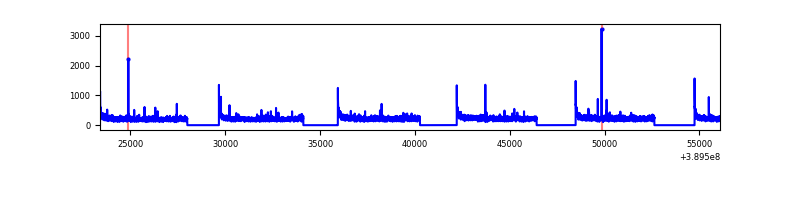 |
| B | 32690 | 23068 | 67 | 67 | 0.20% | 0.29% | 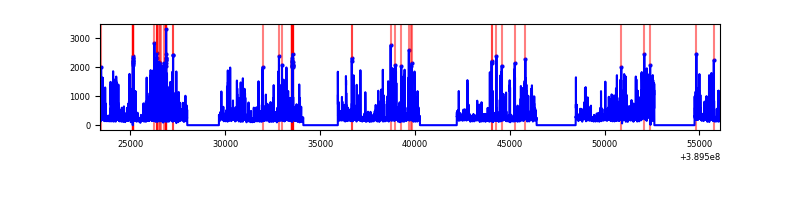 |
| C | 32690 | 23069 | 111 | 111 | 0.34% | 0.48% | 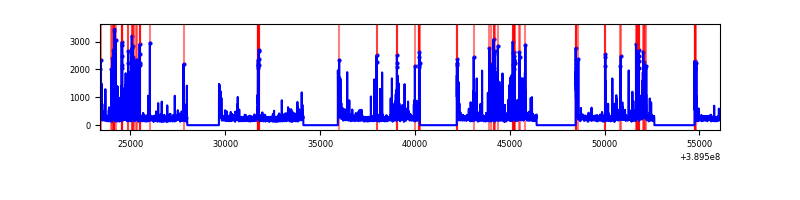 |
| D | 32690 | 23069 | 85 | 85 | 0.26% | 0.37% | 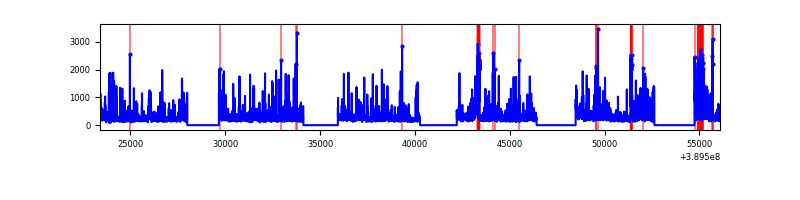 |
Top three noisy pixels from each quadrant. If the there are fewer than three noisy pixels in the level2.evt file, extra rows are filled as -1
| Pixel properties | Quadrant properties | ||||||
|---|---|---|---|---|---|---|---|
| Quadrant | DetID | PixID | Counts | Sigma | Mean | Median | Sigma |
| A | 10 | 83 | 524946 | 1900.64 | 1241 | 1225 | 275.6 |
| A | 7 | 48 | 31401 | 109.51 | 1241 | 1225 | 275.6 |
| A | 13 | 6 | 24301 | 83.75 | 1241 | 1225 | 275.6 |
| B | 5 | 172 | 1847859 | 7644.52 | 1213 | 1187 | 241.6 |
| B | 5 | 255 | 278603 | 1148.4 | 1213 | 1187 | 241.6 |
| B | 0 | 189 | 239483 | 986.45 | 1213 | 1187 | 241.6 |
| C | 0 | 10 | 1014866 | 3785.86 | 1170 | 1161 | 267.8 |
| C | 15 | 214 | 911665 | 3400.43 | 1170 | 1161 | 267.8 |
| C | 9 | 187 | 434330 | 1617.74 | 1170 | 1161 | 267.8 |
| D | 1 | 52 | 547542 | 1923.75 | 1200 | 1165 | 284.0 |
| D | 12 | 6 | 370458 | 1300.25 | 1200 | 1165 | 284.0 |
| D | 13 | 249 | 332520 | 1166.67 | 1200 | 1165 | 284.0 |
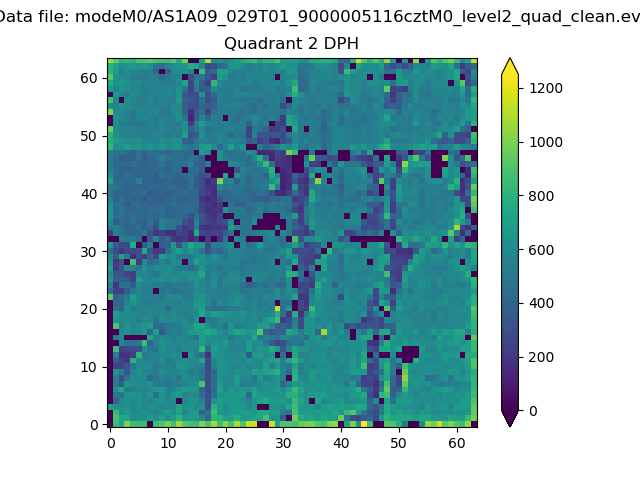
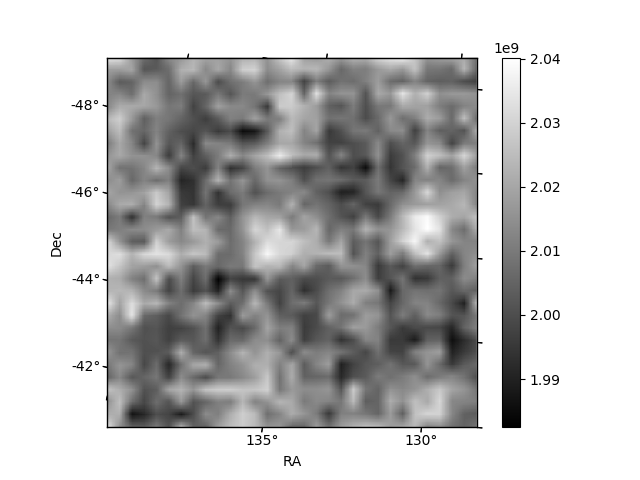
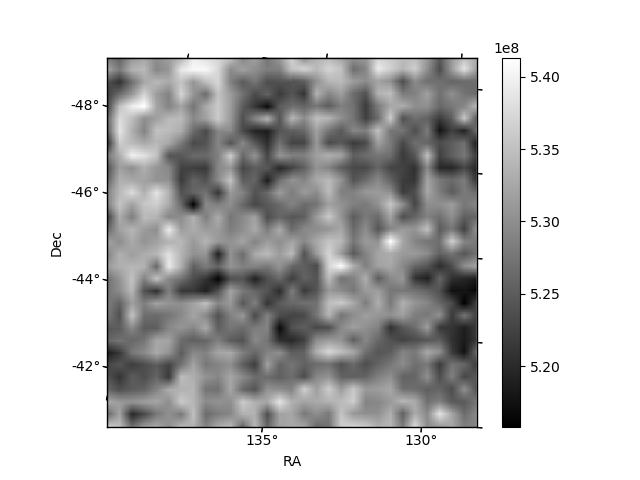
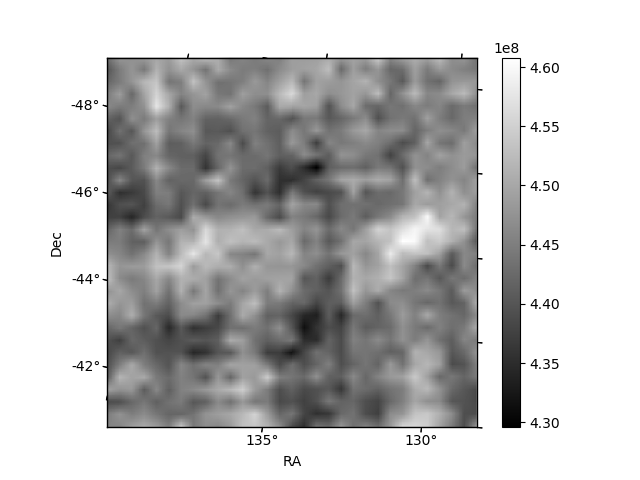
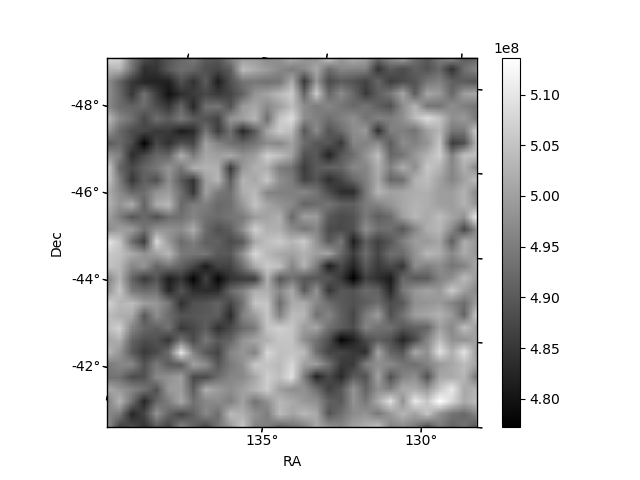
Histogram calculated using DETX and DETY for each event in the final _common_clean file
| Quadrant A | 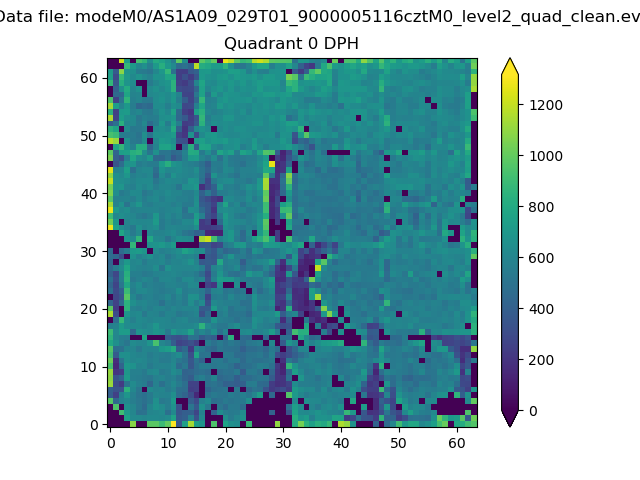 |
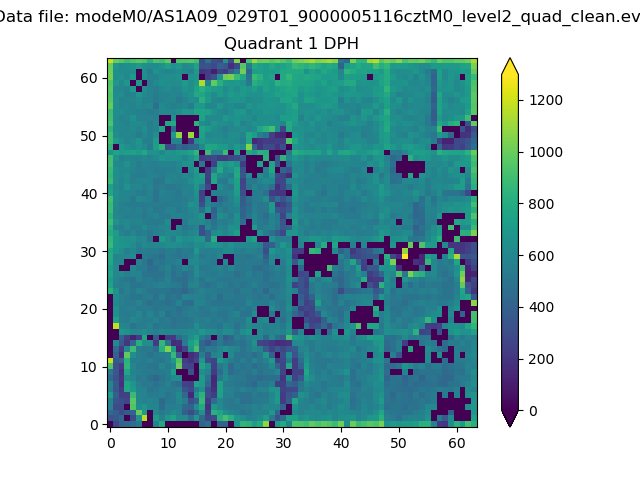 |
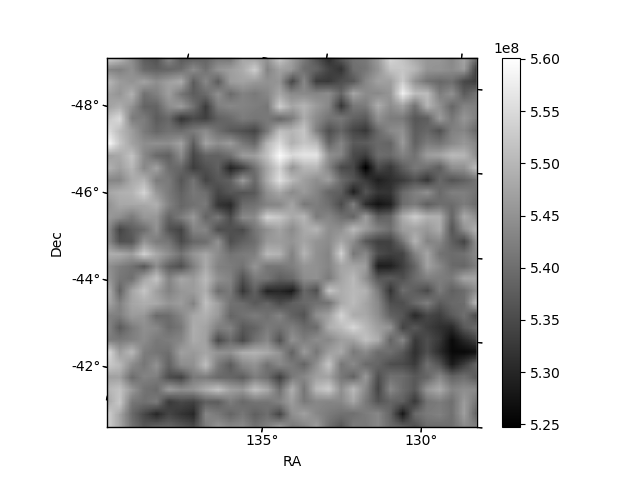
Quadrant B |
|---|---|---|---|
| Quadrant D | 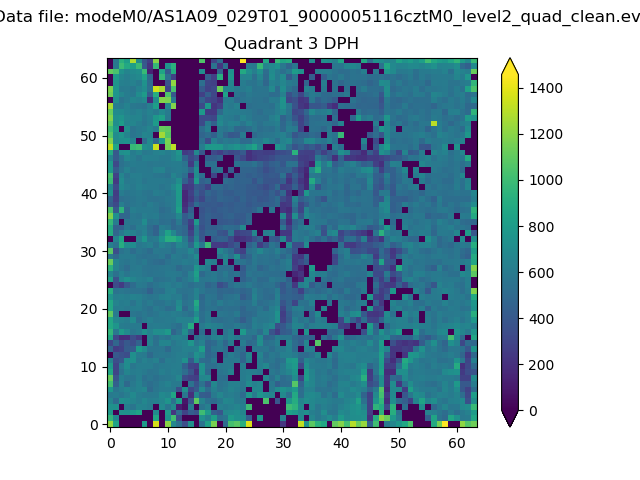 |
 |
Quadrant C |
| Plot type | Count rate plots | Images |
|---|---|---|
| Comparison with Poisson distribution Blue bars denote a histogram of data divided into 1 sec bins. Red curve is a Poisson curve with rate = median count rate of data. |
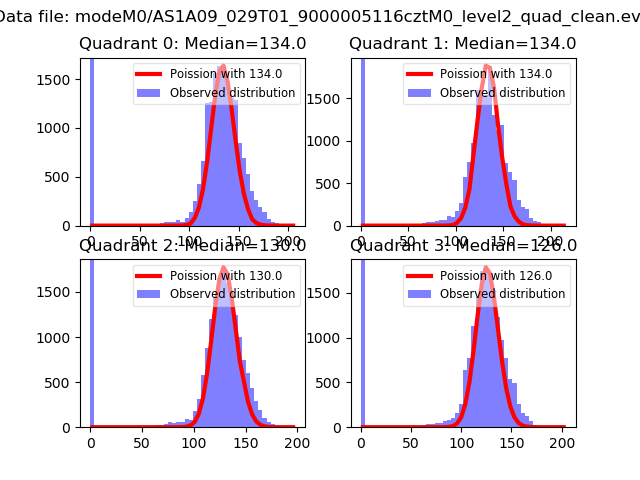 |
 |
| Quadrant-wise count rates Data is divided into 100 sec bins |
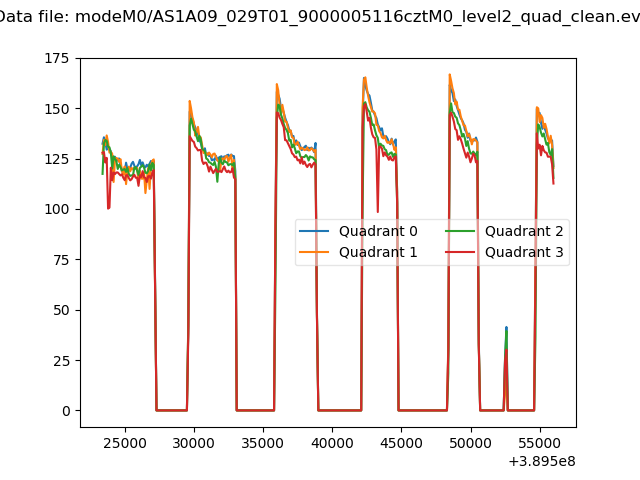 |
|
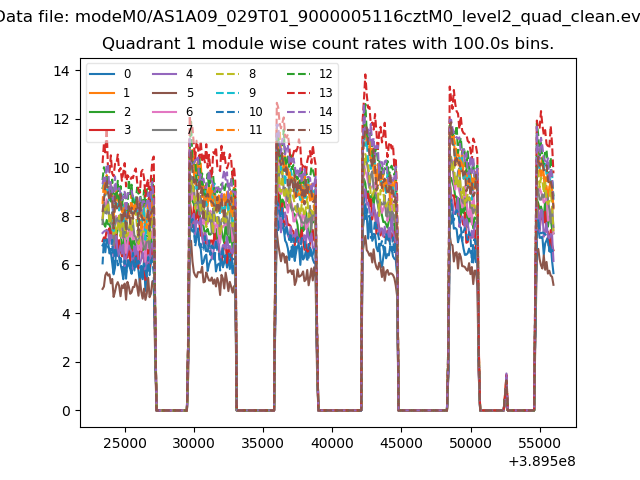
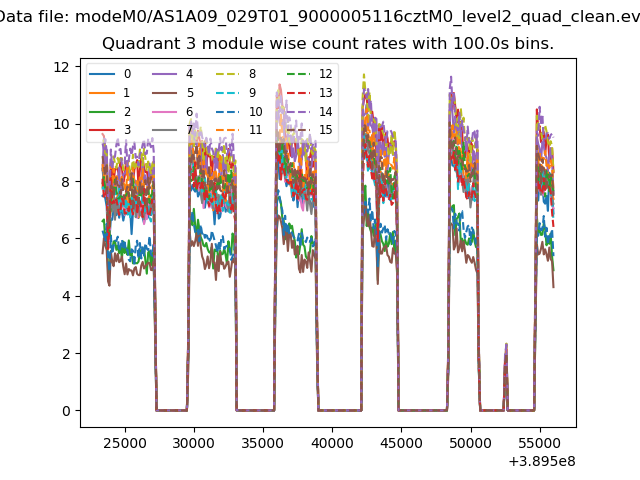
| Module-wise count rates for Quadrant A Data is divided into 100 sec bins |
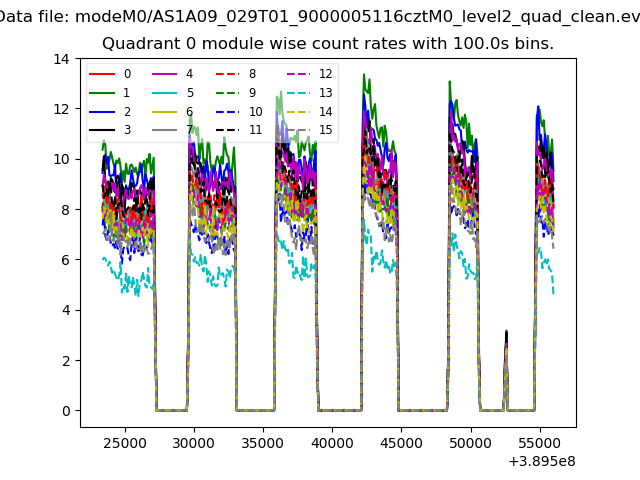 |
 |
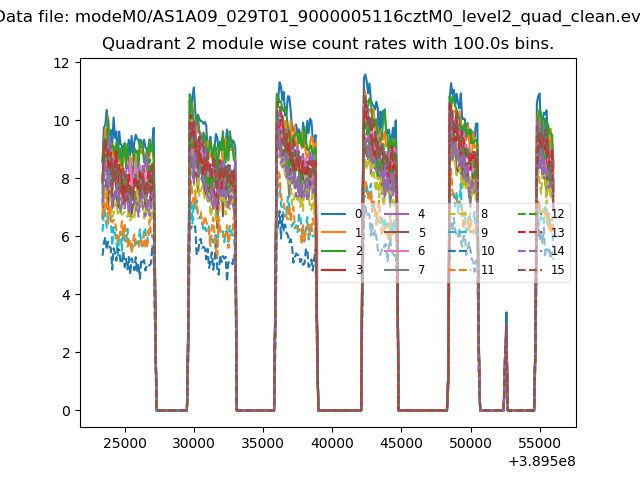
| Module-wise count rates for Quadrant B Data is divided into 100 sec bins |
 |
 |
| Module-wise count rates for Quadrant C Data is divided into 100 sec bins |
 |
 |
| Module-wise count rates for Quadrant D Data is divided into 100 sec bins |
 |
 |
| Parameter | Plot |
|---|---|
| CZT HV Monitor | 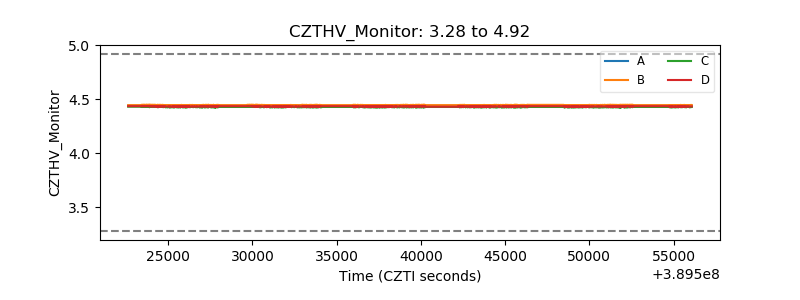 |
| D_VDD | 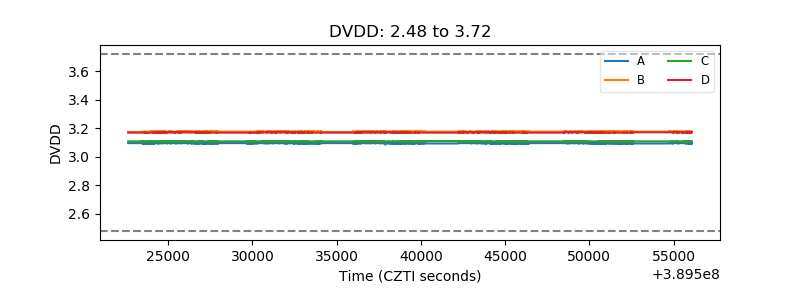 |
| Temperature 1 | 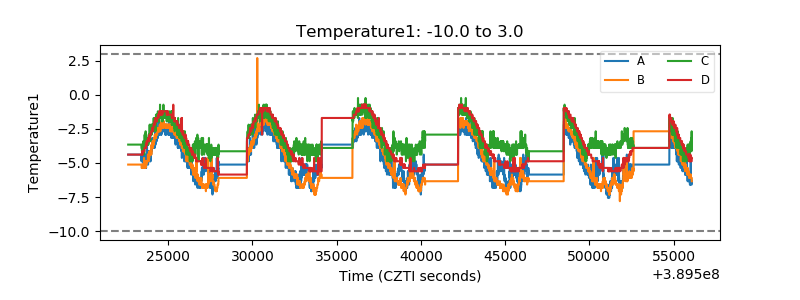 |
| Veto HV Monitor | 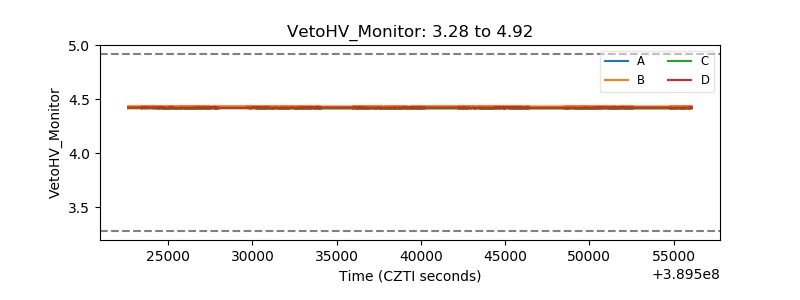 |
| Veto LLD | 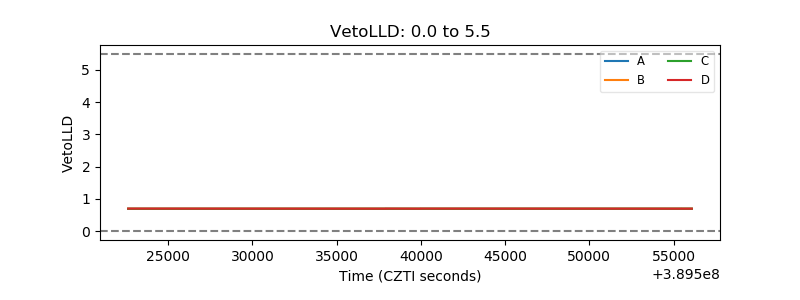 |
| Alpha Counter | 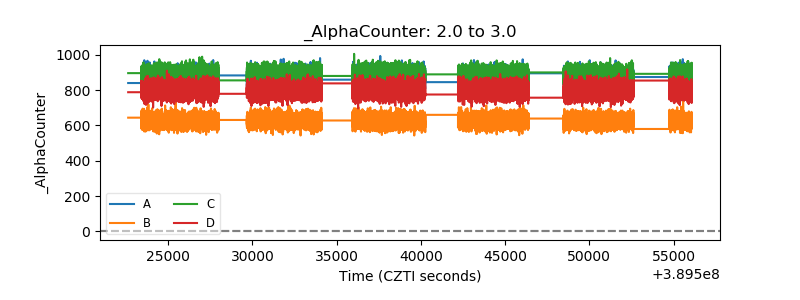 |
| _CPM_Rate | 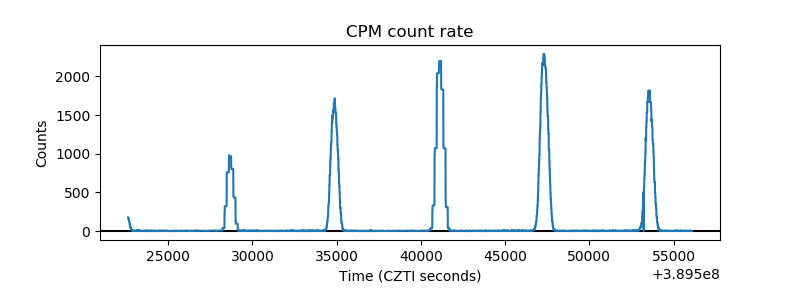 |
| CZT Counter | 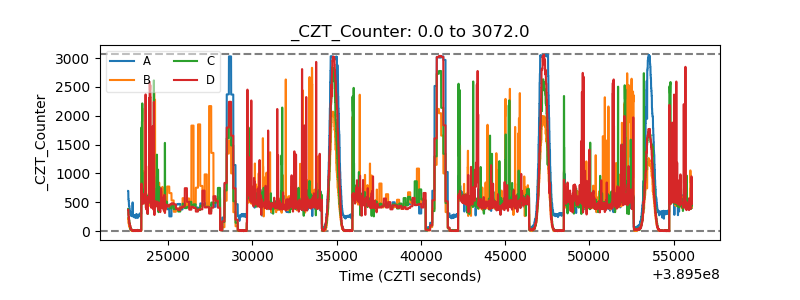 |
| +2.5 Volts monitor | 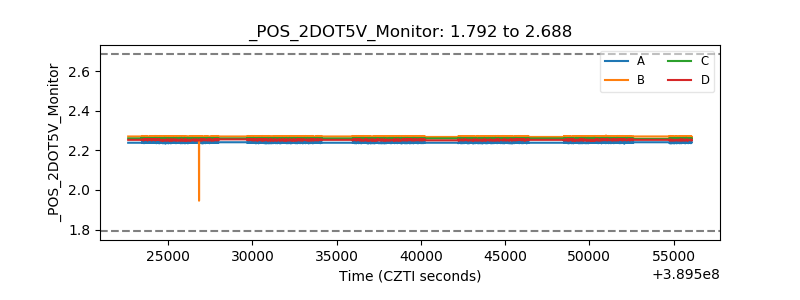 |
| +5 Volts monitor | 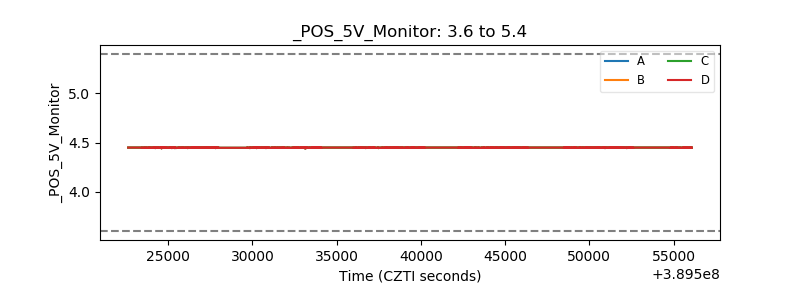 |
| _ROLL_ROT | 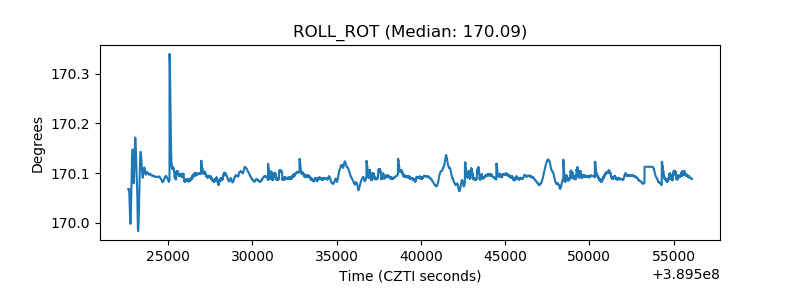 |
| _Roll_DEC | 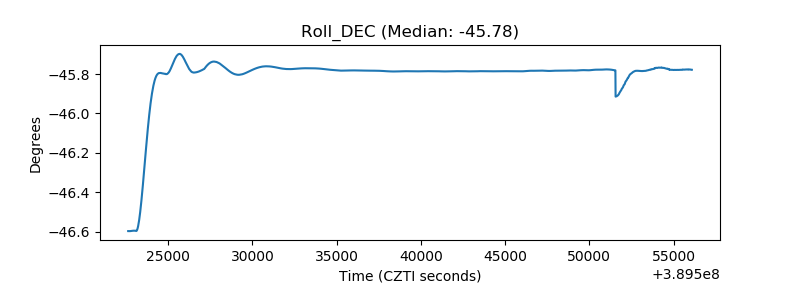 |
| _Roll_RA | 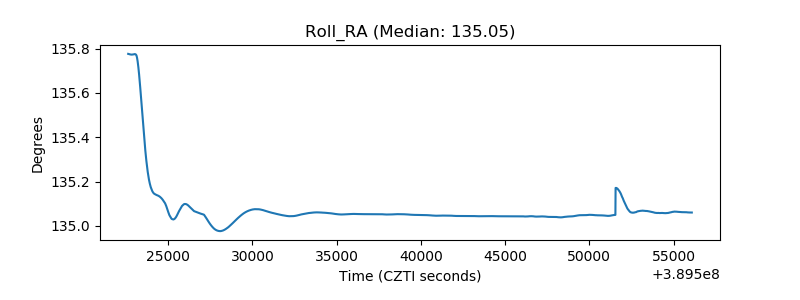 |
| Veto Counter | 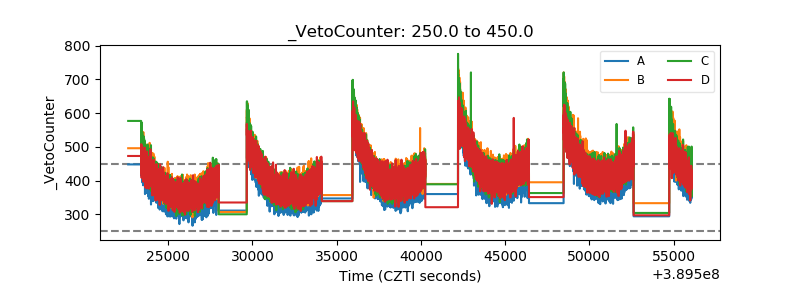 |