| Param | Original file | Final file |
|---|---|---|
| Filename | modeM0/AS1A09_142T03_9000005114_35698cztM0_level2.evt | modeM0/AS1A09_142T03_9000005114_35698cztM0_level2_quad_clean.evt |
| Size (bytes) | 218,877,120 | 34,643,520 |
| Size | 208.7 MB | 33.0 MB |
| Events in quadrant A | 1,384,424 | 210,186 |
| Events in quadrant B | 2,079,828 | 201,925 |
| Events in quadrant C | 1,558,257 | 217,630 |
| Events in quadrant D | 1,406,399 | 211,097 |
| Mode SS | |||
|---|---|---|---|
| Quadrant | BADHDUFLAG | Total packets | Discarded packets |
| A | 0 | 60 | 0 |
| B | 0 | 60 | 0 |
| C | 0 | 60 | 0 |
| D | 0 | 60 | 0 |
| Mode M0 | |||
|---|---|---|---|
| Quadrant | BADHDUFLAG | Total packets | Discarded packets |
| A | 0 | 5983 | 2 |
| B | 0 | 8073 | 1 |
| C | 0 | 6335 | 1 |
| D | 0 | 6174 | 1 |
| Mode M9 | |||
|---|---|---|---|
| Quadrant | BADHDUFLAG | Total packets | Discarded packets |
| A | 0 | 21 | 0 |
| B | 0 | 21 | 0 |
| C | 0 | 21 | 0 |
| D | 0 | 21 | 0 |
| Quadrant | Total seconds | Saturated seconds | Saturation percentage |
|---|---|---|---|
| A | 2910 | 2 | 0.068729% |
| B | 2910 | 232 | 7.972509% |
| C | 2910 | 47 | 1.615120% |
| D | 2910 | 13 | 0.446735% |
Noise dominated data is calculated using 1-second bins in cleaned event files. If a bin has >2000 counts, and if more than 50% of those come from <1% of pixels, then it is considered to be noise-dominated and hence unusable.
| Quadrant | # 1 sec bins | Bins with >0 counts | Bins with >2000 counts | High rate bins dominated by noise | Noise dominated (total time) | Noise dominated (detector-on time) | Marked lightcurve |
|---|---|---|---|---|---|---|---|
| A | 5002 | 2911 | 0 | 0 | 0.00% | 0.00% | 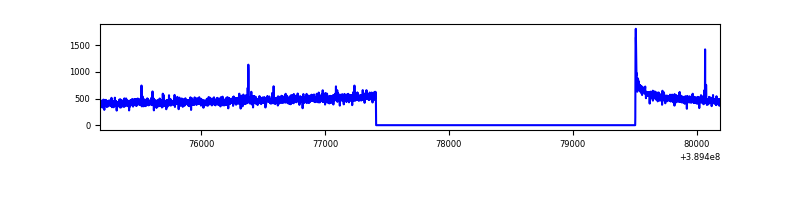 |
| B | 5001 | 2910 | 190 | 190 | 3.80% | 6.53% | 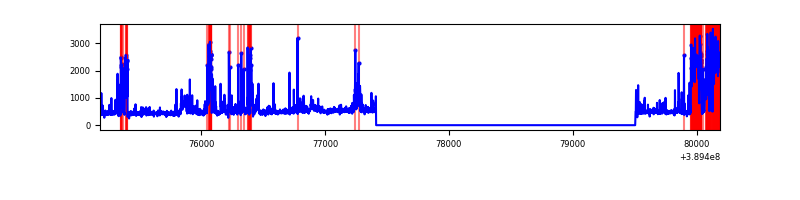 |
| C | 5002 | 2911 | 35 | 35 | 0.70% | 1.20% | 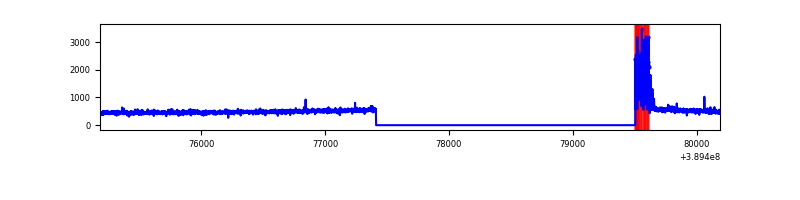 |
| D | 5002 | 2911 | 11 | 11 | 0.22% | 0.38% | 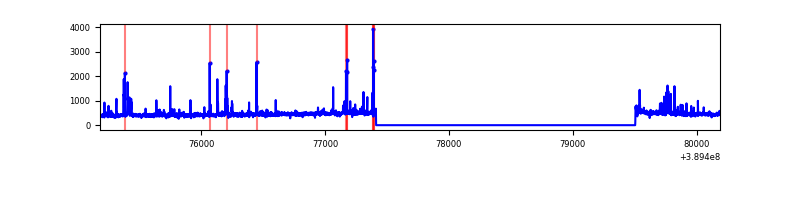 |
Top three noisy pixels from each quadrant. If the there are fewer than three noisy pixels in the level2.evt file, extra rows are filled as -1
| Pixel properties | Quadrant properties | ||||||
|---|---|---|---|---|---|---|---|
| Quadrant | DetID | PixID | Counts | Sigma | Mean | Median | Sigma |
| A | 10 | 83 | 69620 | 1009.47 | 336 | 330 | 68.6 |
| A | 10 | 255 | 8959 | 125.71 | 336 | 330 | 68.6 |
| A | 13 | 6 | 5503 | 75.36 | 336 | 330 | 68.6 |
| B | 5 | 172 | 714816 | 11194.94 | 326 | 318 | 63.8 |
| B | 3 | 112 | 43525 | 676.98 | 326 | 318 | 63.8 |
| B | 5 | 255 | 26787 | 414.72 | 326 | 318 | 63.8 |
| C | 0 | 10 | 145398 | 1877.65 | 330 | 332 | 77.3 |
| C | 15 | 214 | 120780 | 1559.01 | 330 | 332 | 77.3 |
| C | 9 | 187 | 2500 | 28.06 | 330 | 332 | 77.3 |
| D | 13 | 249 | 85961 | 1061.91 | 330 | 322 | 80.6 |
| D | 12 | 217 | 23821 | 291.38 | 330 | 322 | 80.6 |
| D | 12 | 6 | 16973 | 206.47 | 330 | 322 | 80.6 |
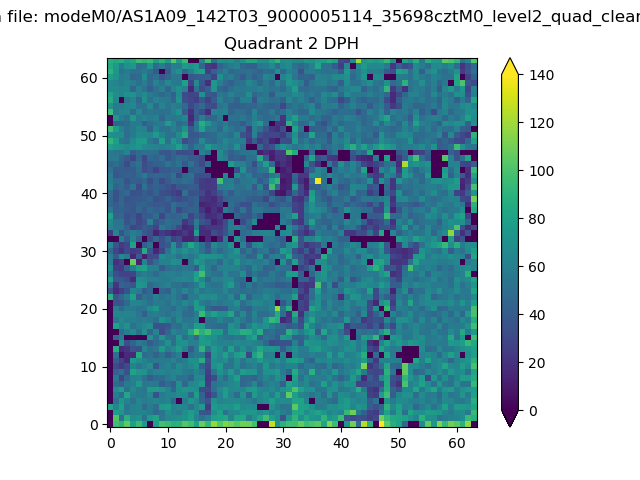
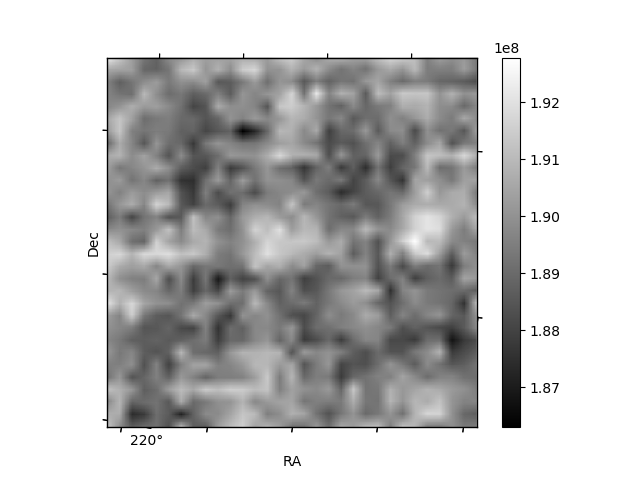
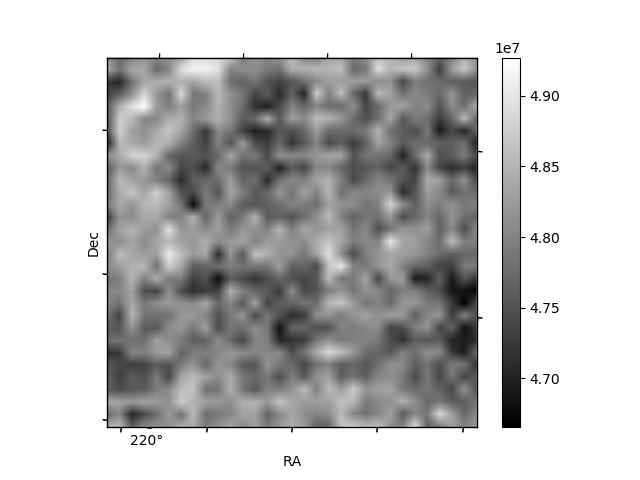
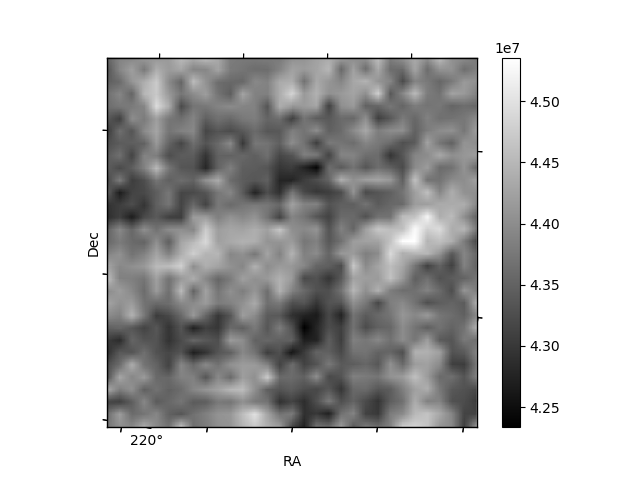
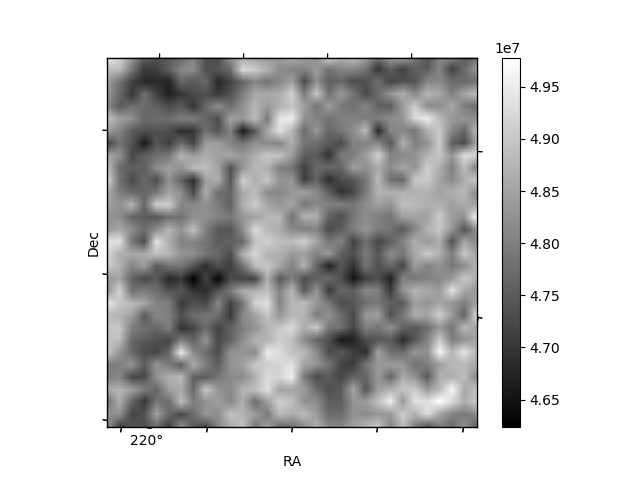
Histogram calculated using DETX and DETY for each event in the final _common_clean file
| Quadrant A | 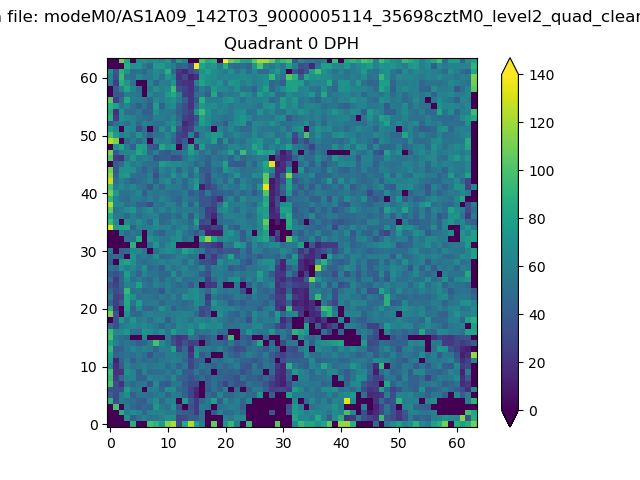 |
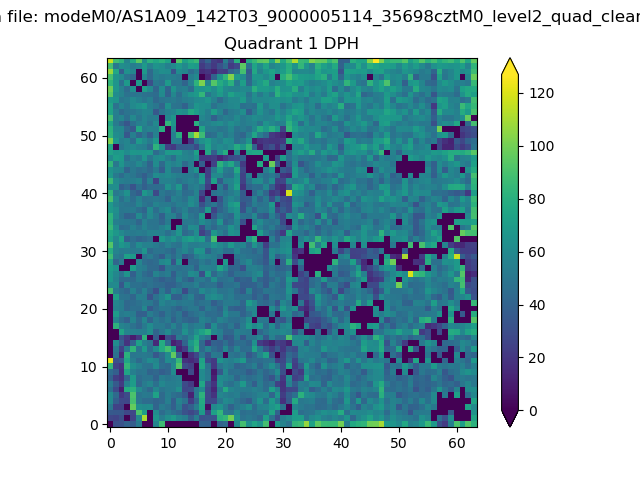 |
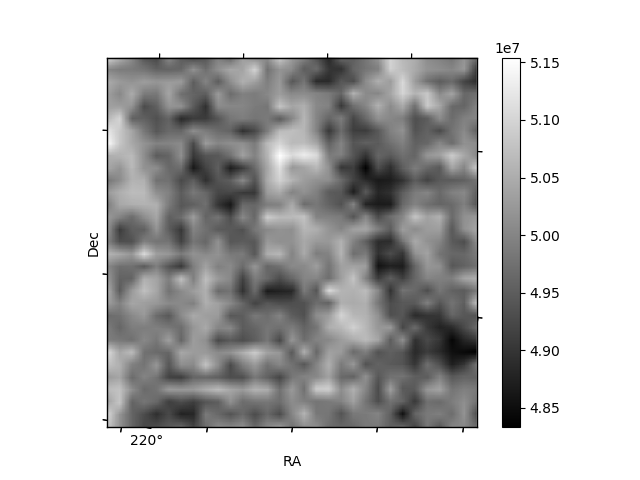
Quadrant B |
|---|---|---|---|
| Quadrant D | 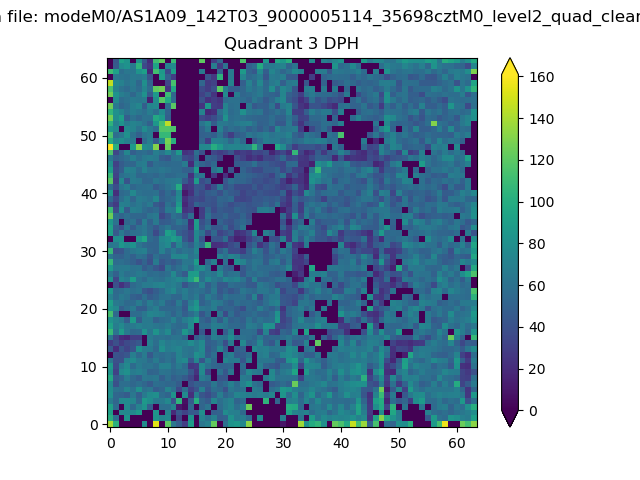 |
 |
Quadrant C |
| Plot type | Count rate plots | Images |
|---|---|---|
| Comparison with Poisson distribution Blue bars denote a histogram of data divided into 1 sec bins. Red curve is a Poisson curve with rate = median count rate of data. |
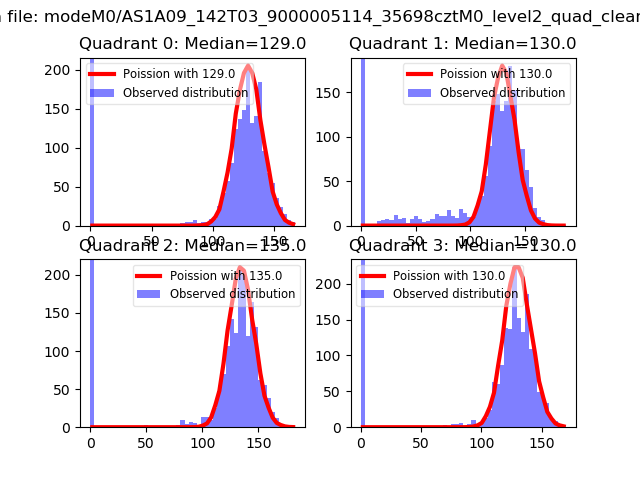 |
 |
| Quadrant-wise count rates Data is divided into 100 sec bins |
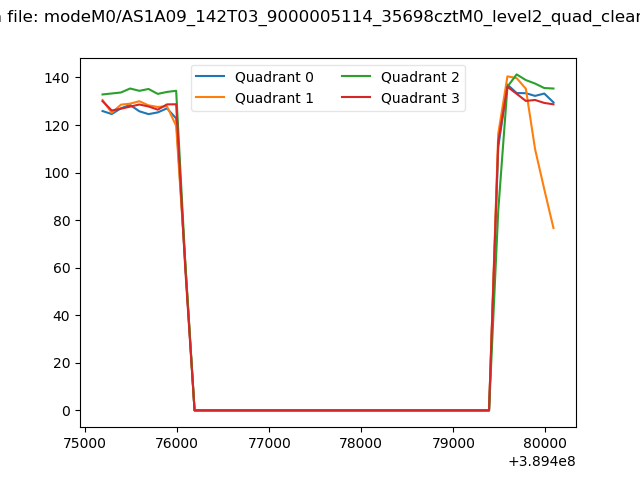 |
|
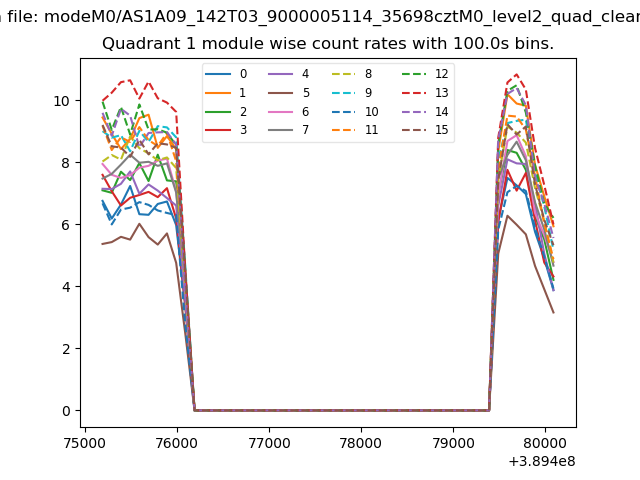
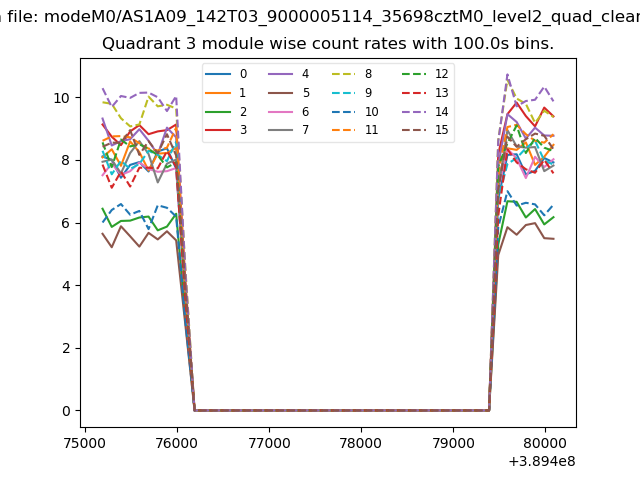
| Module-wise count rates for Quadrant A Data is divided into 100 sec bins |
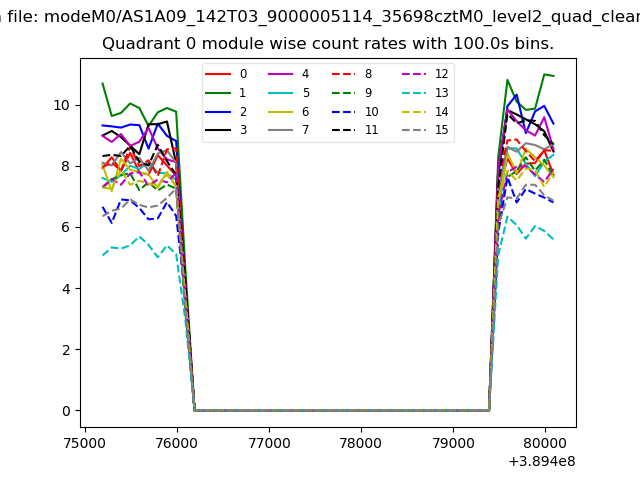 |
 |
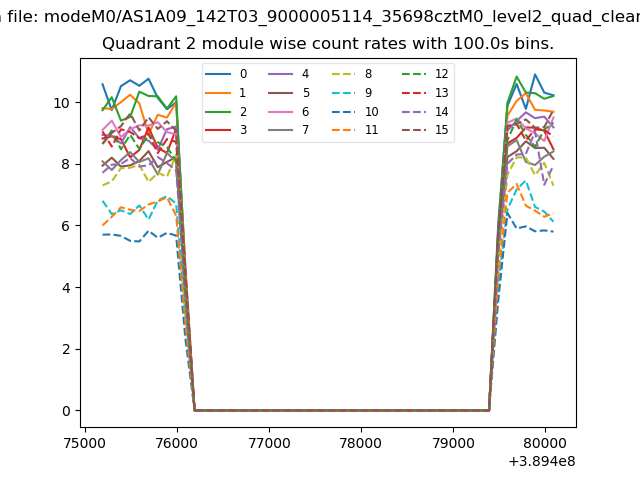
| Module-wise count rates for Quadrant B Data is divided into 100 sec bins |
 |
 |
| Module-wise count rates for Quadrant C Data is divided into 100 sec bins |
 |
 |
| Module-wise count rates for Quadrant D Data is divided into 100 sec bins |
 |
 |
| Parameter | Plot |
|---|---|
| CZT HV Monitor |  |
| D_VDD | 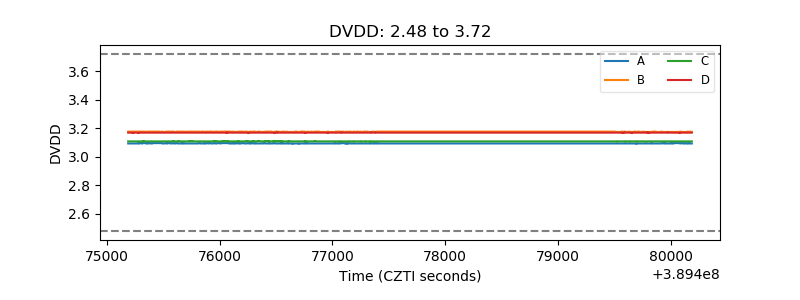 |
| Temperature 1 | 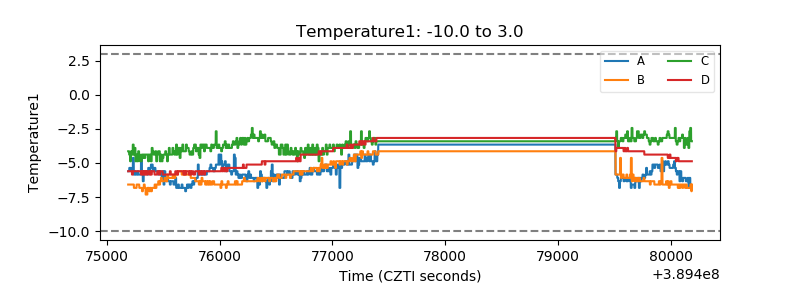 |
| Veto HV Monitor | 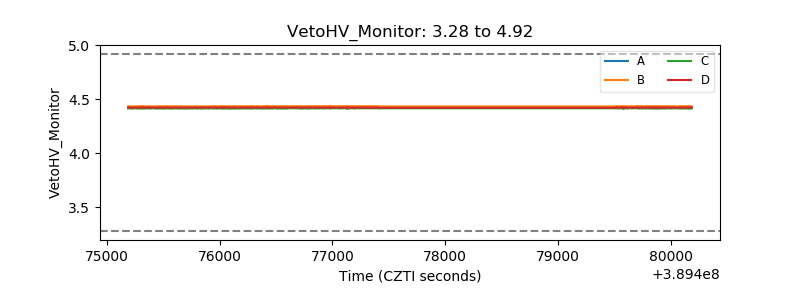 |
| Veto LLD | 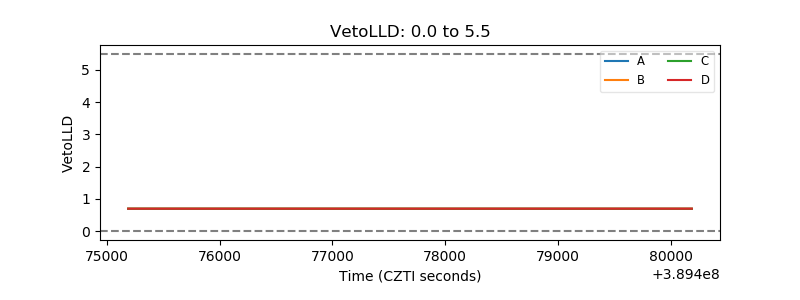 |
| Alpha Counter | 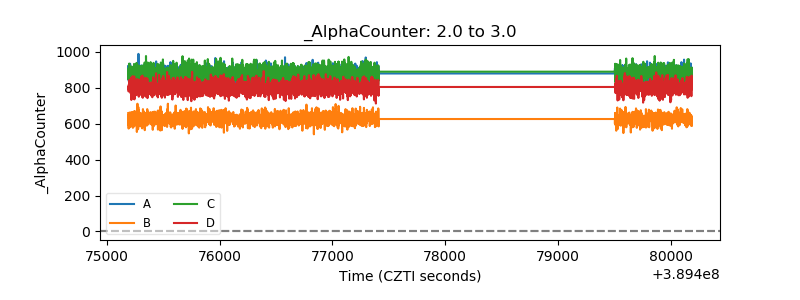 |
| _CPM_Rate | 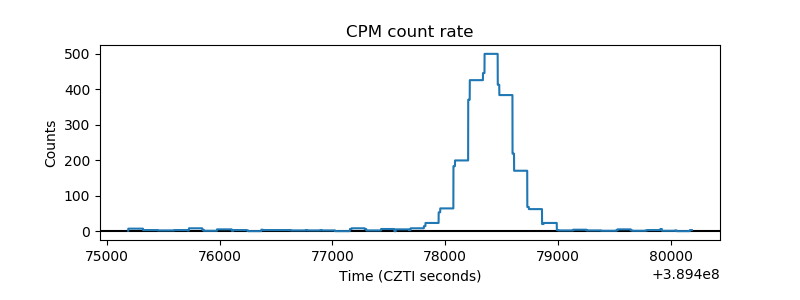 |
| CZT Counter | 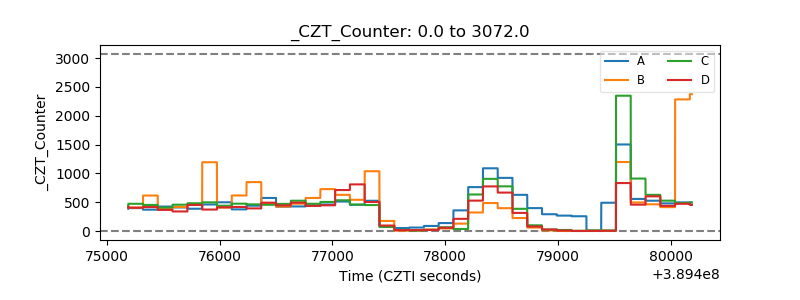 |
| +2.5 Volts monitor | 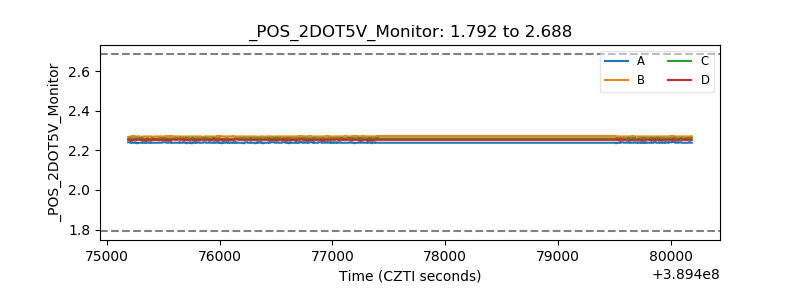 |
| +5 Volts monitor | 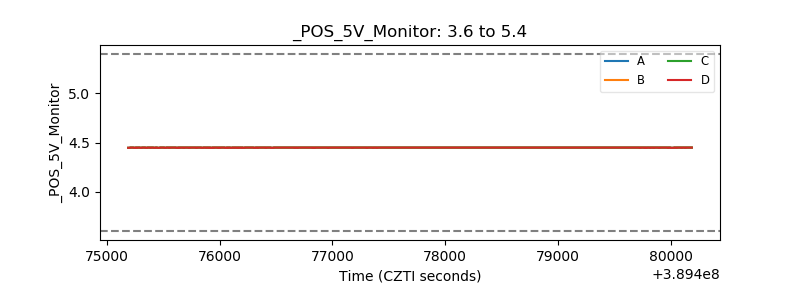 |
| _ROLL_ROT | 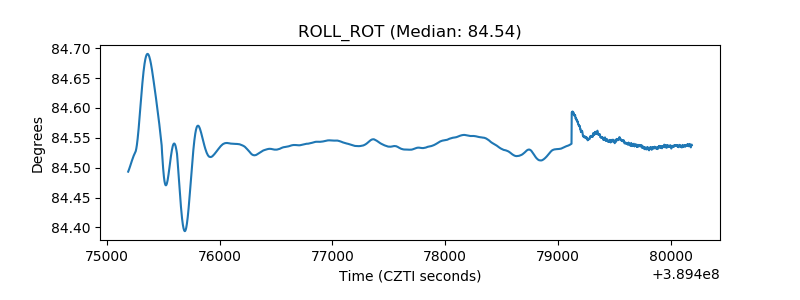 |
| _Roll_DEC | 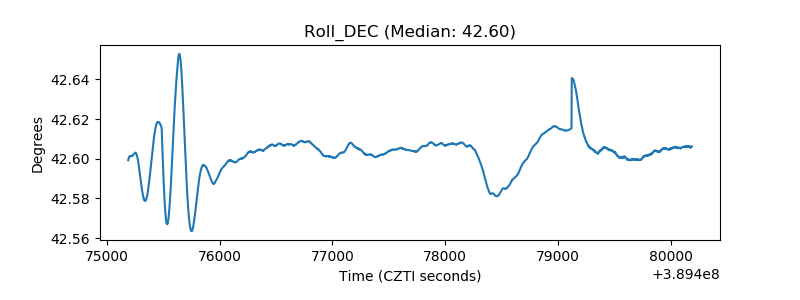 |
| _Roll_RA | 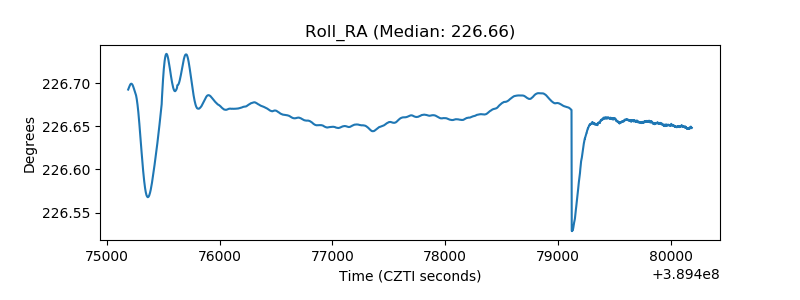 |
| Veto Counter | 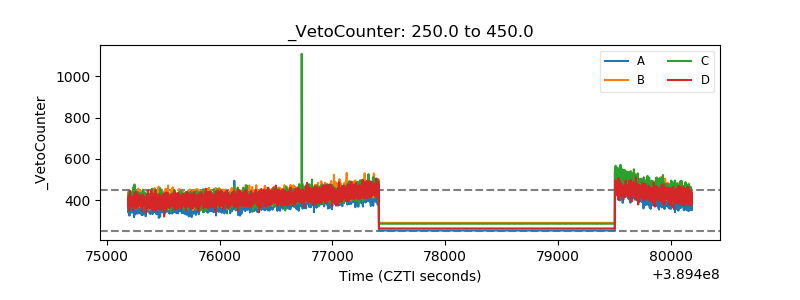 |