| Param | Original file | Final file |
|---|---|---|
| Filename | modeM0/AS1A09_142T02_9000005112_35698cztM0_level2.evt | modeM0/AS1A09_142T02_9000005112_35698cztM0_level2_quad_clean.evt |
| Size (bytes) | 94,798,080 | 27,000,000 |
| Size | 90.4 MB | 25.7 MB |
| Events in quadrant A | 660,941 | 181,904 |
| Events in quadrant B | 685,929 | 183,673 |
| Events in quadrant C | 778,800 | 178,842 |
| Events in quadrant D | 653,658 | 174,945 |
| Mode SS | |||
|---|---|---|---|
| Quadrant | BADHDUFLAG | Total packets | Discarded packets |
| A | 0 | 26 | 0 |
| B | 0 | 26 | 0 |
| C | 0 | 26 | 0 |
| D | 0 | 26 | 0 |
| Mode M0 | |||
|---|---|---|---|
| Quadrant | BADHDUFLAG | Total packets | Discarded packets |
| A | 0 | 2777 | 1 |
| B | 0 | 2854 | 1 |
| C | 0 | 3047 | 1 |
| D | 0 | 2729 | 1 |
| Mode M9 | |||
|---|---|---|---|
| Quadrant | BADHDUFLAG | Total packets | Discarded packets |
| A | 0 | 11 | 0 |
| B | 0 | 11 | 0 |
| C | 0 | 11 | 0 |
| D | 0 | 12 | 0 |
| Quadrant | Total seconds | Saturated seconds | Saturation percentage |
|---|---|---|---|
| A | 1304 | 1 | 0.076687% |
| B | 1304 | 15 | 1.150307% |
| C | 1304 | 50 | 3.834356% |
| D | 1304 | 2 | 0.153374% |
Noise dominated data is calculated using 1-second bins in cleaned event files. If a bin has >2000 counts, and if more than 50% of those come from <1% of pixels, then it is considered to be noise-dominated and hence unusable.
| Quadrant | # 1 sec bins | Bins with >0 counts | Bins with >2000 counts | High rate bins dominated by noise | Noise dominated (total time) | Noise dominated (detector-on time) | Marked lightcurve |
|---|---|---|---|---|---|---|---|
| A | 1304 | 1304 | 0 | 0 | 0.00% | 0.00% | 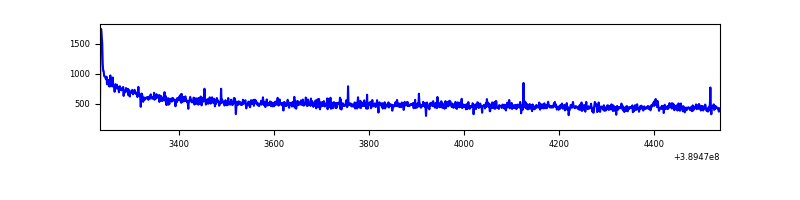 |
| B | 1304 | 1304 | 13 | 13 | 1.00% | 1.00% | 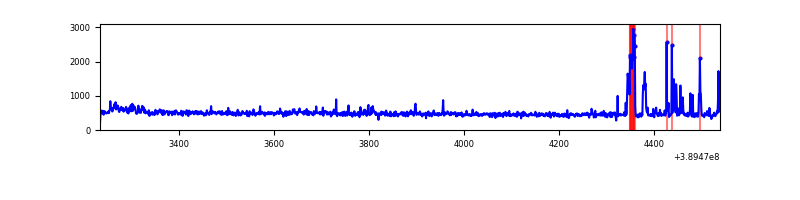 |
| C | 1304 | 1304 | 35 | 35 | 2.68% | 2.68% | 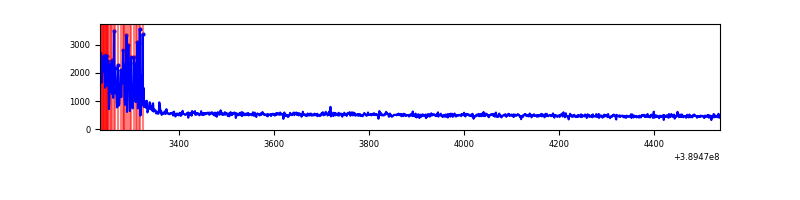 |
| D | 1304 | 1304 | 1 | 1 | 0.08% | 0.08% | 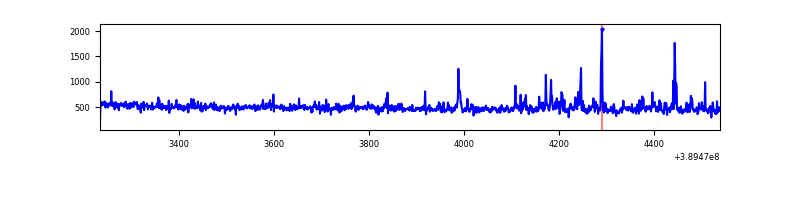 |
Top three noisy pixels from each quadrant. If the there are fewer than three noisy pixels in the level2.evt file, extra rows are filled as -1
| Pixel properties | Quadrant properties | ||||||
|---|---|---|---|---|---|---|---|
| Quadrant | DetID | PixID | Counts | Sigma | Mean | Median | Sigma |
| A | 10 | 83 | 56660 | 1698.18 | 155 | 152 | 33.3 |
| A | 13 | 6 | 3328 | 95.45 | 155 | 152 | 33.3 |
| A | 10 | 67 | 2041 | 56.77 | 155 | 152 | 33.3 |
| B | 5 | 172 | 59290 | 1889.15 | 154 | 150 | 31.3 |
| B | 0 | 190 | 7842 | 245.71 | 154 | 150 | 31.3 |
| B | 12 | 111 | 3392 | 103.56 | 154 | 150 | 31.3 |
| C | 0 | 10 | 127815 | 3463.93 | 152 | 152 | 36.9 |
| C | 15 | 214 | 57221 | 1548.48 | 152 | 152 | 36.9 |
| C | 13 | 61 | 958 | 21.87 | 152 | 152 | 36.9 |
| D | 2 | 250 | 20549 | 526.13 | 153 | 149 | 38.8 |
| D | 10 | 118 | 13409 | 341.98 | 153 | 149 | 38.8 |
| D | 8 | 195 | 10330 | 262.57 | 153 | 149 | 38.8 |
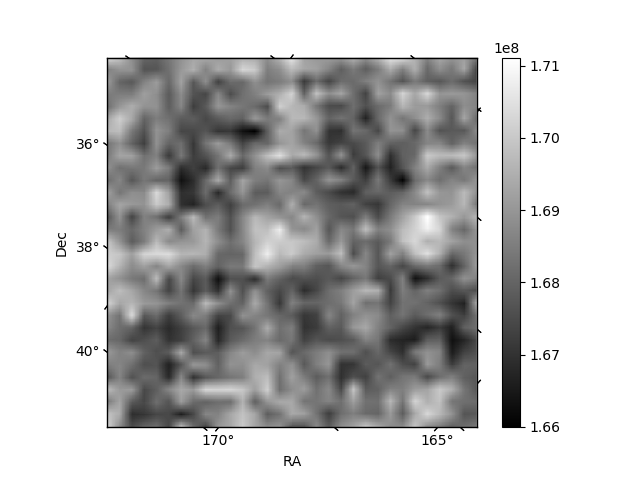
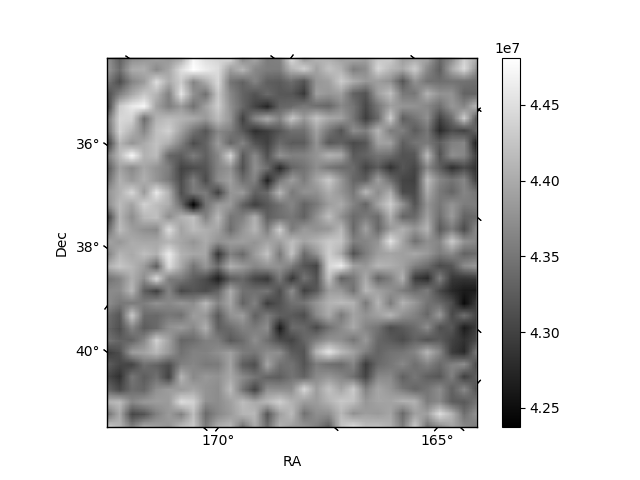
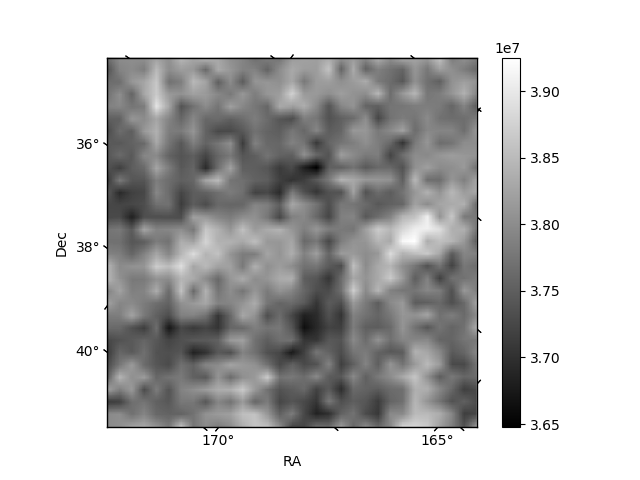
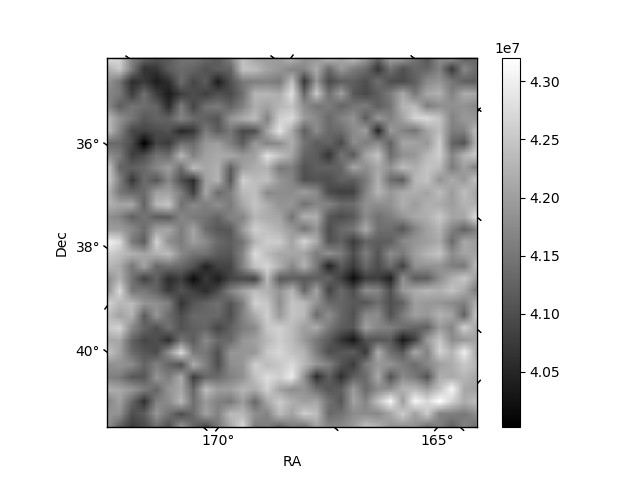
Histogram calculated using DETX and DETY for each event in the final _common_clean file
| Quadrant A | 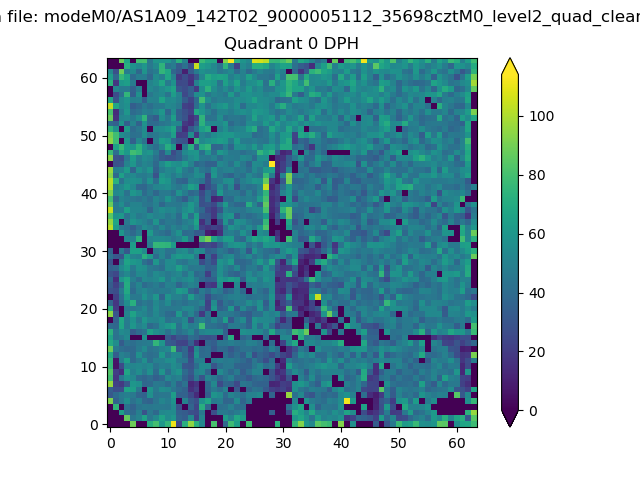 |
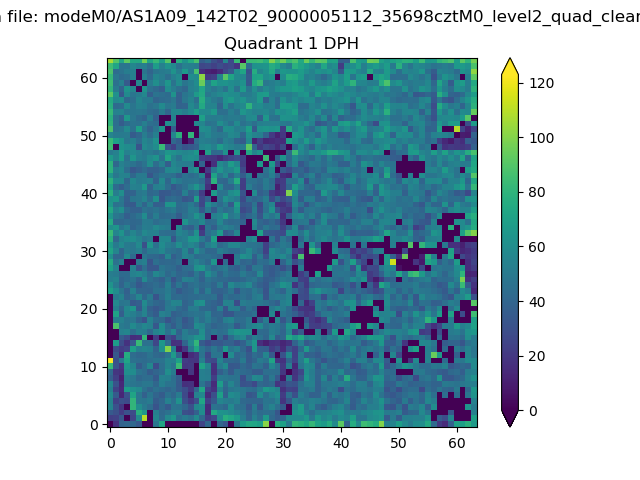 |
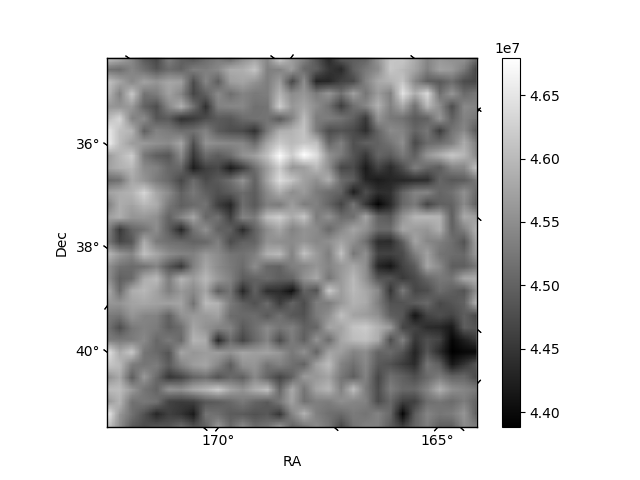
Quadrant B |
|---|---|---|---|
| Quadrant D | 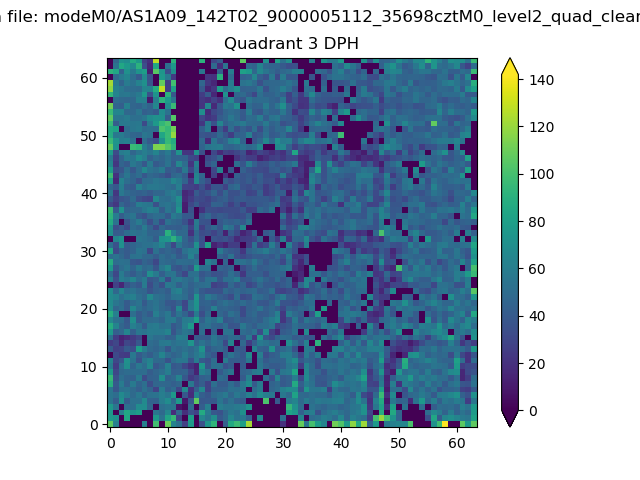 |
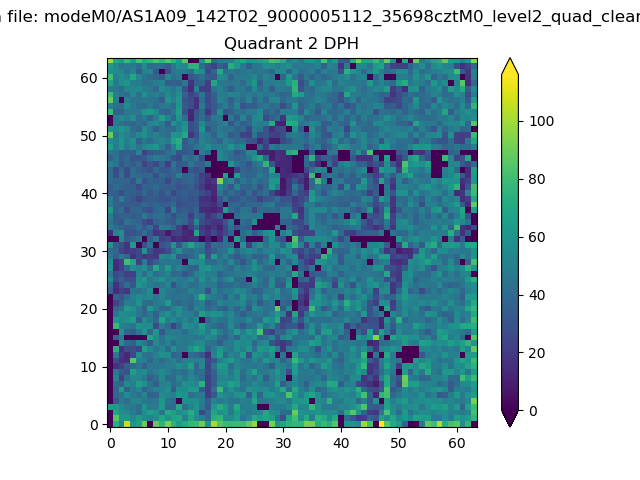 |
Quadrant C |
| Plot type | Count rate plots | Images |
|---|---|---|
| Comparison with Poisson distribution Blue bars denote a histogram of data divided into 1 sec bins. Red curve is a Poisson curve with rate = median count rate of data. |
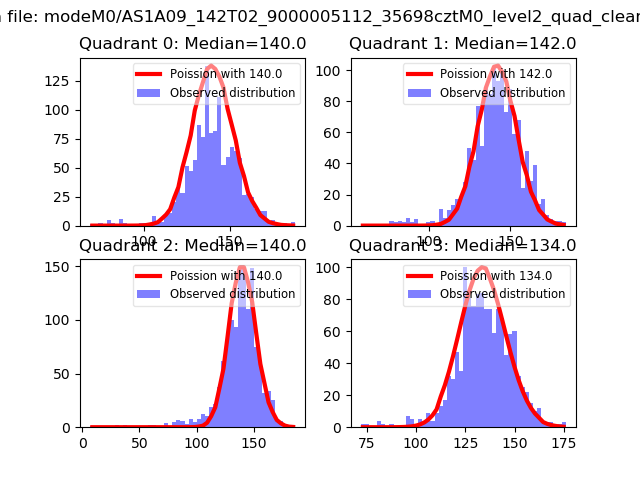 |
 |
| Quadrant-wise count rates Data is divided into 100 sec bins |
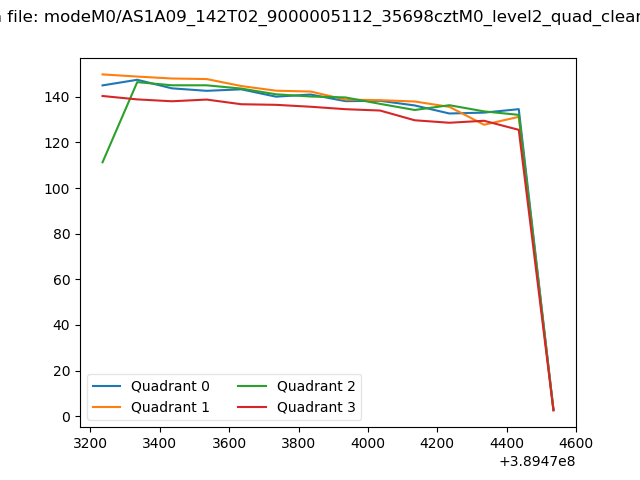 |
|
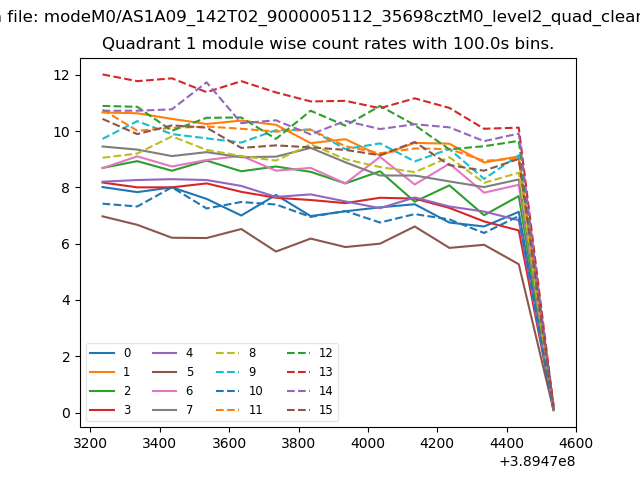
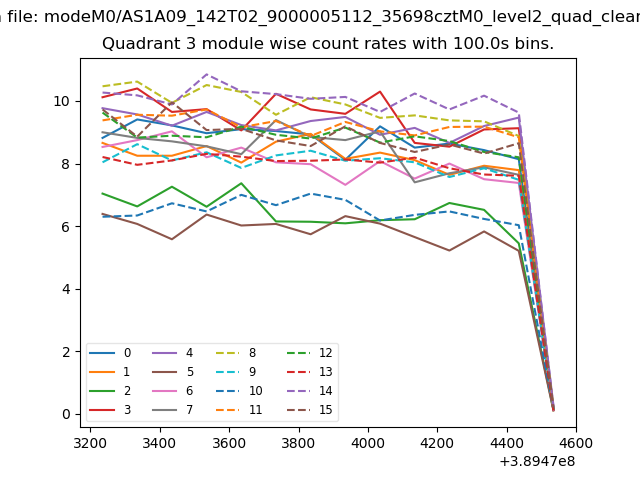
| Module-wise count rates for Quadrant A Data is divided into 100 sec bins |
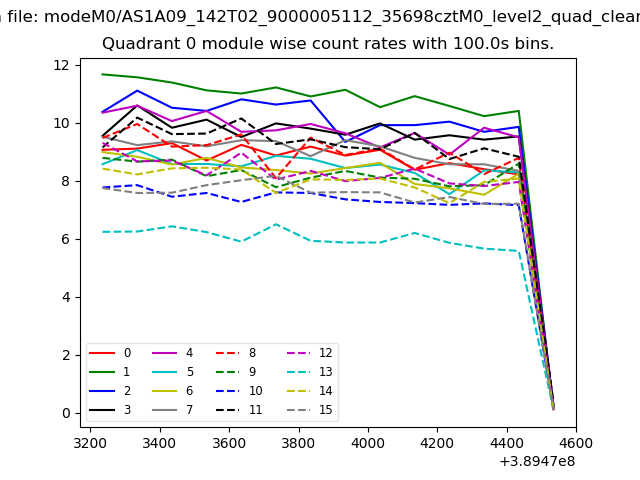 |
 |
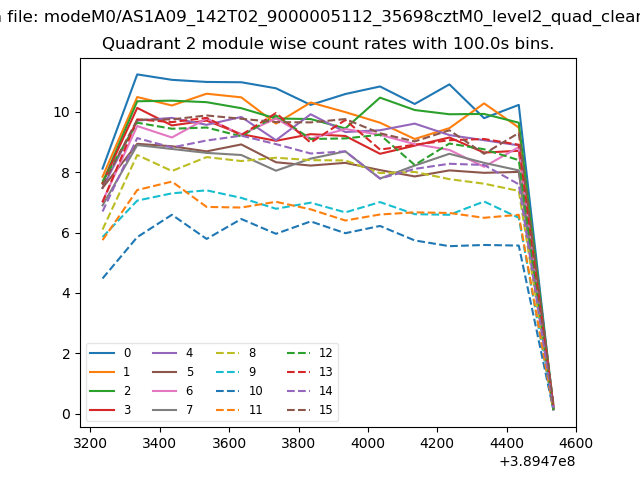
| Module-wise count rates for Quadrant B Data is divided into 100 sec bins |
 |
 |
| Module-wise count rates for Quadrant C Data is divided into 100 sec bins |
 |
 |
| Module-wise count rates for Quadrant D Data is divided into 100 sec bins |
 |
 |
| Parameter | Plot |
|---|---|
| CZT HV Monitor | 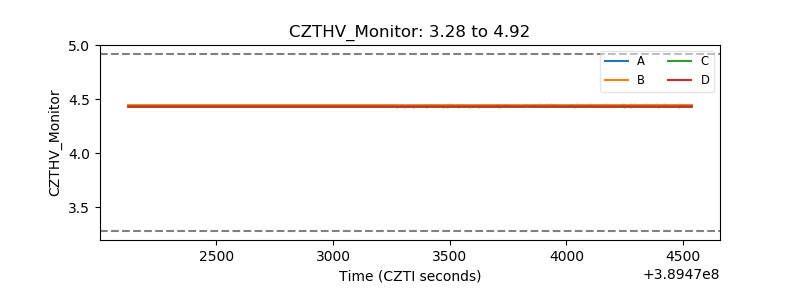 |
| D_VDD | 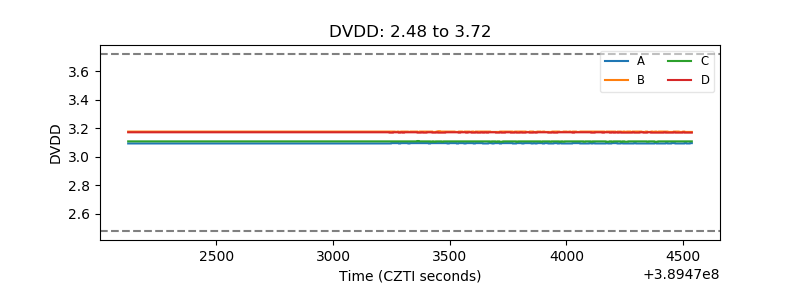 |
| Temperature 1 | 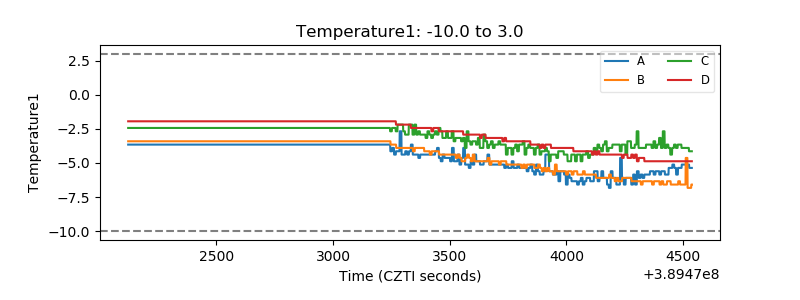 |
| Veto HV Monitor | 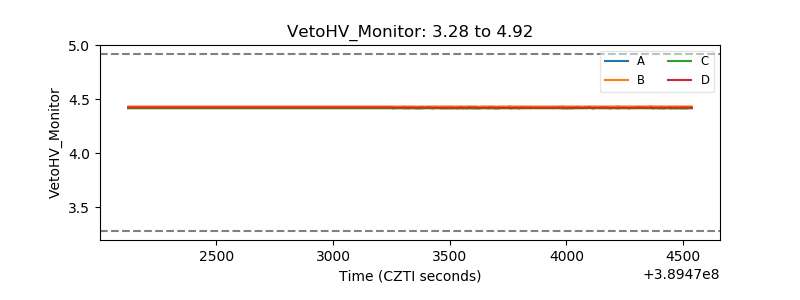 |
| Veto LLD | 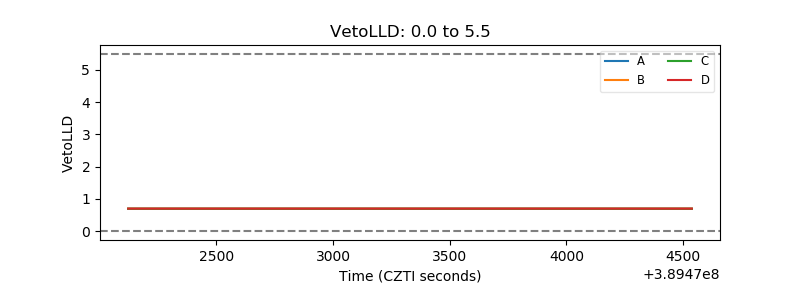 |
| Alpha Counter | 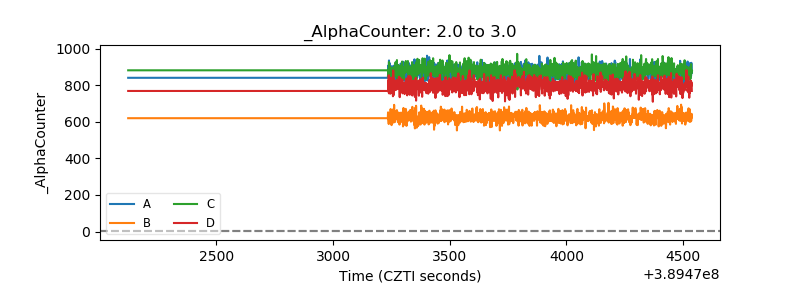 |
| _CPM_Rate | 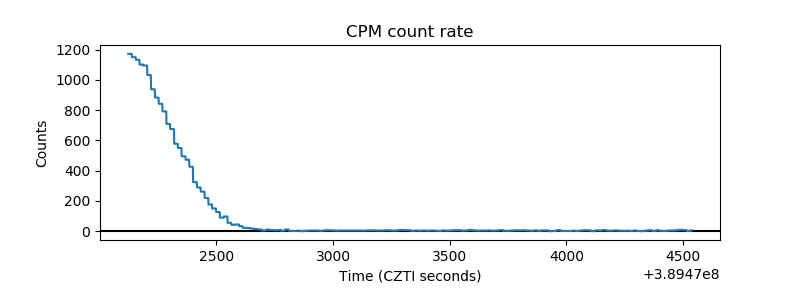 |
| CZT Counter | 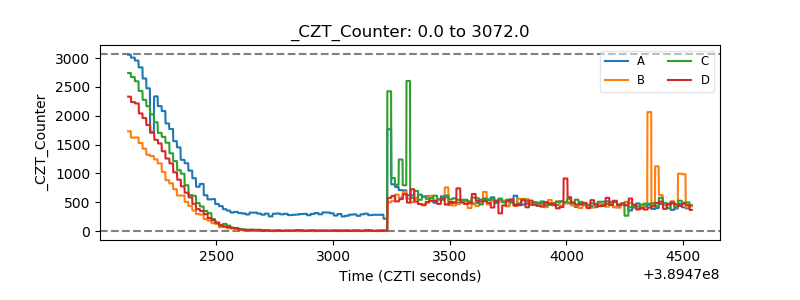 |
| +2.5 Volts monitor | 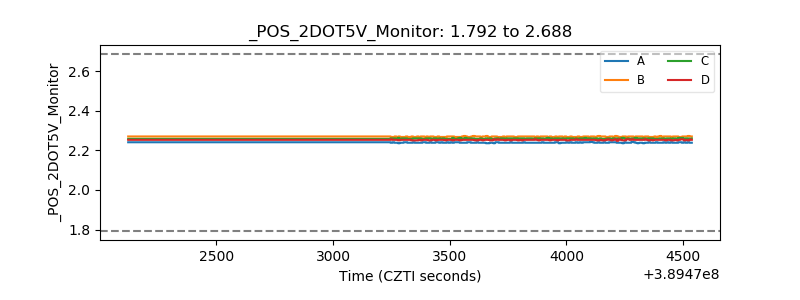 |
| +5 Volts monitor | 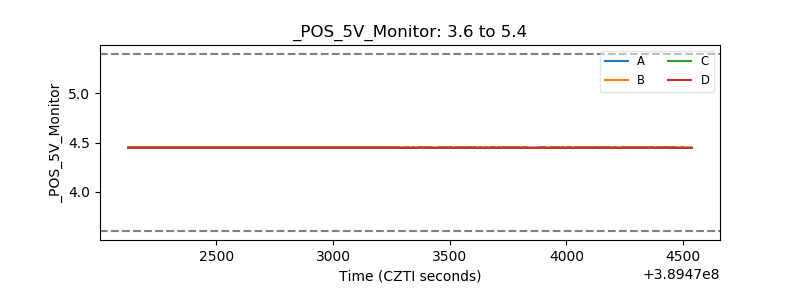 |
| _ROLL_ROT | 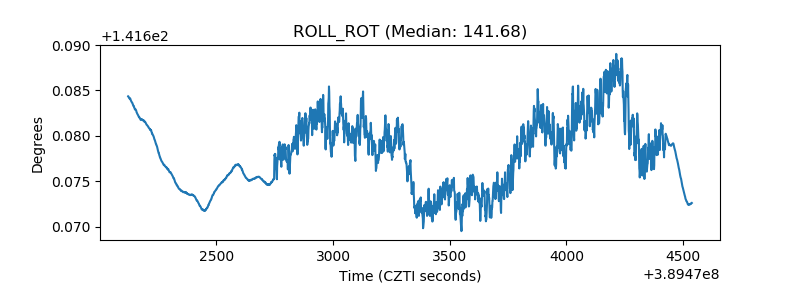 |
| _Roll_DEC | 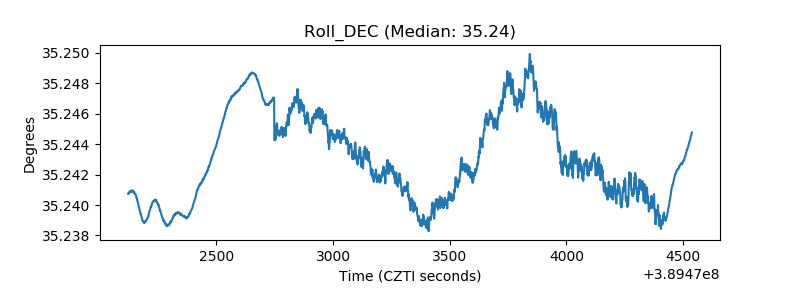 |
| _Roll_RA | 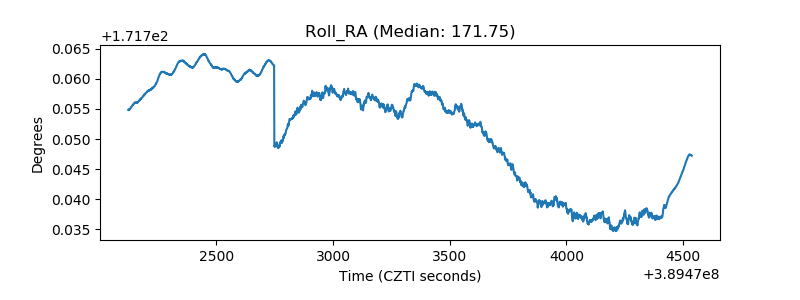 |
| Veto Counter | 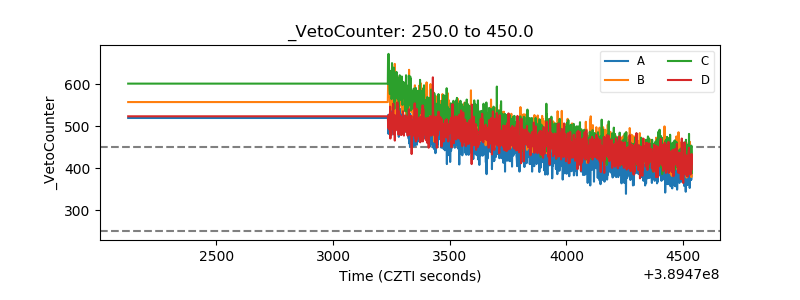 |