| Param | Original file | Final file |
|---|---|---|
| Filename | modeM0/AS1A09_142T02_9000005112_35697cztM0_level2.evt | modeM0/AS1A09_142T02_9000005112_35697cztM0_level2_quad_clean.evt |
| Size (bytes) | 362,088,000 | 72,495,360 |
| Size | 345.3 MB | 69.1 MB |
| Events in quadrant A | 2,462,846 | 467,743 |
| Events in quadrant B | 2,841,500 | 470,703 |
| Events in quadrant C | 2,762,658 | 461,597 |
| Events in quadrant D | 2,562,022 | 448,106 |
| Mode SS | |||
|---|---|---|---|
| Quadrant | BADHDUFLAG | Total packets | Discarded packets |
| A | 0 | 100 | 0 |
| B | 0 | 100 | 0 |
| C | 0 | 100 | 0 |
| D | 0 | 100 | 0 |
| Mode M0 | |||
|---|---|---|---|
| Quadrant | BADHDUFLAG | Total packets | Discarded packets |
| A | 0 | 10390 | 3 |
| B | 0 | 11494 | 2 |
| C | 0 | 11010 | 2 |
| D | 0 | 10751 | 2 |
| Mode M9 | |||
|---|---|---|---|
| Quadrant | BADHDUFLAG | Total packets | Discarded packets |
| A | 0 | 27 | 0 |
| B | 0 | 27 | 0 |
| C | 0 | 27 | 0 |
| D | 0 | 28 | 0 |
| Quadrant | Total seconds | Saturated seconds | Saturation percentage |
|---|---|---|---|
| A | 4951 | 6 | 0.121188% |
| B | 4951 | 66 | 1.333064% |
| C | 4951 | 85 | 1.716825% |
| D | 4951 | 22 | 0.444355% |
Noise dominated data is calculated using 1-second bins in cleaned event files. If a bin has >2000 counts, and if more than 50% of those come from <1% of pixels, then it is considered to be noise-dominated and hence unusable.
| Quadrant | # 1 sec bins | Bins with >0 counts | Bins with >2000 counts | High rate bins dominated by noise | Noise dominated (total time) | Noise dominated (detector-on time) | Marked lightcurve |
|---|---|---|---|---|---|---|---|
| A | 7073 | 4952 | 0 | 0 | 0.00% | 0.00% | 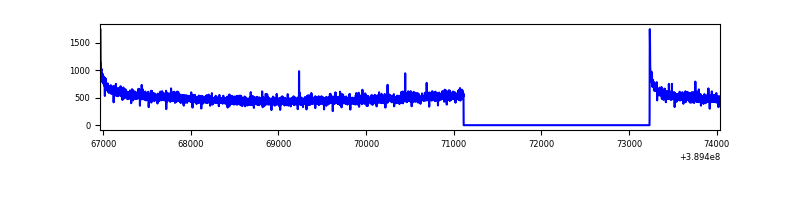 |
| B | 7073 | 4952 | 44 | 44 | 0.62% | 0.89% | 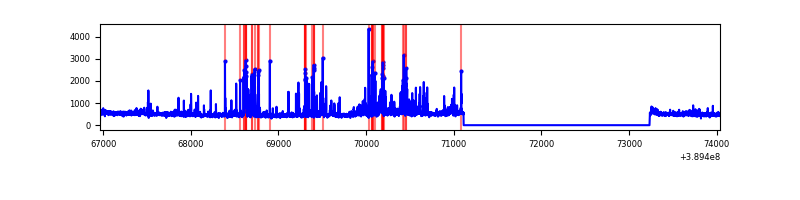 |
| C | 7073 | 4952 | 63 | 63 | 0.89% | 1.27% | 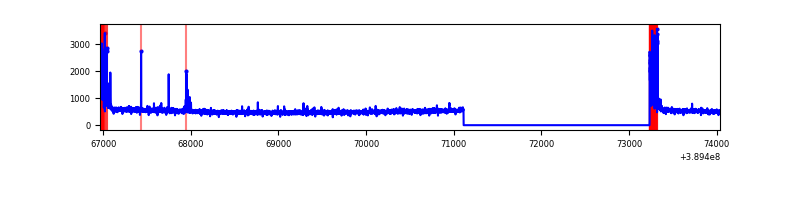 |
| D | 7073 | 4952 | 19 | 19 | 0.27% | 0.38% | 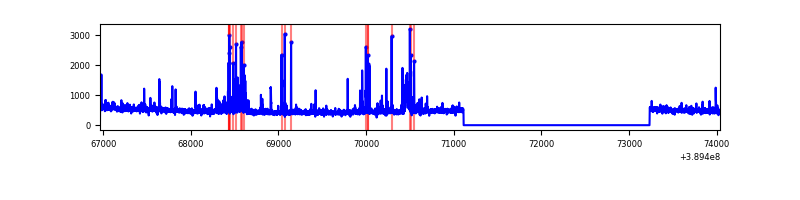 |
Top three noisy pixels from each quadrant. If the there are fewer than three noisy pixels in the level2.evt file, extra rows are filled as -1
| Pixel properties | Quadrant properties | ||||||
|---|---|---|---|---|---|---|---|
| Quadrant | DetID | PixID | Counts | Sigma | Mean | Median | Sigma |
| A | 10 | 83 | 142087 | 1183.7 | 597 | 588 | 119.5 |
| A | 8 | 6 | 7474 | 57.6 | 597 | 588 | 119.5 |
| A | 3 | 137 | 5803 | 43.63 | 597 | 588 | 119.5 |
| B | 5 | 172 | 381697 | 3413.5 | 591 | 575 | 111.7 |
| B | 5 | 255 | 64852 | 575.69 | 591 | 575 | 111.7 |
| B | 4 | 81 | 21471 | 187.15 | 591 | 575 | 111.7 |
| C | 0 | 10 | 253383 | 1857.82 | 583 | 589 | 136.1 |
| C | 15 | 214 | 209437 | 1534.85 | 583 | 589 | 136.1 |
| C | 1 | 23 | 21692 | 155.09 | 583 | 589 | 136.1 |
| D | 13 | 249 | 95225 | 665.48 | 585 | 569 | 142.2 |
| D | 2 | 250 | 60333 | 420.17 | 585 | 569 | 142.2 |
| D | 12 | 6 | 43547 | 302.16 | 585 | 569 | 142.2 |
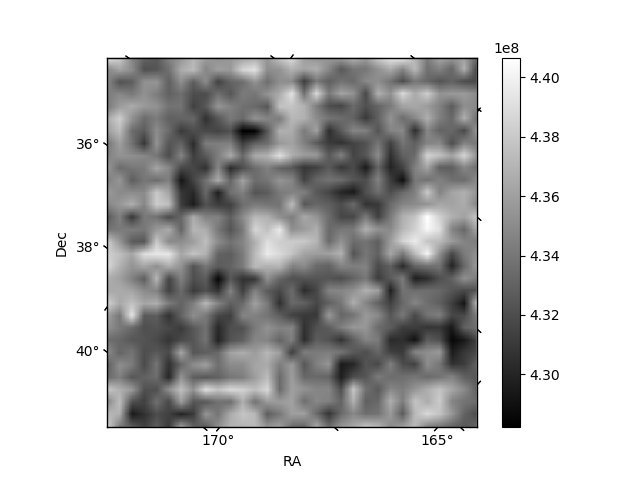
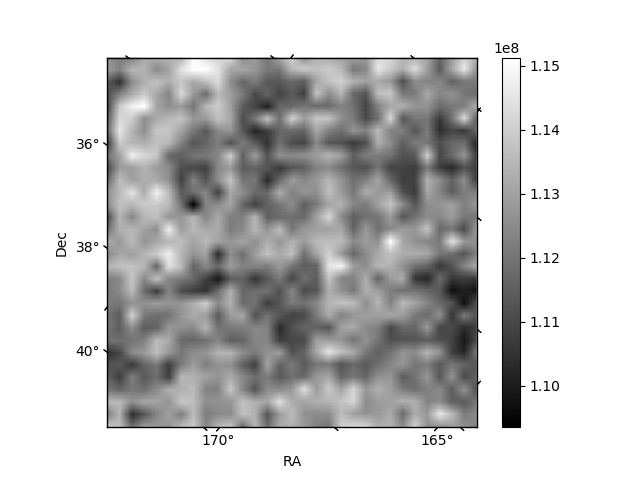
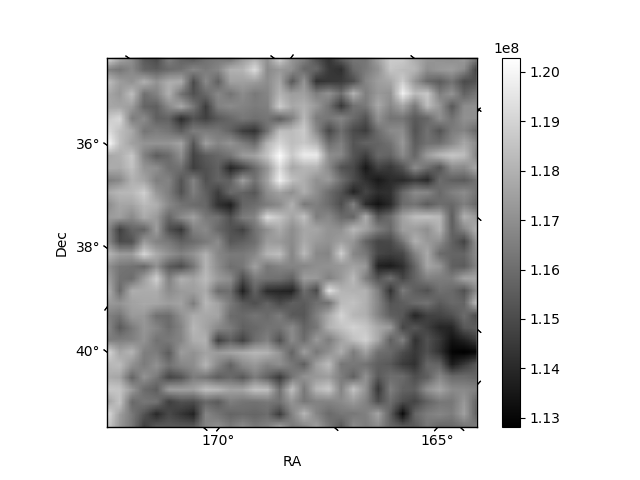
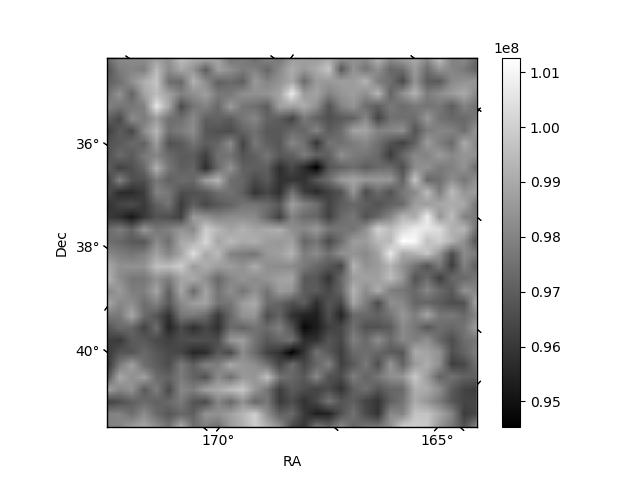
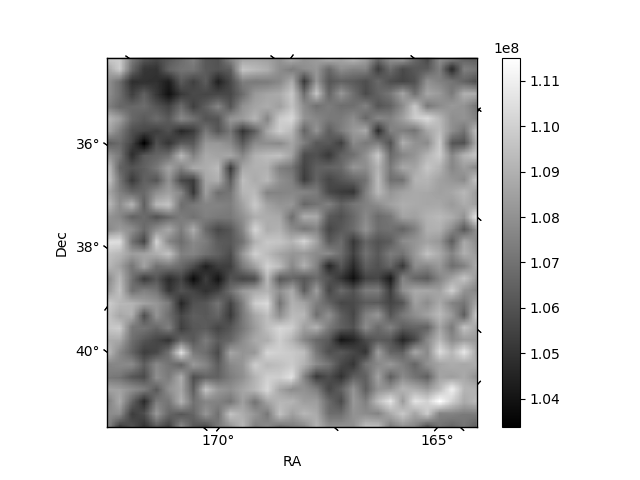
Histogram calculated using DETX and DETY for each event in the final _common_clean file
| Quadrant A | 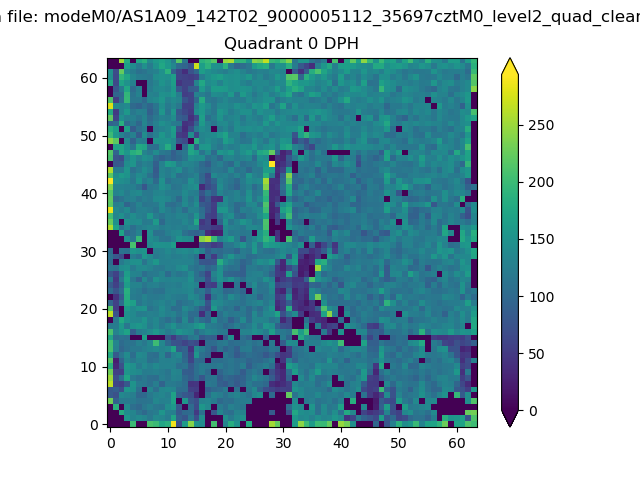 |
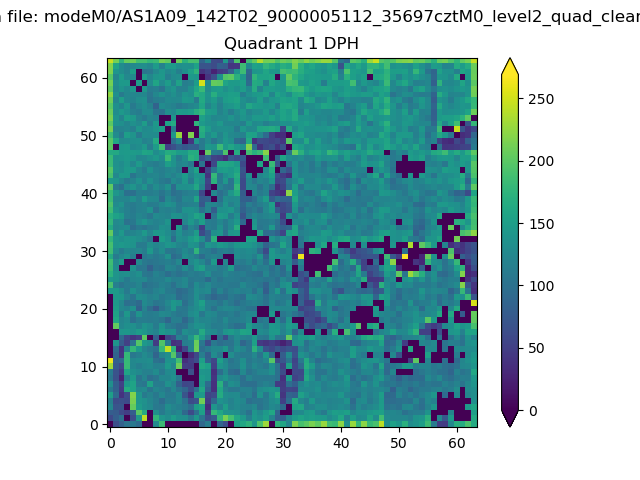 |
Quadrant B |
|---|---|---|---|
| Quadrant D | 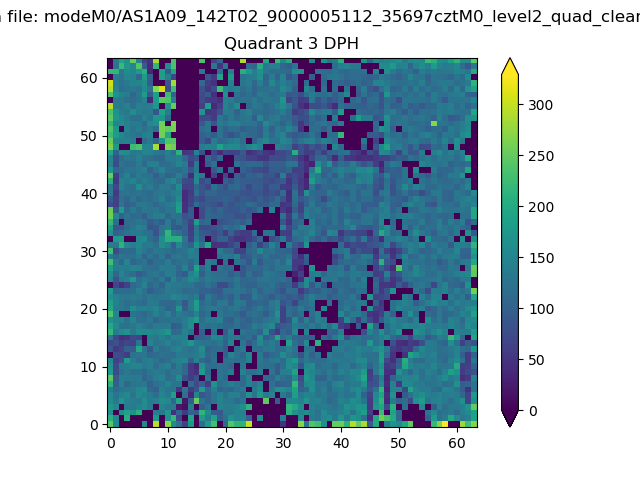 |
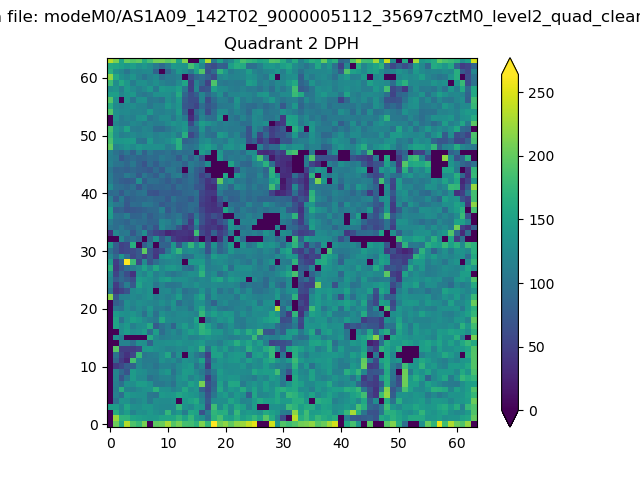 |
Quadrant C |
| Plot type | Count rate plots | Images |
|---|---|---|
| Comparison with Poisson distribution Blue bars denote a histogram of data divided into 1 sec bins. Red curve is a Poisson curve with rate = median count rate of data. |
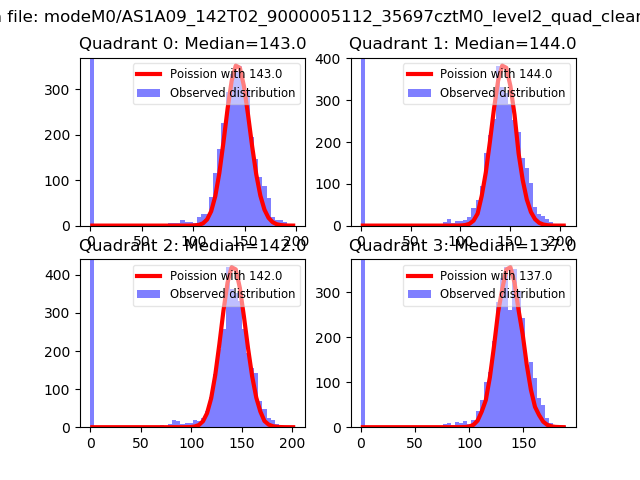 |
 |
| Quadrant-wise count rates Data is divided into 100 sec bins |
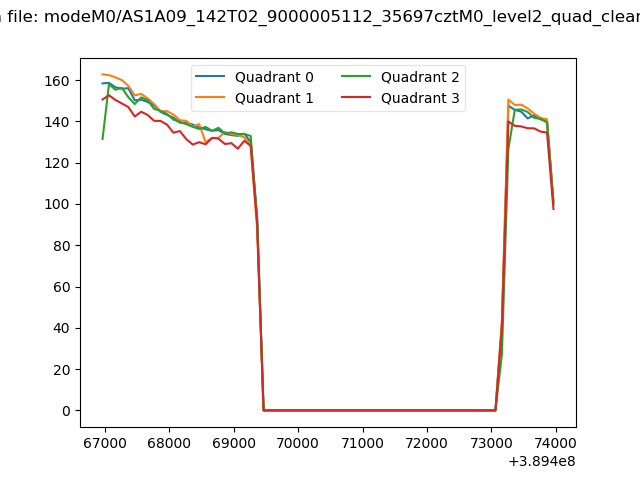 |
|
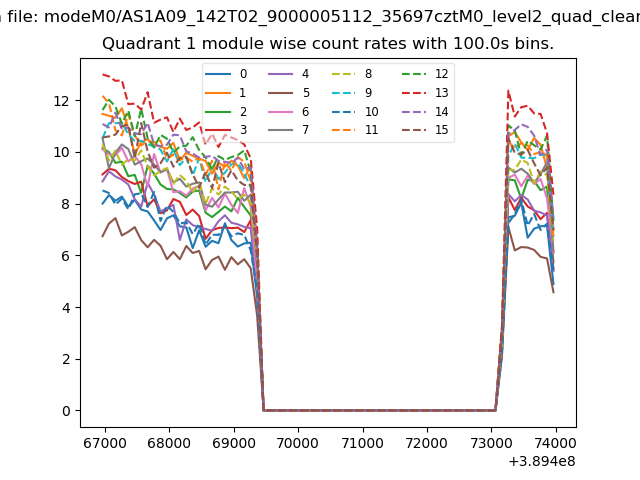
| Module-wise count rates for Quadrant A Data is divided into 100 sec bins |
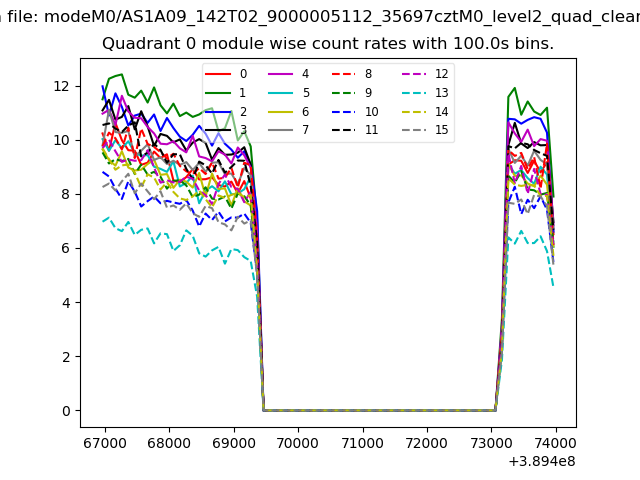 |
 |
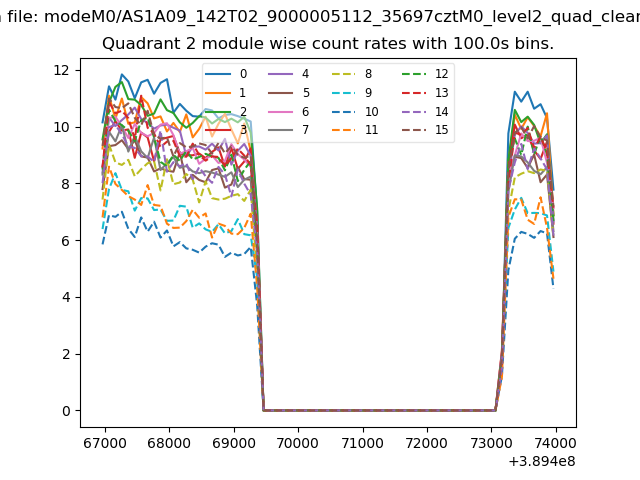
| Module-wise count rates for Quadrant B Data is divided into 100 sec bins |
 |
 |
| Module-wise count rates for Quadrant C Data is divided into 100 sec bins |
 |
 |
| Module-wise count rates for Quadrant D Data is divided into 100 sec bins |
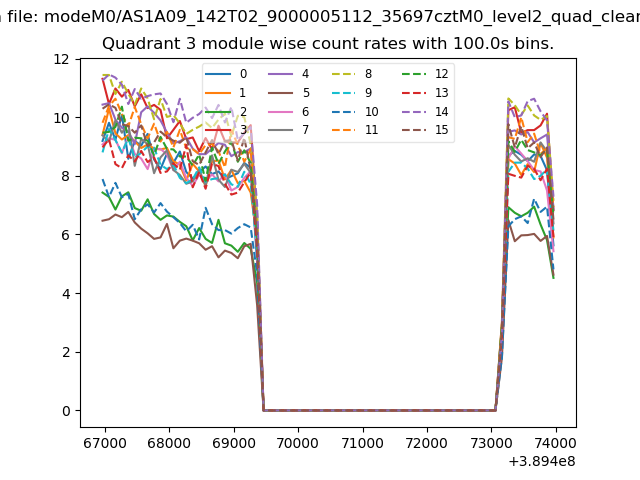 |
 |
| Parameter | Plot |
|---|---|
| CZT HV Monitor | 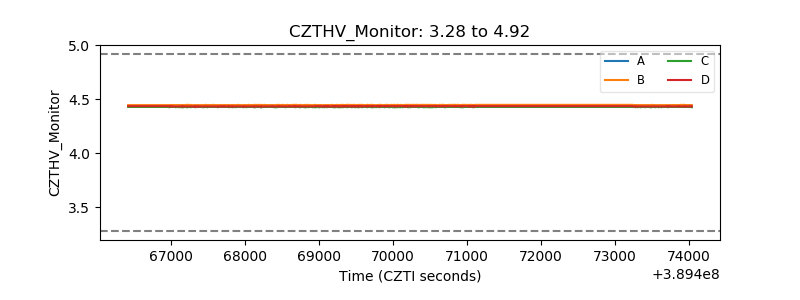 |
| D_VDD | 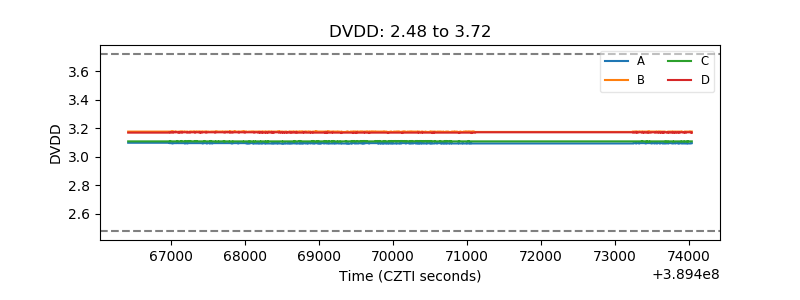 |
| Temperature 1 | 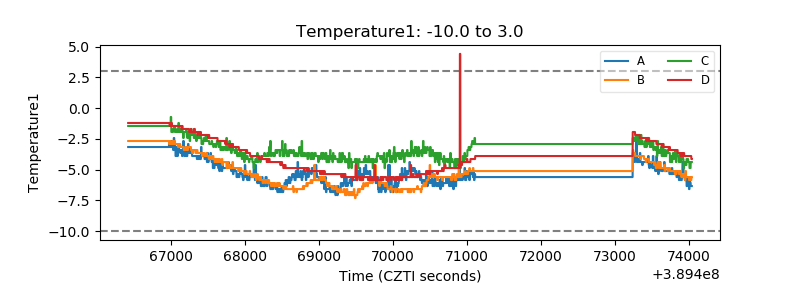 |
| Veto HV Monitor | 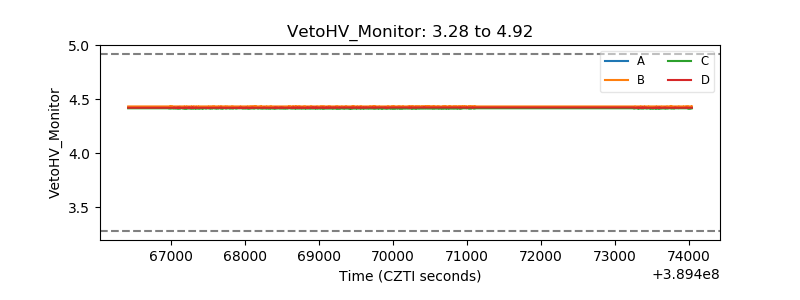 |
| Veto LLD | 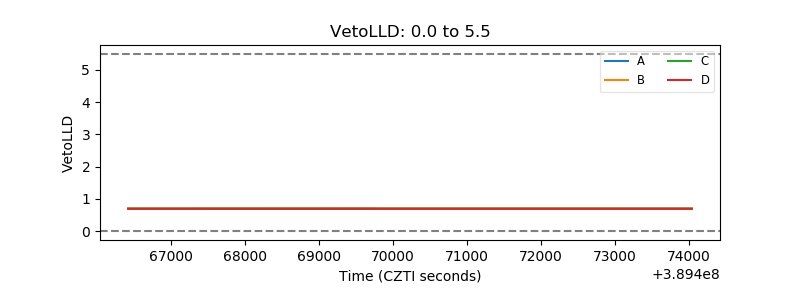 |
| Alpha Counter | 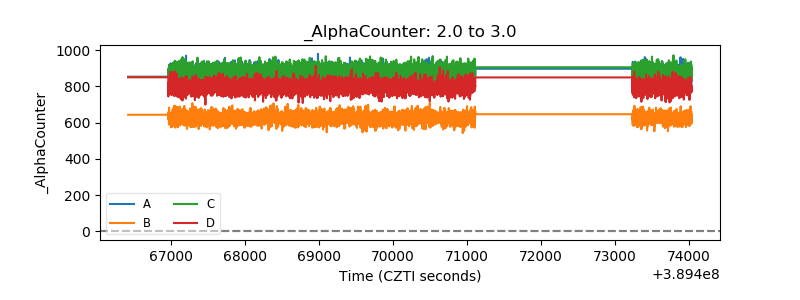 |
| _CPM_Rate | 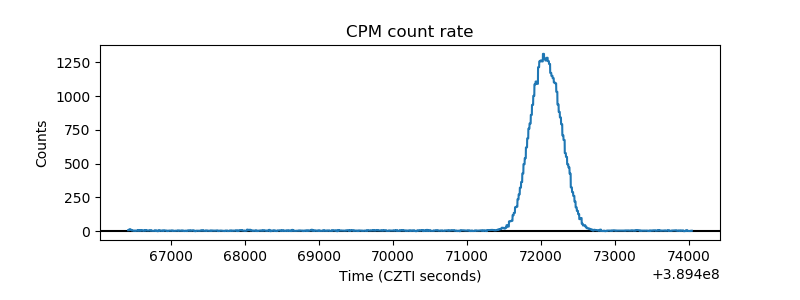 |
| CZT Counter | 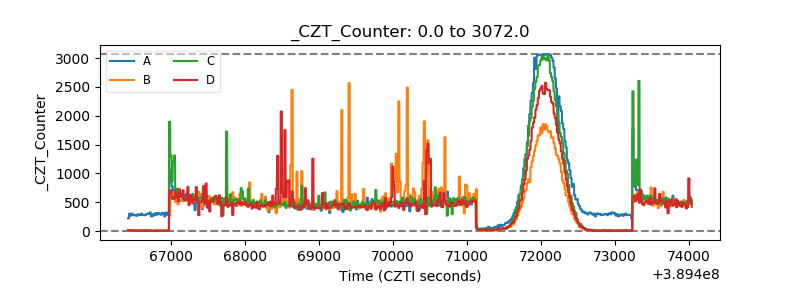 |
| +2.5 Volts monitor | 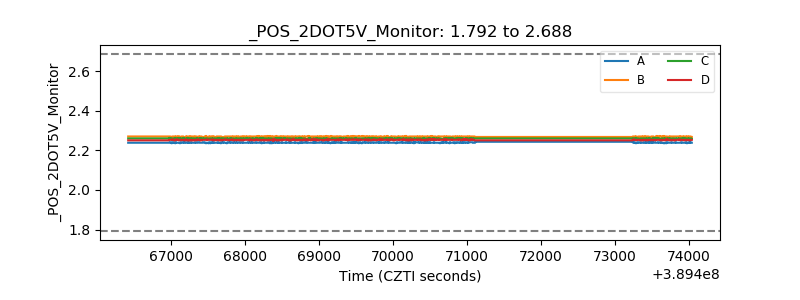 |
| +5 Volts monitor | 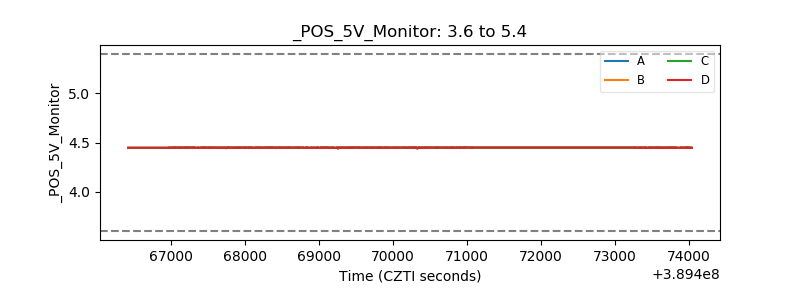 |
| _ROLL_ROT | 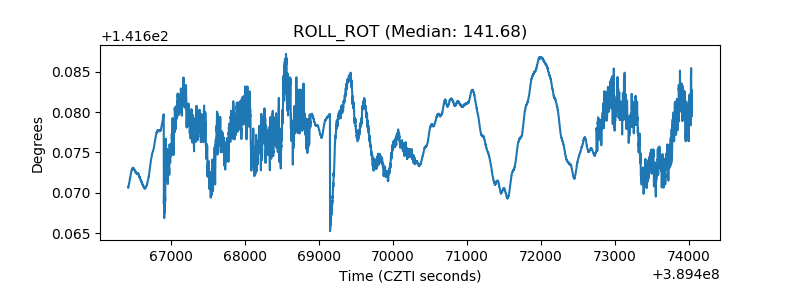 |
| _Roll_DEC | 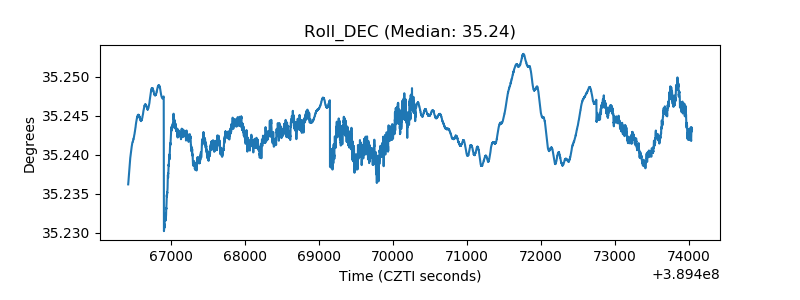 |
| _Roll_RA | 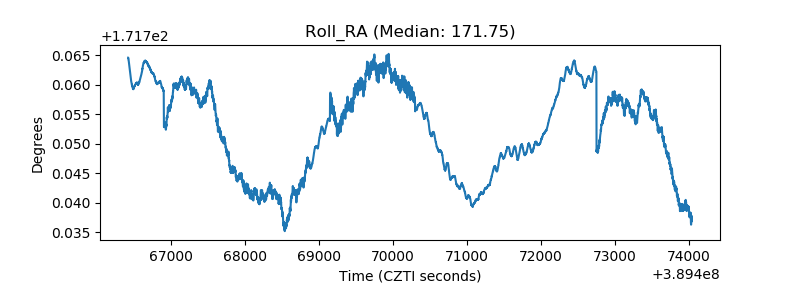 |
| Veto Counter | 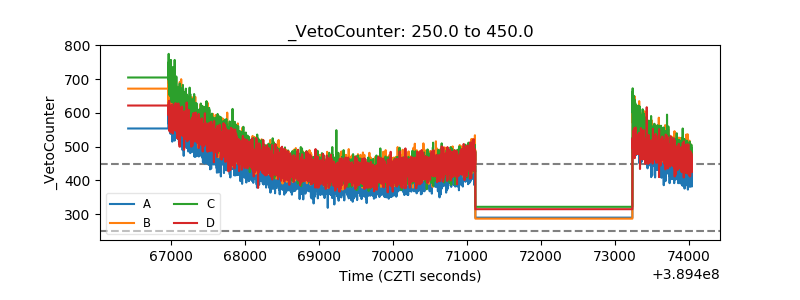 |