| Param | Original file | Final file |
|---|---|---|
| Filename | modeM0/AS1A09_142T02_9000005112_35696cztM0_level2.evt | modeM0/AS1A09_142T02_9000005112_35696cztM0_level2_quad_clean.evt |
| Size (bytes) | 400,694,400 | 82,287,360 |
| Size | 382.1 MB | 78.5 MB |
| Events in quadrant A | 2,542,024 | 548,280 |
| Events in quadrant B | 3,616,323 | 536,471 |
| Events in quadrant C | 2,830,484 | 539,033 |
| Events in quadrant D | 2,806,976 | 518,192 |
| Mode SS | |||
|---|---|---|---|
| Quadrant | BADHDUFLAG | Total packets | Discarded packets |
| A | 0 | 102 | 0 |
| B | 0 | 102 | 0 |
| C | 0 | 102 | 0 |
| D | 0 | 102 | 0 |
| Mode M0 | |||
|---|---|---|---|
| Quadrant | BADHDUFLAG | Total packets | Discarded packets |
| A | 0 | 10644 | 3 |
| B | 0 | 13757 | 2 |
| C | 0 | 11253 | 2 |
| D | 0 | 11472 | 2 |
| Mode M9 | |||
|---|---|---|---|
| Quadrant | BADHDUFLAG | Total packets | Discarded packets |
| A | 0 | 31 | 0 |
| B | 0 | 31 | 0 |
| C | 0 | 31 | 0 |
| D | 0 | 32 | 0 |
| Quadrant | Total seconds | Saturated seconds | Saturation percentage |
|---|---|---|---|
| A | 4988 | 5 | 0.100241% |
| B | 4988 | 362 | 7.257418% |
| C | 4988 | 78 | 1.563753% |
| D | 4988 | 40 | 0.801925% |
Noise dominated data is calculated using 1-second bins in cleaned event files. If a bin has >2000 counts, and if more than 50% of those come from <1% of pixels, then it is considered to be noise-dominated and hence unusable.
| Quadrant | # 1 sec bins | Bins with >0 counts | Bins with >2000 counts | High rate bins dominated by noise | Noise dominated (total time) | Noise dominated (detector-on time) | Marked lightcurve |
|---|---|---|---|---|---|---|---|
| A | 7080 | 4989 | 0 | 0 | 0.00% | 0.00% | 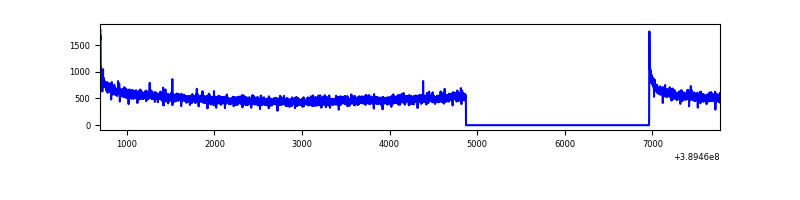 |
| B | 7080 | 4989 | 303 | 303 | 4.28% | 6.07% | 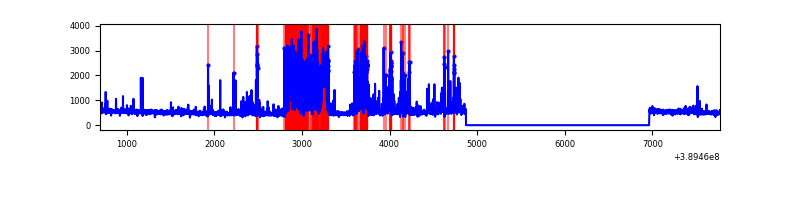 |
| C | 7080 | 4989 | 61 | 61 | 0.86% | 1.22% | 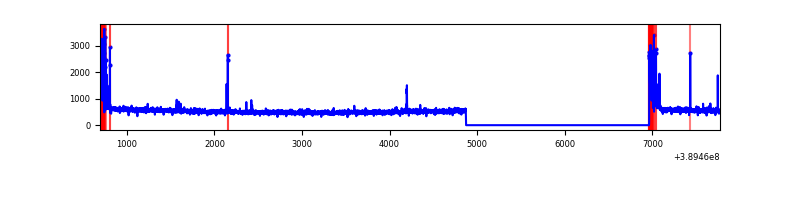 |
| D | 7080 | 4989 | 36 | 36 | 0.51% | 0.72% | 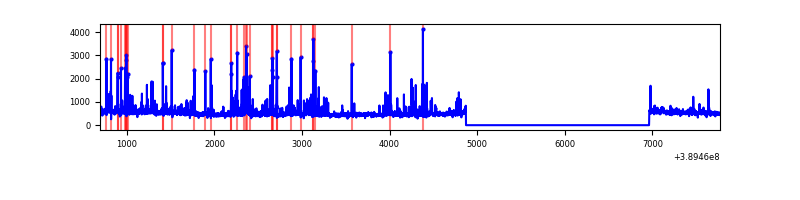 |
Top three noisy pixels from each quadrant. If the there are fewer than three noisy pixels in the level2.evt file, extra rows are filled as -1
| Pixel properties | Quadrant properties | ||||||
|---|---|---|---|---|---|---|---|
| Quadrant | DetID | PixID | Counts | Sigma | Mean | Median | Sigma |
| A | 10 | 83 | 143305 | 1156.71 | 619 | 608 | 123.4 |
| A | 3 | 137 | 6012 | 43.8 | 619 | 608 | 123.4 |
| A | 0 | 226 | 5279 | 37.86 | 619 | 608 | 123.4 |
| B | 5 | 172 | 1034595 | 9239.46 | 598 | 583 | 111.9 |
| B | 5 | 255 | 154030 | 1371.13 | 598 | 583 | 111.9 |
| B | 3 | 112 | 42134 | 371.28 | 598 | 583 | 111.9 |
| C | 0 | 10 | 237261 | 1698.76 | 605 | 609 | 139.3 |
| C | 15 | 214 | 208524 | 1492.48 | 605 | 609 | 139.3 |
| C | 1 | 241 | 14345 | 98.6 | 605 | 609 | 139.3 |
| D | 2 | 250 | 110744 | 749.78 | 608 | 592 | 146.9 |
| D | 12 | 6 | 76974 | 519.91 | 608 | 592 | 146.9 |
| D | 13 | 249 | 75868 | 512.38 | 608 | 592 | 146.9 |
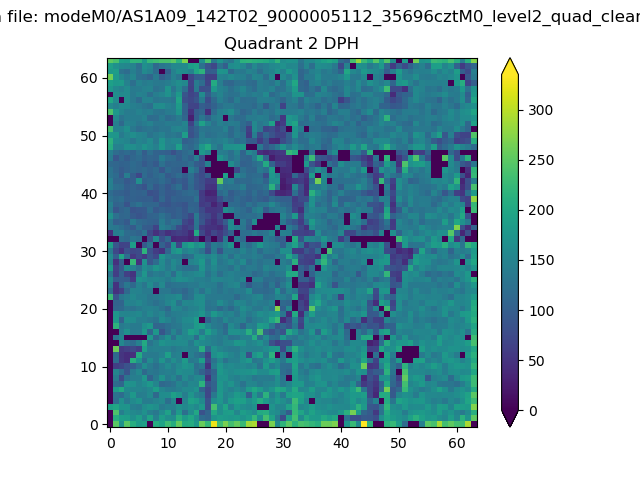
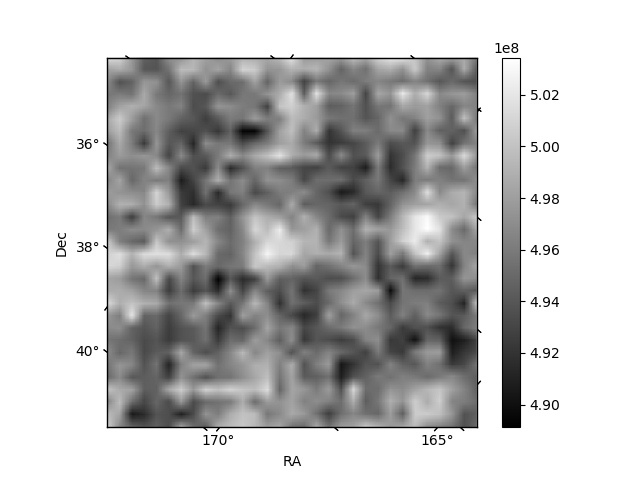
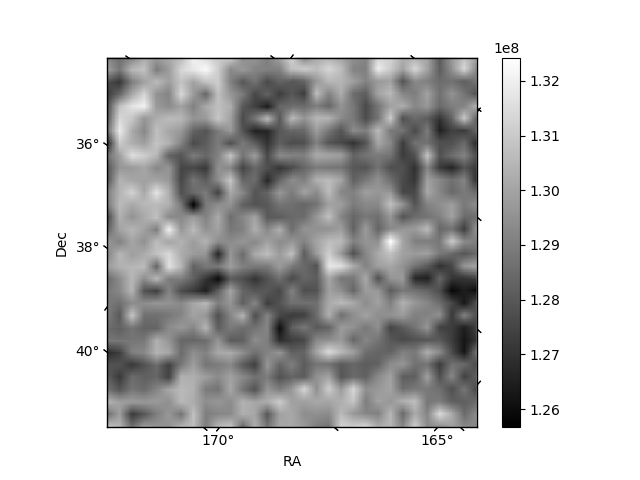
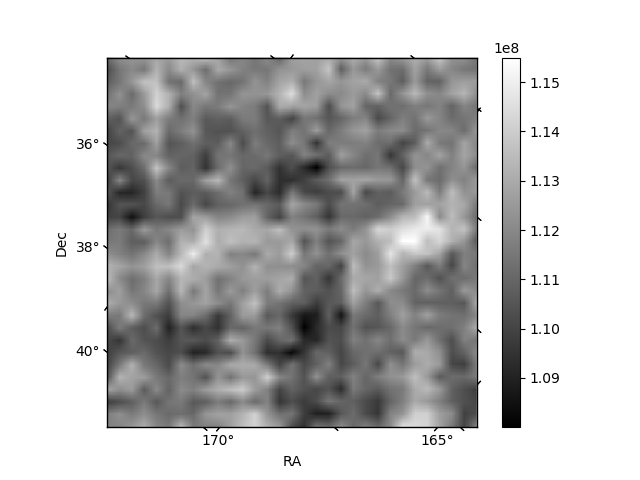
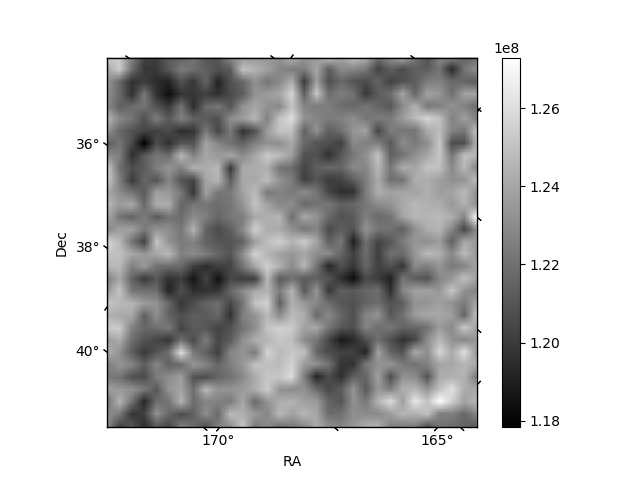
Histogram calculated using DETX and DETY for each event in the final _common_clean file
| Quadrant A | 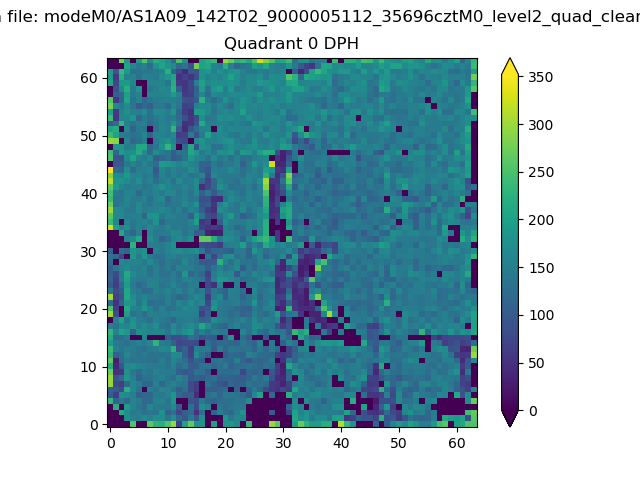 |
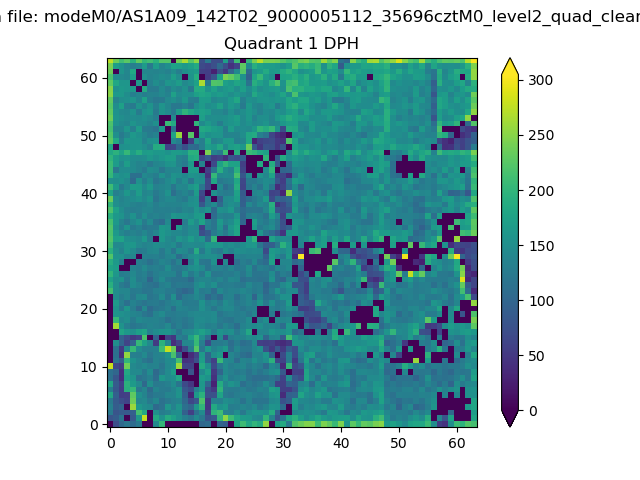 |
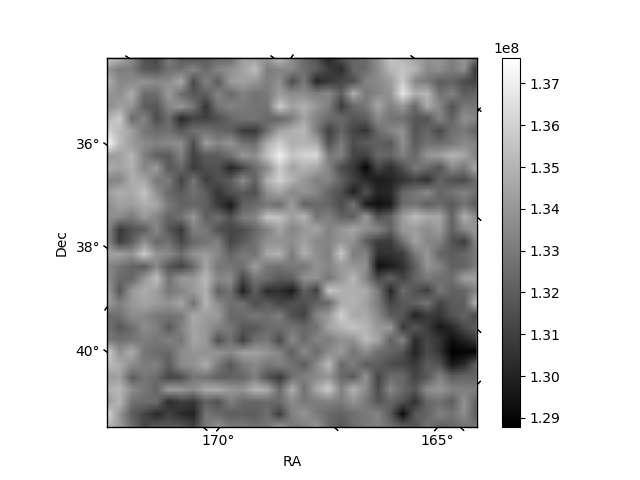
Quadrant B |
|---|---|---|---|
| Quadrant D | 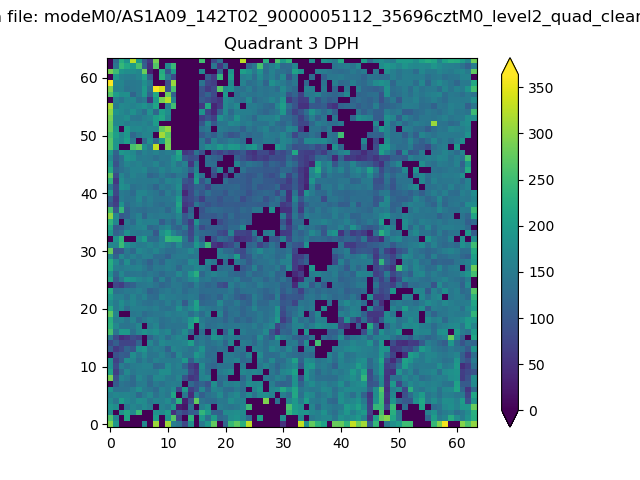 |
 |
Quadrant C |
| Plot type | Count rate plots | Images |
|---|---|---|
| Comparison with Poisson distribution Blue bars denote a histogram of data divided into 1 sec bins. Red curve is a Poisson curve with rate = median count rate of data. |
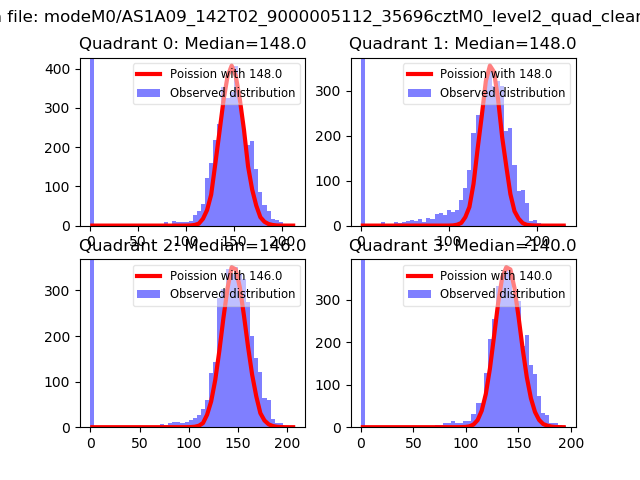 |
 |
| Quadrant-wise count rates Data is divided into 100 sec bins |
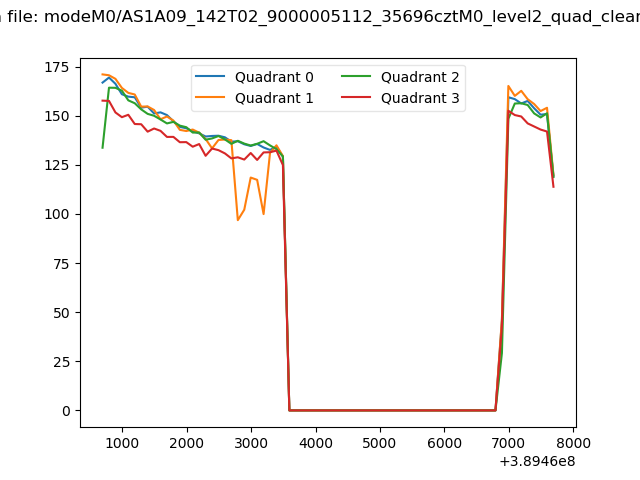 |
|
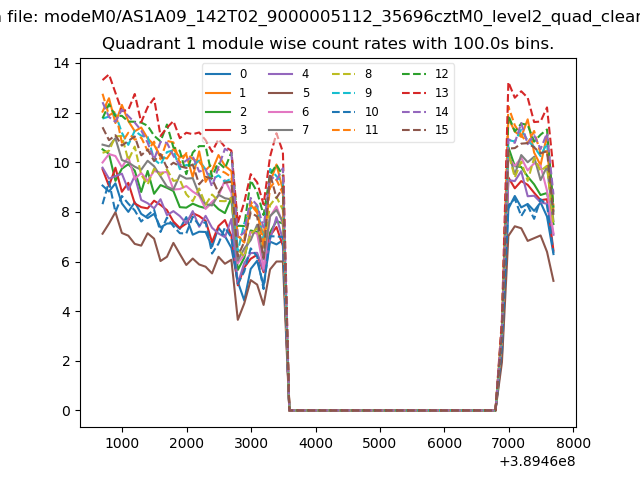
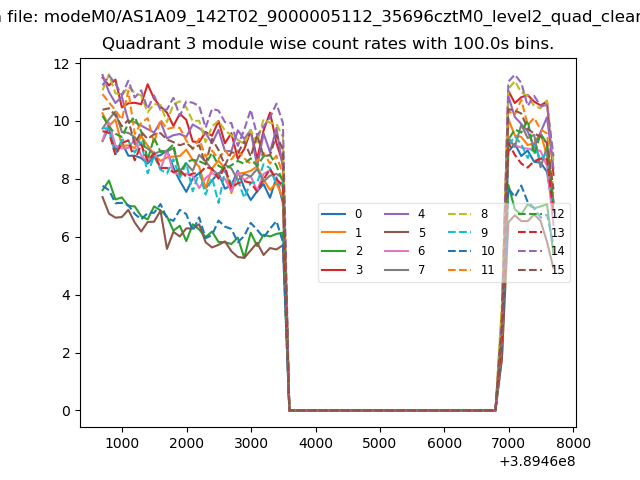
| Module-wise count rates for Quadrant A Data is divided into 100 sec bins |
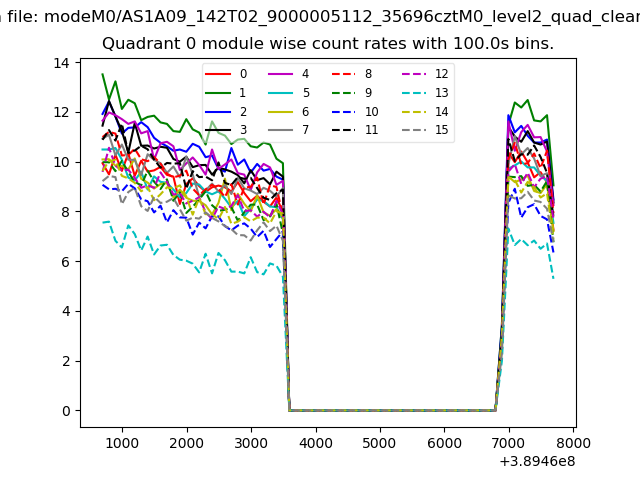 |
 |
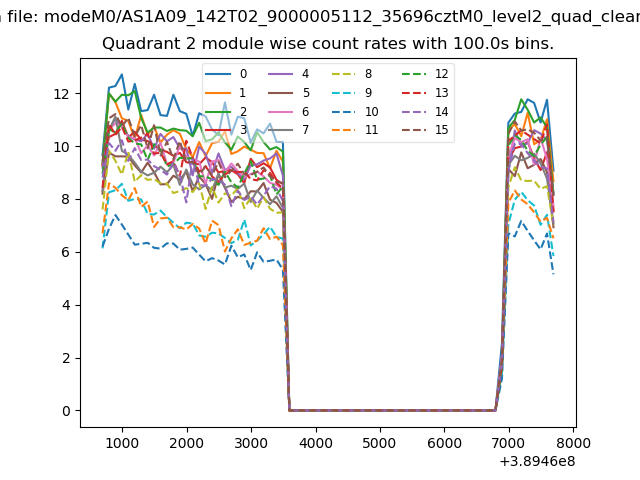
| Module-wise count rates for Quadrant B Data is divided into 100 sec bins |
 |
 |
| Module-wise count rates for Quadrant C Data is divided into 100 sec bins |
 |
 |
| Module-wise count rates for Quadrant D Data is divided into 100 sec bins |
 |
 |
| Parameter | Plot |
|---|---|
| CZT HV Monitor | 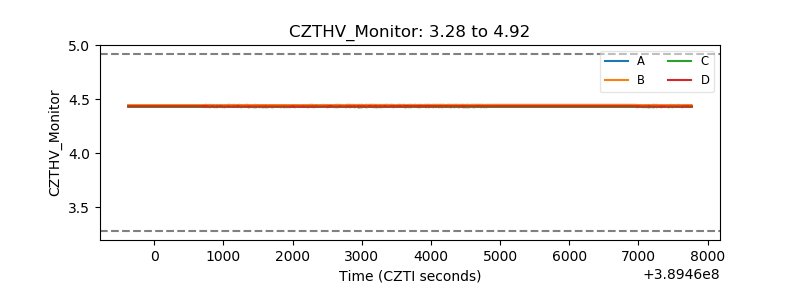 |
| D_VDD | 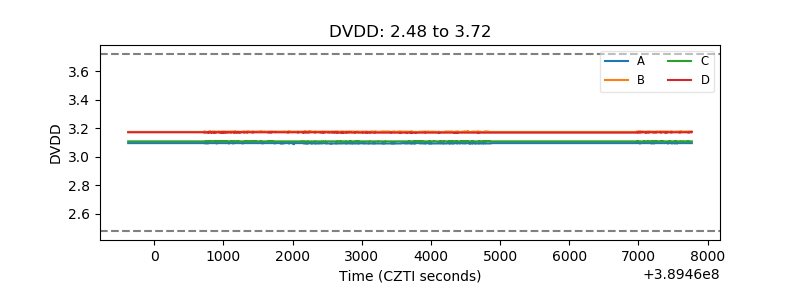 |
| Temperature 1 | 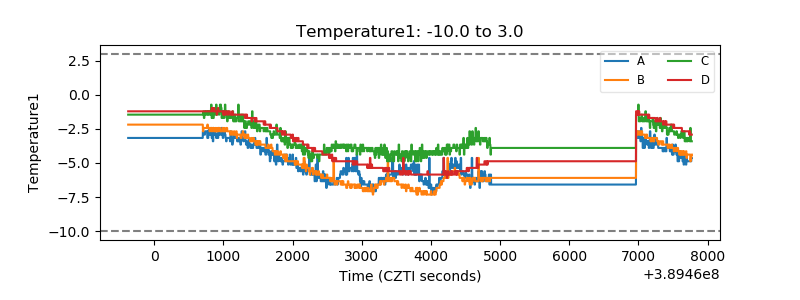 |
| Veto HV Monitor | 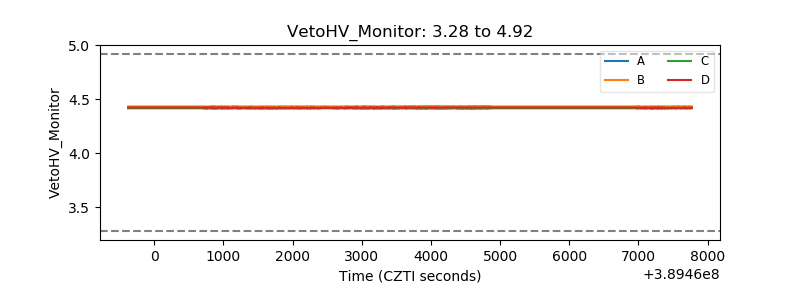 |
| Veto LLD | 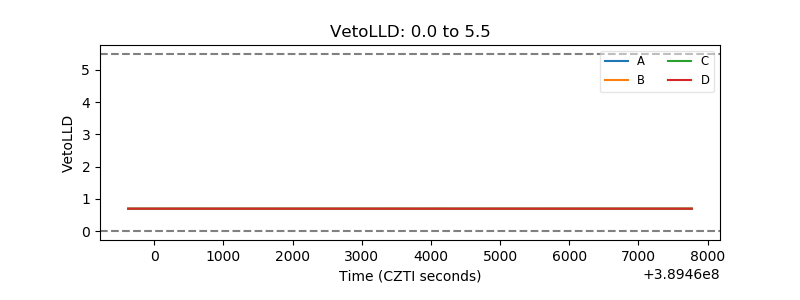 |
| Alpha Counter | 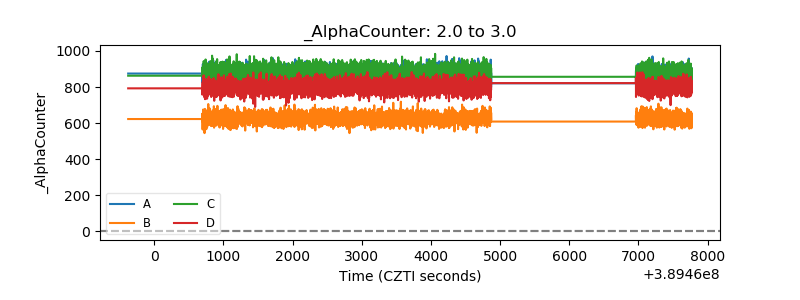 |
| _CPM_Rate | 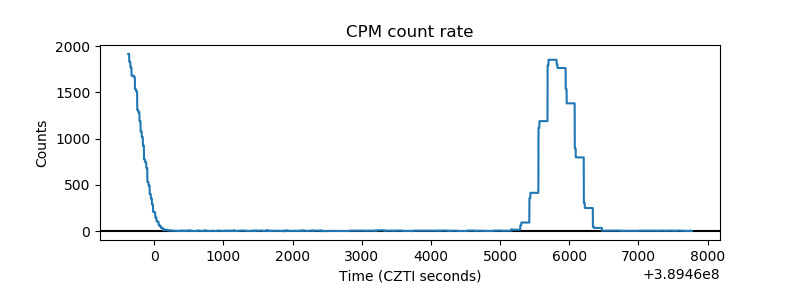 |
| CZT Counter | 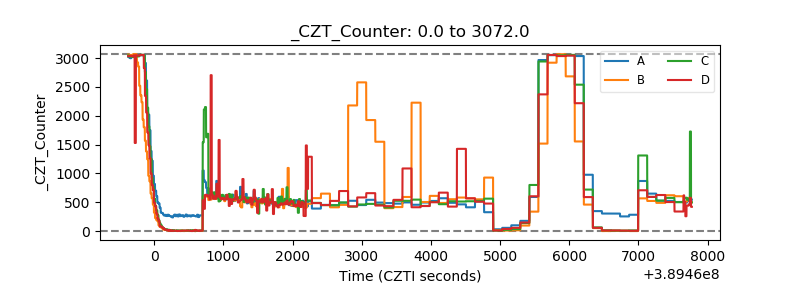 |
| +2.5 Volts monitor | 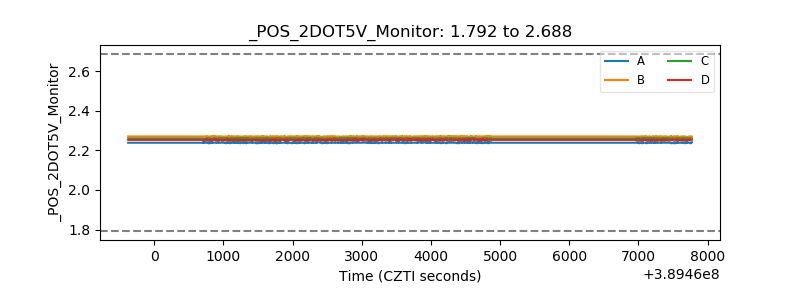 |
| +5 Volts monitor | 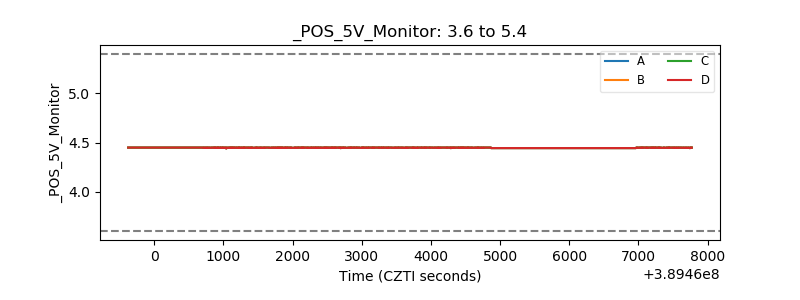 |
| _ROLL_ROT | 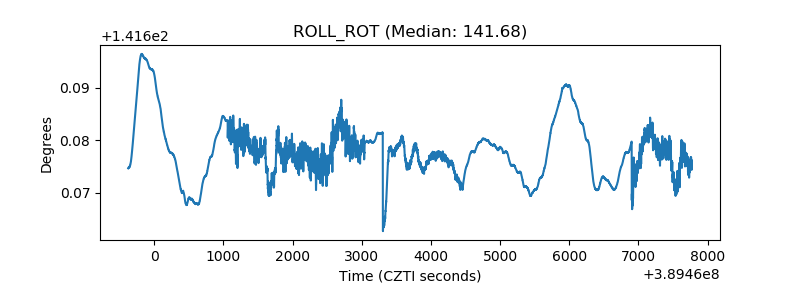 |
| _Roll_DEC | 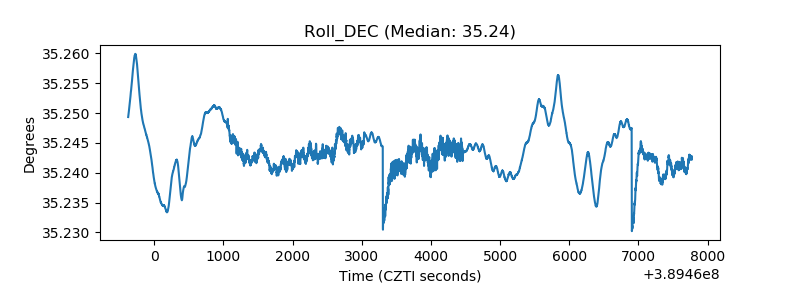 |
| _Roll_RA | 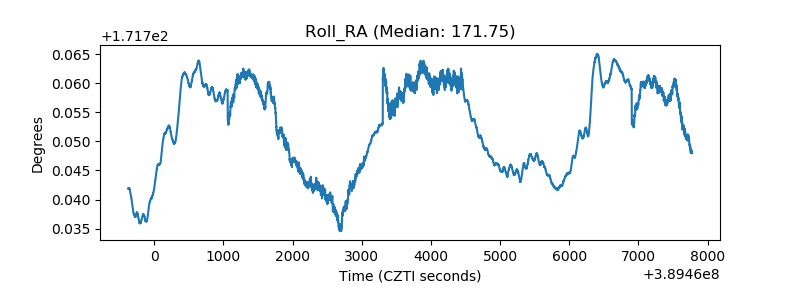 |
| Veto Counter | 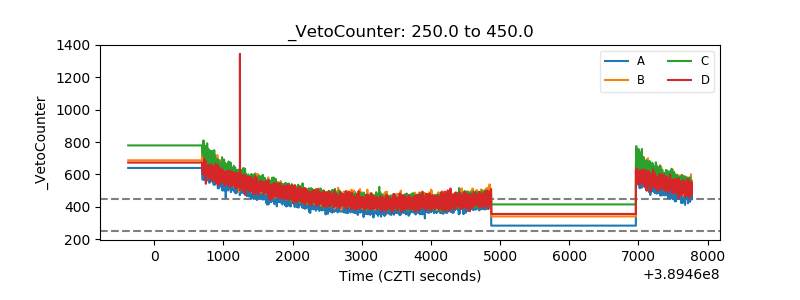 |