| Param | Original file | Final file |
|---|---|---|
| Filename | modeM0/AS1A09_142T02_9000005112_35695cztM0_level2.evt | modeM0/AS1A09_142T02_9000005112_35695cztM0_level2_quad_clean.evt |
| Size (bytes) | 826,312,320 | 180,817,920 |
| Size | 788.0 MB | 172.4 MB |
| Events in quadrant A | 5,412,552 | 1,211,205 |
| Events in quadrant B | 6,317,633 | 1,200,272 |
| Events in quadrant C | 5,707,007 | 1,193,723 |
| Events in quadrant D | 6,852,743 | 1,119,287 |
| Mode SS | |||
|---|---|---|---|
| Quadrant | BADHDUFLAG | Total packets | Discarded packets |
| A | 0 | 224 | 0 |
| B | 0 | 224 | 0 |
| C | 0 | 224 | 0 |
| D | 0 | 224 | 0 |
| Mode M0 | |||
|---|---|---|---|
| Quadrant | BADHDUFLAG | Total packets | Discarded packets |
| A | 0 | 22854 | 6 |
| B | 0 | 25409 | 3 |
| C | 0 | 23209 | 3 |
| D | 0 | 27457 | 3 |
| Mode M9 | |||
|---|---|---|---|
| Quadrant | BADHDUFLAG | Total packets | Discarded packets |
| A | 0 | 55 | 0 |
| B | 0 | 55 | 0 |
| C | 0 | 55 | 0 |
| D | 0 | 55 | 0 |
| Quadrant | Total seconds | Saturated seconds | Saturation percentage |
|---|---|---|---|
| A | 10861 | 17 | 0.156523% |
| B | 10862 | 233 | 2.145093% |
| C | 10862 | 83 | 0.764132% |
| D | 10862 | 464 | 4.271773% |
Noise dominated data is calculated using 1-second bins in cleaned event files. If a bin has >2000 counts, and if more than 50% of those come from <1% of pixels, then it is considered to be noise-dominated and hence unusable.
| Quadrant | # 1 sec bins | Bins with >0 counts | Bins with >2000 counts | High rate bins dominated by noise | Noise dominated (total time) | Noise dominated (detector-on time) | Marked lightcurve |
|---|---|---|---|---|---|---|---|
| A | 16418 | 10865 | 1 | 1 | 0.01% | 0.01% | 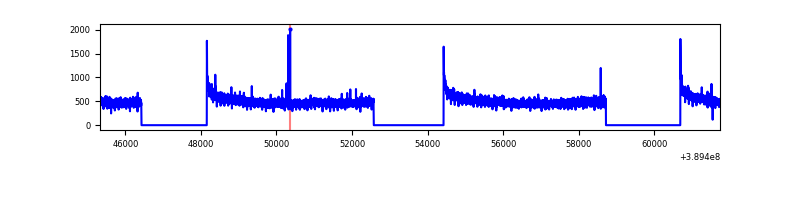 |
| B | 16418 | 10865 | 182 | 182 | 1.11% | 1.68% | 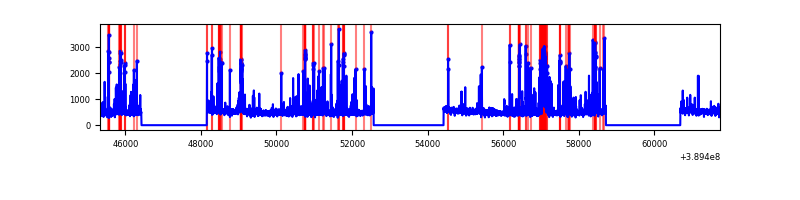 |
| C | 16418 | 10865 | 65 | 65 | 0.40% | 0.60% | 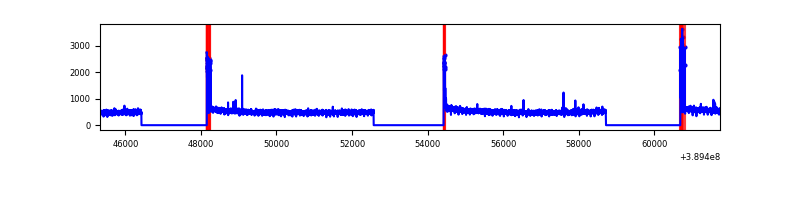 |
| D | 16418 | 10865 | 437 | 437 | 2.66% | 4.02% | 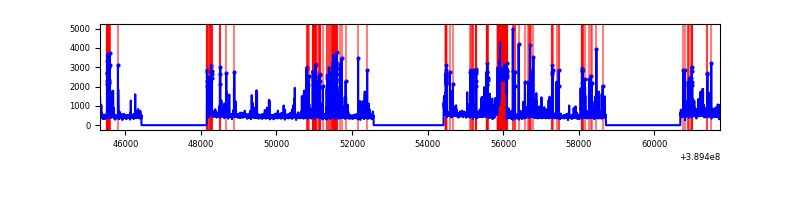 |
Top three noisy pixels from each quadrant. If the there are fewer than three noisy pixels in the level2.evt file, extra rows are filled as -1
| Pixel properties | Quadrant properties | ||||||
|---|---|---|---|---|---|---|---|
| Quadrant | DetID | PixID | Counts | Sigma | Mean | Median | Sigma |
| A | 10 | 83 | 258108 | 981.95 | 1318 | 1295 | 261.5 |
| A | 13 | 6 | 33468 | 123.02 | 1318 | 1295 | 261.5 |
| A | 15 | 169 | 13303 | 45.91 | 1318 | 1295 | 261.5 |
| B | 5 | 172 | 769801 | 3157.93 | 1289 | 1255 | 243.4 |
| B | 5 | 255 | 277958 | 1136.96 | 1289 | 1255 | 243.4 |
| B | 3 | 112 | 58337 | 234.55 | 1289 | 1255 | 243.4 |
| C | 15 | 214 | 448519 | 1515.61 | 1282 | 1294 | 295.1 |
| C | 0 | 10 | 247945 | 835.88 | 1282 | 1294 | 295.1 |
| C | 4 | 254 | 8766 | 25.32 | 1282 | 1294 | 295.1 |
| D | 8 | 230 | 643539 | 2086.76 | 1267 | 1236 | 307.8 |
| D | 12 | 6 | 462189 | 1497.58 | 1267 | 1236 | 307.8 |
| D | 13 | 249 | 286929 | 928.18 | 1267 | 1236 | 307.8 |
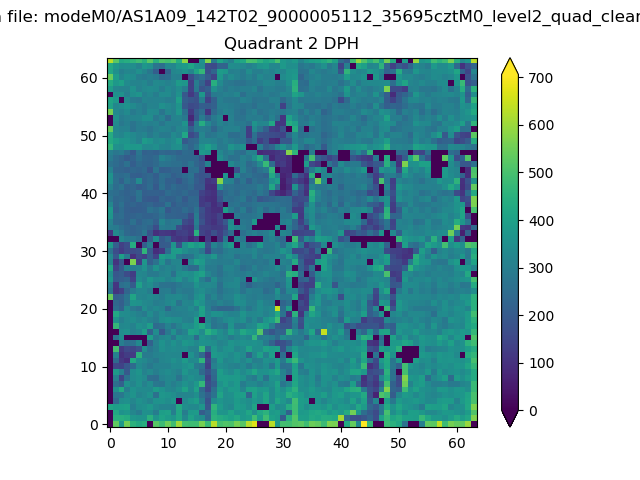
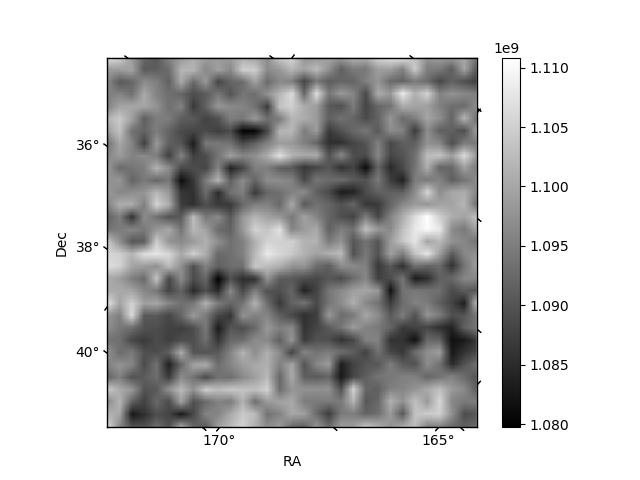
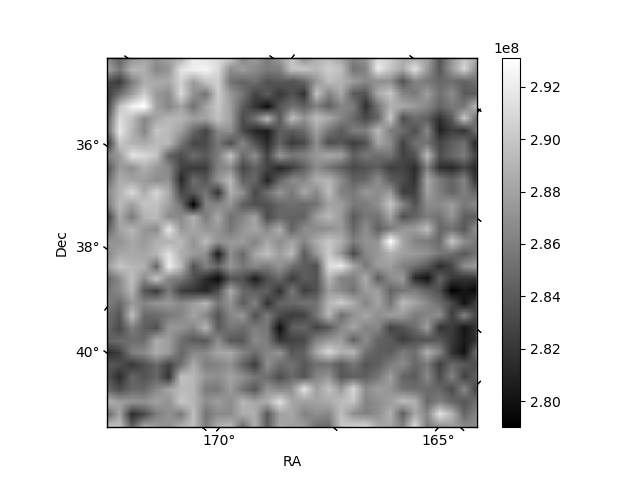
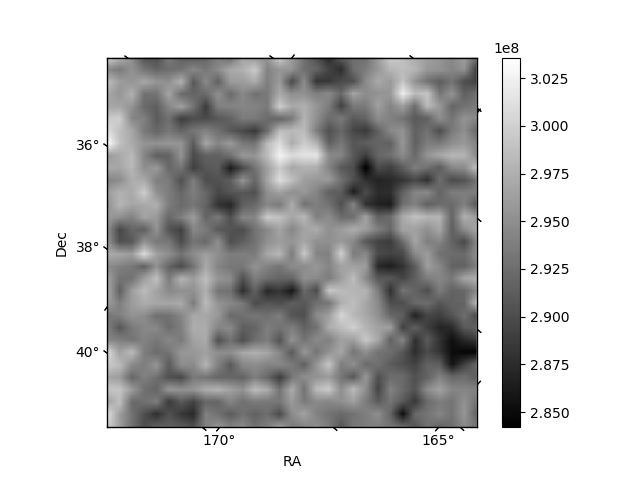
Histogram calculated using DETX and DETY for each event in the final _common_clean file
| Quadrant A | 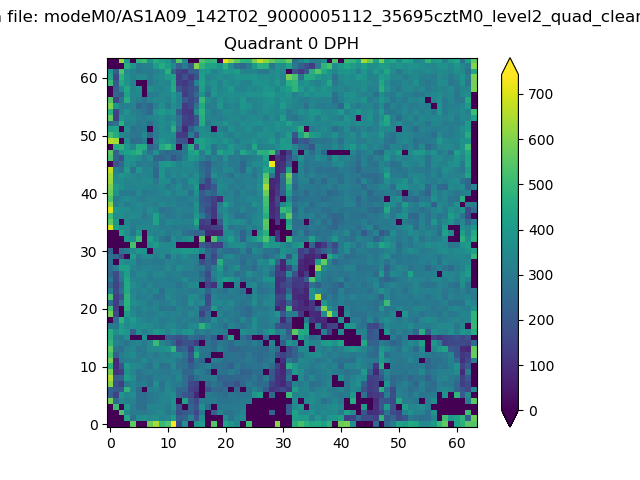 |
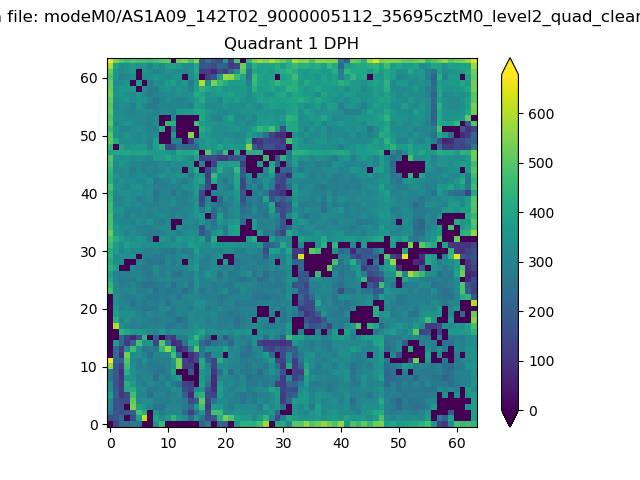 |
Quadrant B |
|---|---|---|---|
| Quadrant D | 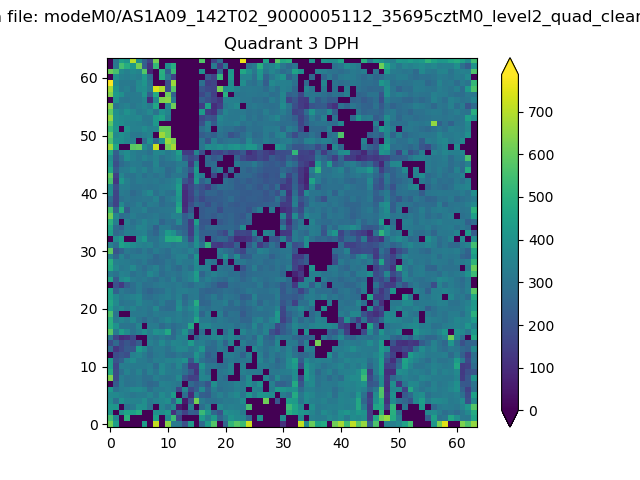 |
 |
Quadrant C |
| Plot type | Count rate plots | Images |
|---|---|---|
| Comparison with Poisson distribution Blue bars denote a histogram of data divided into 1 sec bins. Red curve is a Poisson curve with rate = median count rate of data. |
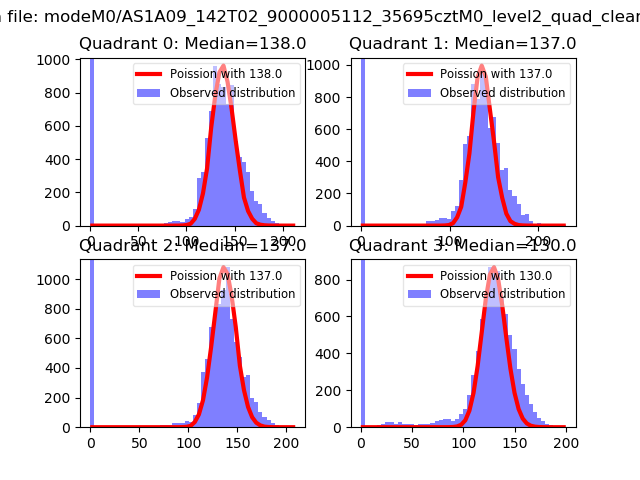 |
 |
| Quadrant-wise count rates Data is divided into 100 sec bins |
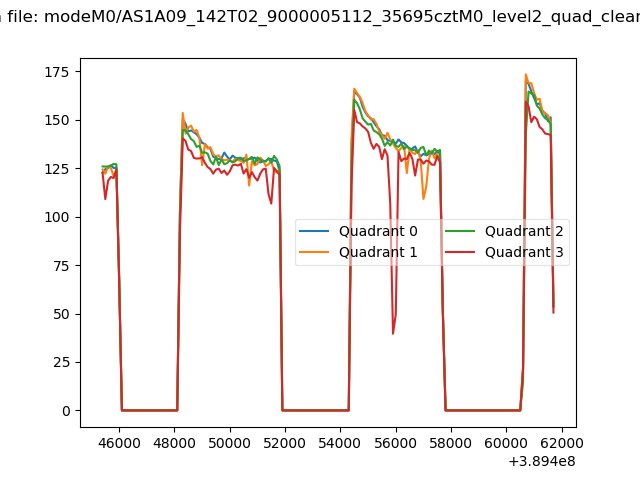 |
|
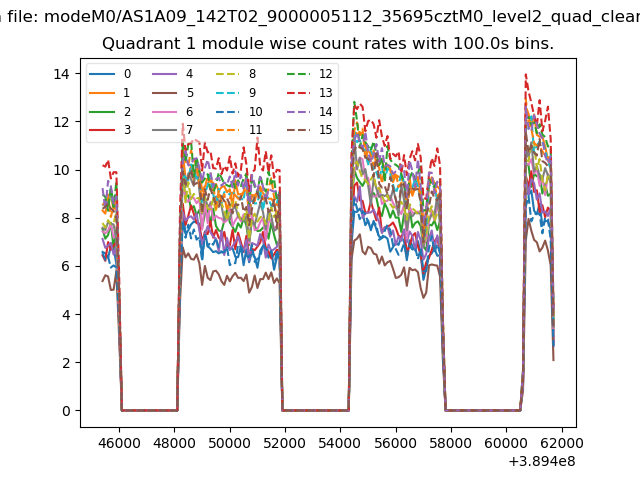
| Module-wise count rates for Quadrant A Data is divided into 100 sec bins |
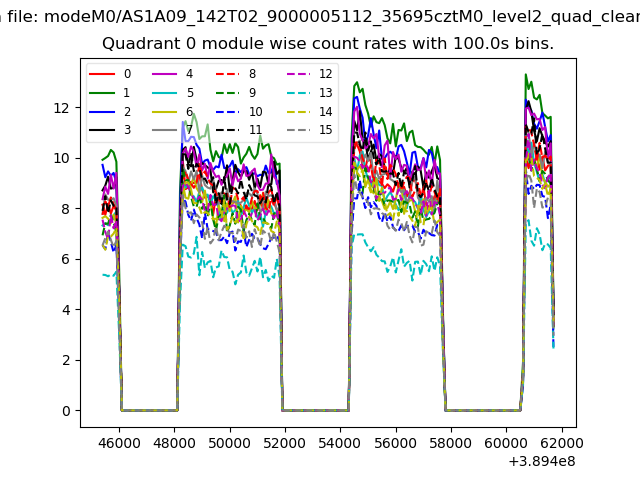 |
 |
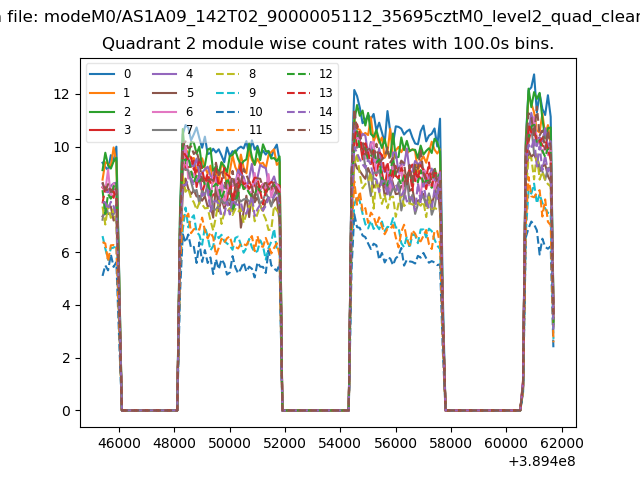
| Module-wise count rates for Quadrant B Data is divided into 100 sec bins |
 |
 |
| Module-wise count rates for Quadrant C Data is divided into 100 sec bins |
 |
 |
| Module-wise count rates for Quadrant D Data is divided into 100 sec bins |
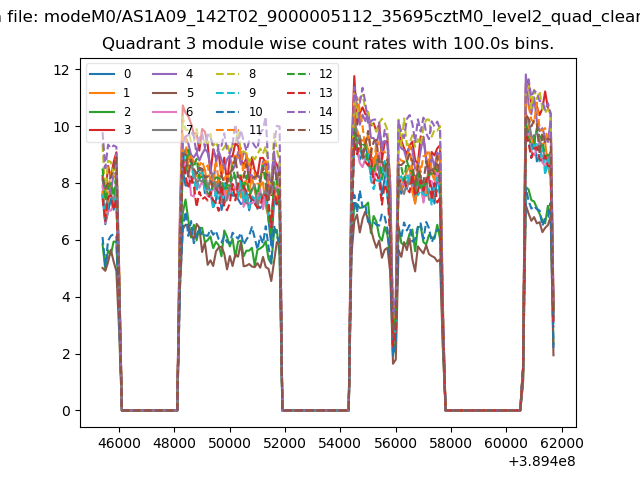 |
 |
| Parameter | Plot |
|---|---|
| CZT HV Monitor |  |
| D_VDD | 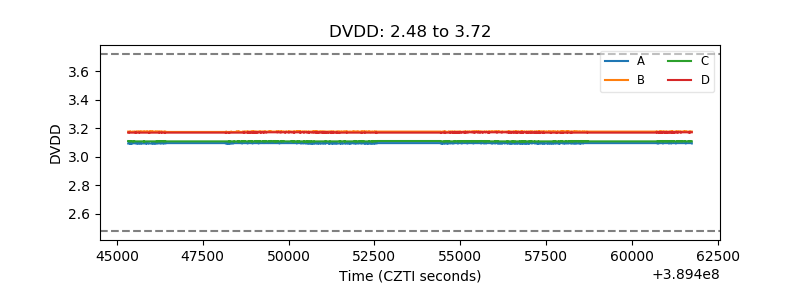 |
| Temperature 1 | 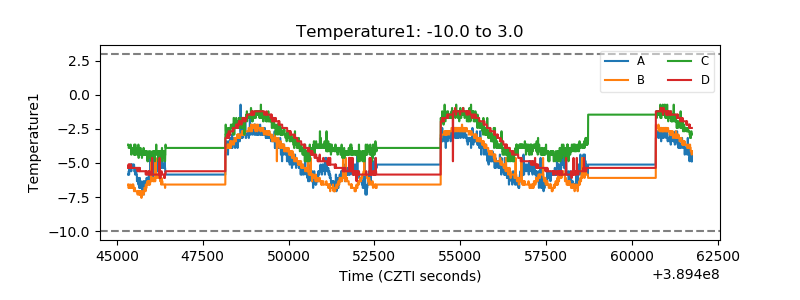 |
| Veto HV Monitor | 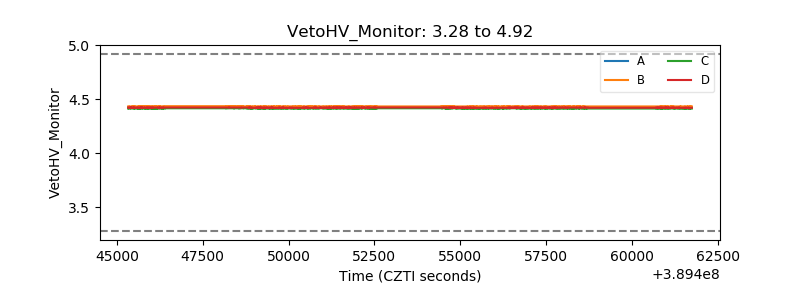 |
| Veto LLD | 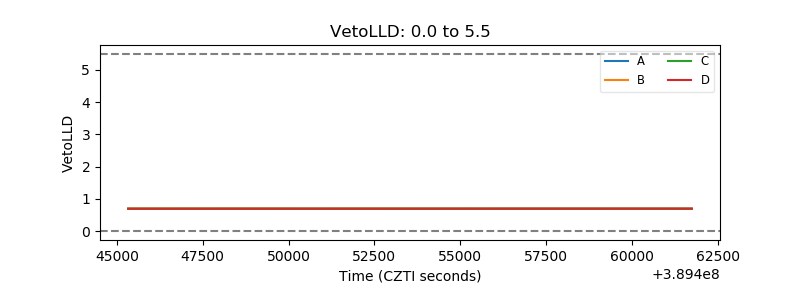 |
| Alpha Counter | 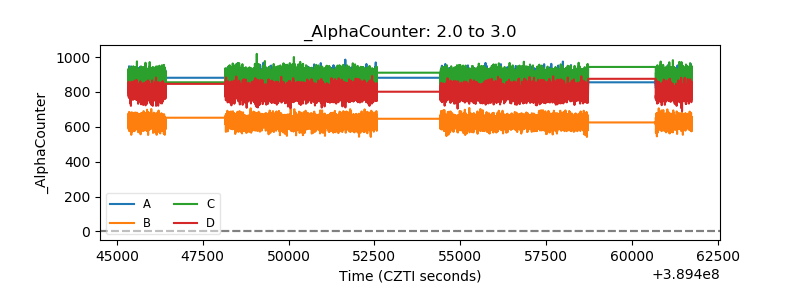 |
| _CPM_Rate | 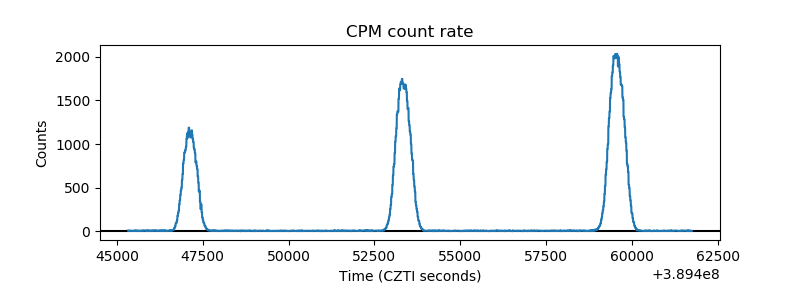 |
| CZT Counter | 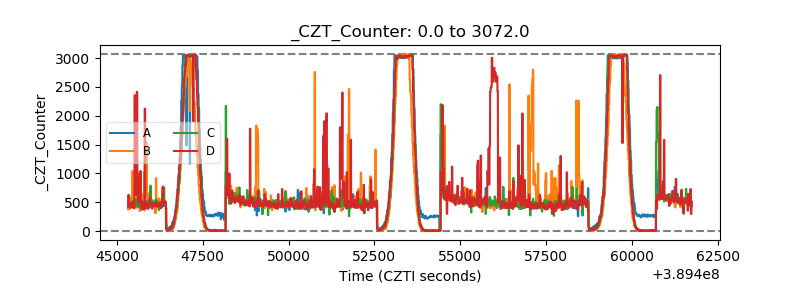 |
| +2.5 Volts monitor | 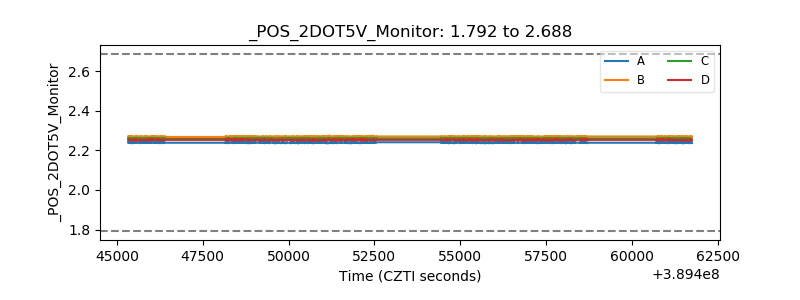 |
| +5 Volts monitor | 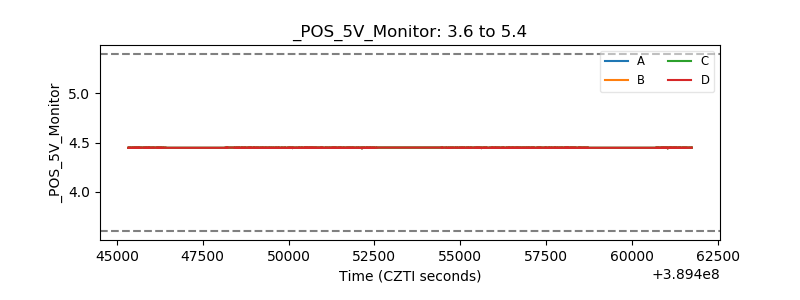 |
| _ROLL_ROT | 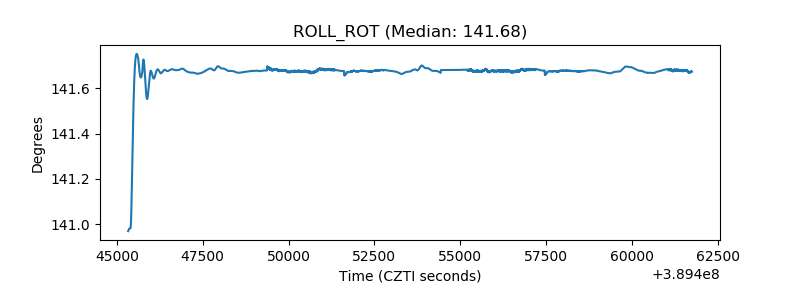 |
| _Roll_DEC | 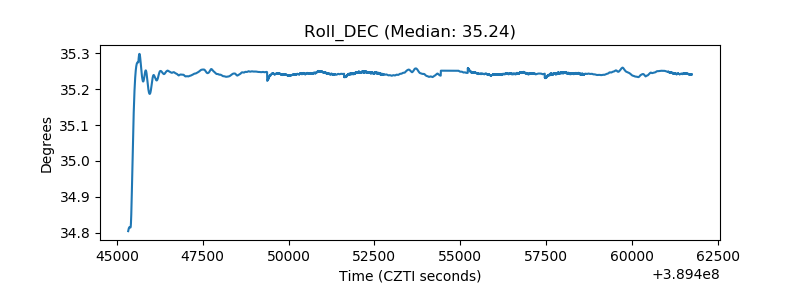 |
| _Roll_RA | 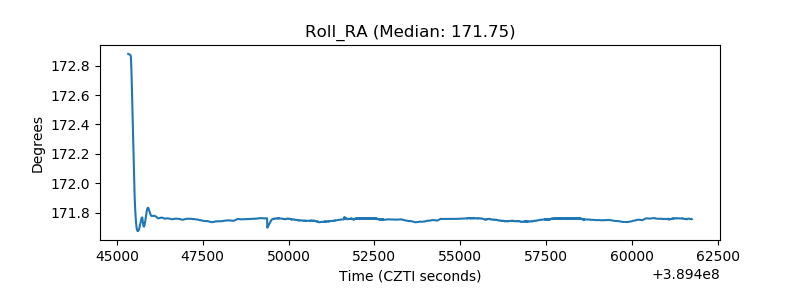 |
| Veto Counter | 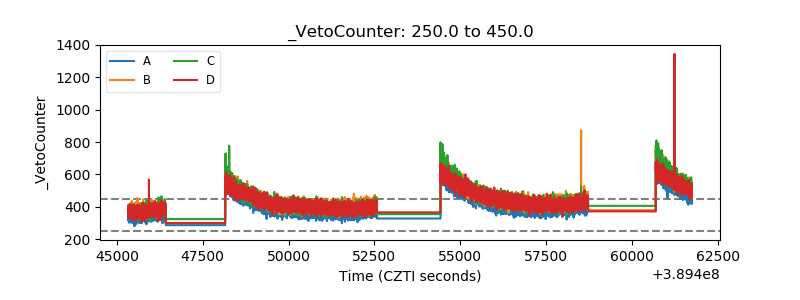 |