| Param | Original file | Final file |
|---|---|---|
| Filename | modeM0/AS1A09_142T02_9000005112cztM0_level2_bc.evt | modeM0/AS1A09_142T02_9000005112cztM0_level2_quad_clean.evt |
| Size (bytes) | 784,578,240 | 294,024,960 |
| Size | 748.2 MB | 280.4 MB |
| Events in quadrant A | 4,652,997 | 1,936,367 |
| Events in quadrant B | 6,226,908 | 1,910,967 |
| Events in quadrant C | 5,268,671 | 1,910,108 |
| Events in quadrant D | 6,283,101 | 1,809,376 |
| Mode SS | |||
|---|---|---|---|
| Quadrant | BADHDUFLAG | Total packets | Discarded packets |
| A | 0 | 398 | 0 |
| B | 0 | 398 | 0 |
| C | 0 | 398 | 0 |
| D | 0 | 398 | 0 |
| Mode M0 | |||
|---|---|---|---|
| Quadrant | BADHDUFLAG | Total packets | Discarded packets |
| A | 0 | 40527 | 0 |
| B | 0 | 47847 | 0 |
| C | 0 | 41616 | 0 |
| D | 0 | 46366 | 0 |
| Mode M9 | |||
|---|---|---|---|
| Quadrant | BADHDUFLAG | Total packets | Discarded packets |
| A | 0 | 98 | 0 |
| B | 0 | 98 | 0 |
| C | 0 | 98 | 0 |
| D | 0 | 98 | 0 |
| Quadrant | Total seconds | Saturated seconds | Saturation percentage |
|---|---|---|---|
| A | 19441 | 23 | 0.118307% |
| B | 19442 | 671 | 3.451291% |
| C | 19442 | 171 | 0.879539% |
| D | 19442 | 510 | 2.623187% |
Noise dominated data is calculated using 1-second bins in cleaned event files. If a bin has >2000 counts, and if more than 50% of those come from <1% of pixels, then it is considered to be noise-dominated and hence unusable.
| Quadrant | # 1 sec bins | Bins with >0 counts | Bins with >2000 counts | High rate bins dominated by noise | Noise dominated (total time) | Noise dominated (detector-on time) | Marked lightcurve |
|---|---|---|---|---|---|---|---|
| A | 29212 | 19447 | 0 | 0 | 0.00% | 0.00% | 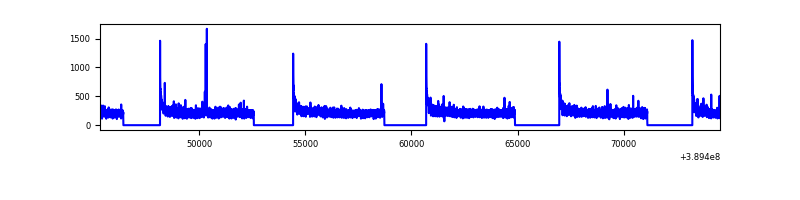 |
| B | 29212 | 19441 | 32 | 32 | 0.11% | 0.16% | 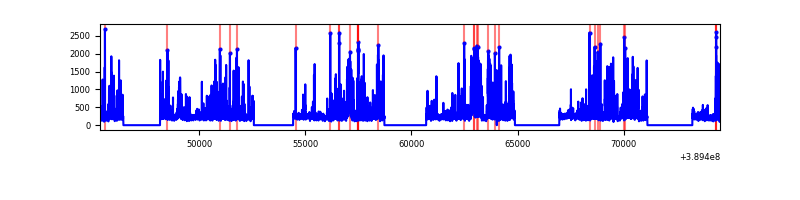 |
| C | 29212 | 19442 | 8 | 8 | 0.03% | 0.04% | 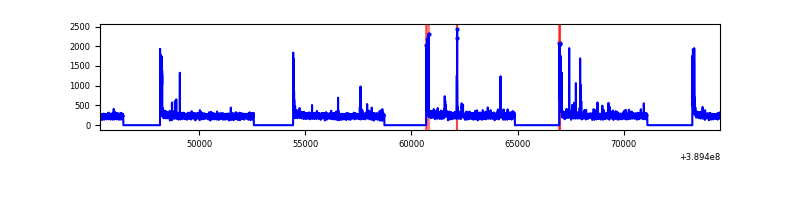 |
| D | 29212 | 19443 | 256 | 256 | 0.88% | 1.32% | 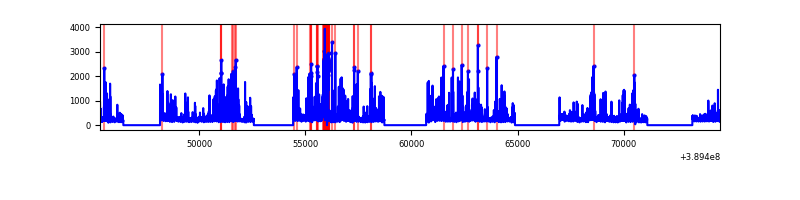 |
Top three noisy pixels from each quadrant. If the there are fewer than three noisy pixels in the level2.evt file, extra rows are filled as -1
| Pixel properties | Quadrant properties | ||||||
|---|---|---|---|---|---|---|---|
| Quadrant | DetID | PixID | Counts | Sigma | Mean | Median | Sigma |
| A | 10 | 83 | 427098 | 1812.56 | 1074 | 1059 | 235.0 |
| A | 13 | 6 | 41478 | 171.96 | 1074 | 1059 | 235.0 |
| A | 8 | 6 | 18015 | 72.14 | 1074 | 1059 | 235.0 |
| B | 5 | 172 | 1533925 | 7446.01 | 1056 | 1035 | 205.9 |
| B | 5 | 255 | 342080 | 1656.63 | 1056 | 1035 | 205.9 |
| B | 3 | 112 | 90387 | 434.03 | 1056 | 1035 | 205.9 |
| C | 15 | 214 | 765570 | 3145.4 | 1051 | 1044 | 243.1 |
| C | 0 | 10 | 343563 | 1409.19 | 1051 | 1044 | 243.1 |
| C | 1 | 23 | 21571 | 84.45 | 1051 | 1044 | 243.1 |
| D | 8 | 230 | 607933 | 2394.22 | 1053 | 1023 | 253.5 |
| D | 12 | 6 | 392662 | 1544.99 | 1053 | 1023 | 253.5 |
| D | 13 | 249 | 317321 | 1247.77 | 1053 | 1023 | 253.5 |
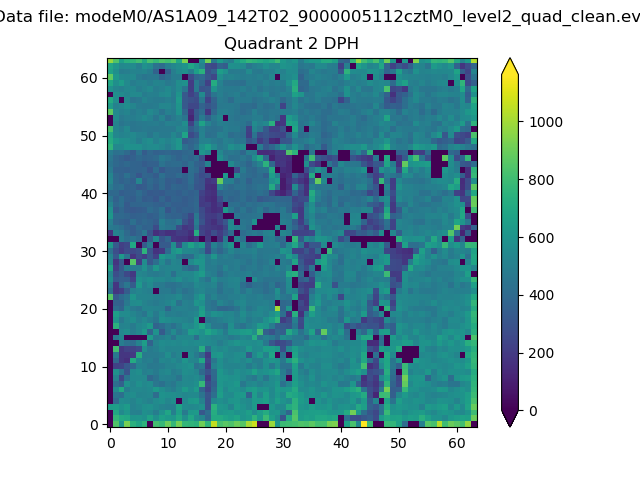
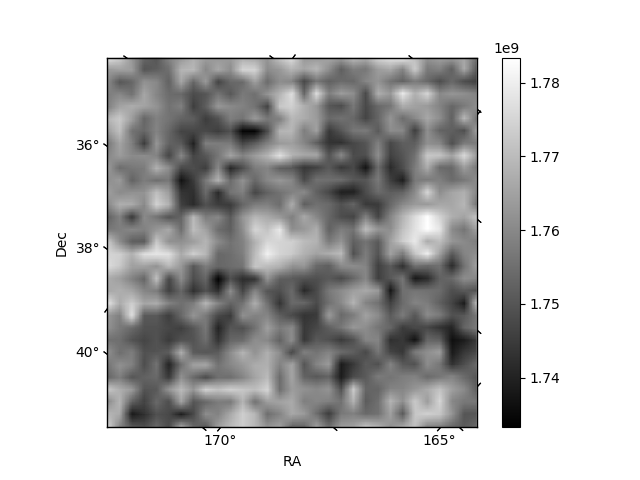
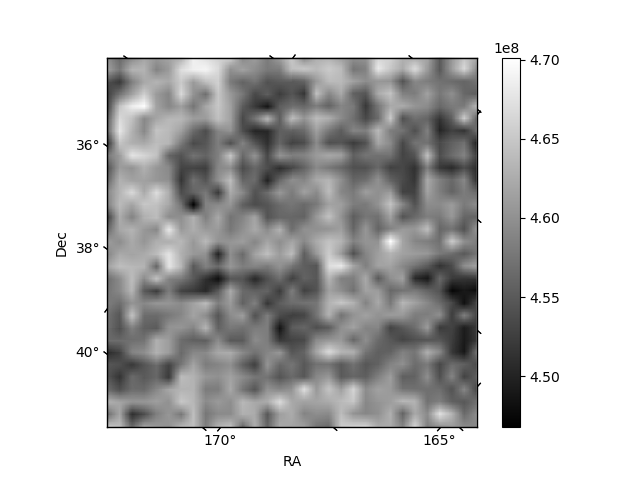
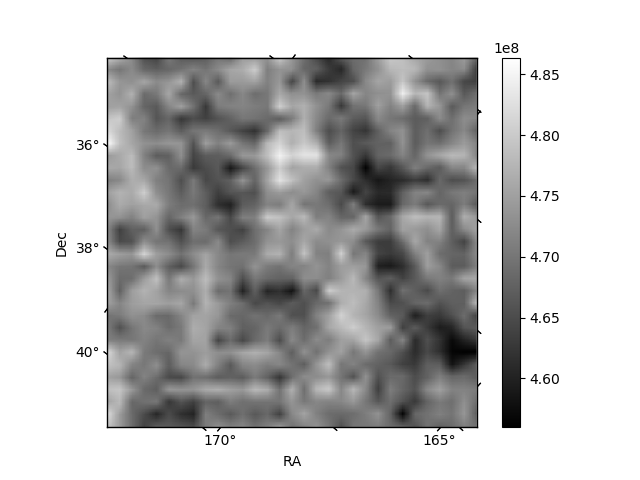
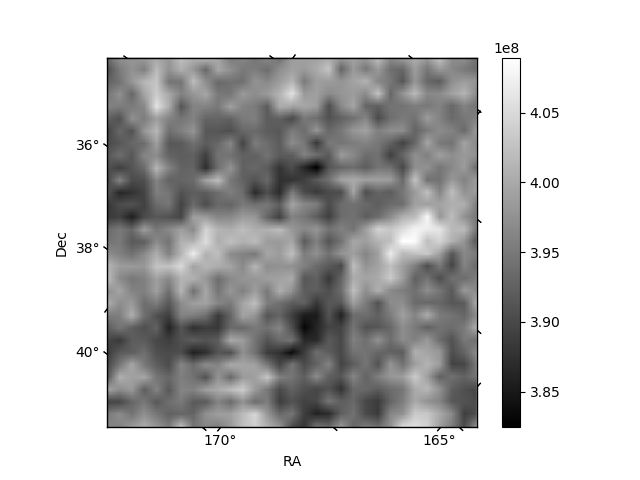
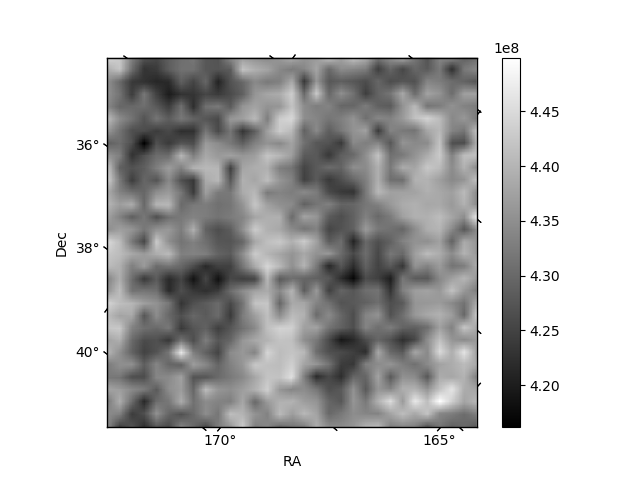
Histogram calculated using DETX and DETY for each event in the final _common_clean file
| Quadrant A | 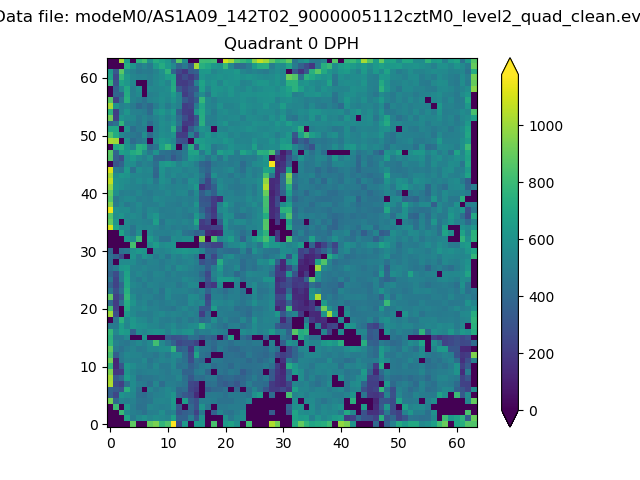 |
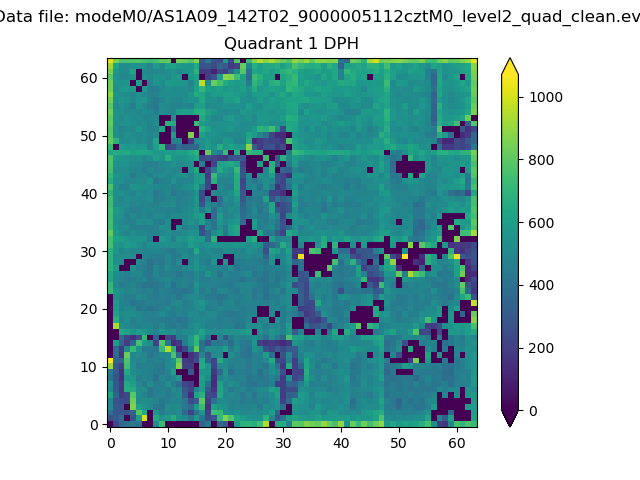 |
Quadrant B |
|---|---|---|---|
| Quadrant D | 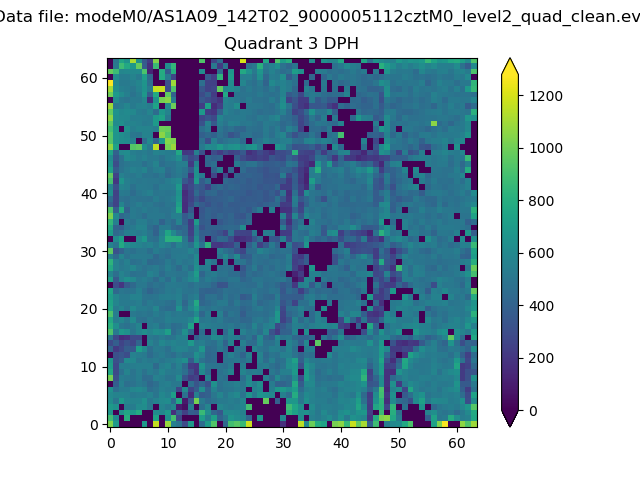 |
 |
Quadrant C |
| Plot type | Count rate plots | Images |
|---|---|---|
| Comparison with Poisson distribution Blue bars denote a histogram of data divided into 1 sec bins. Red curve is a Poisson curve with rate = median count rate of data. |
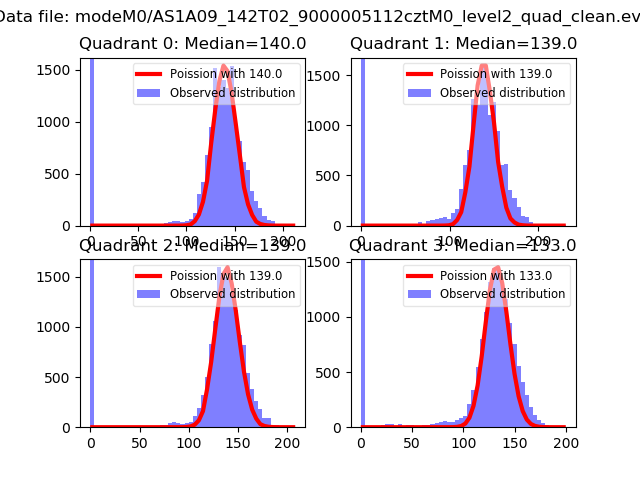 |
 |
| Quadrant-wise count rates Data is divided into 100 sec bins |
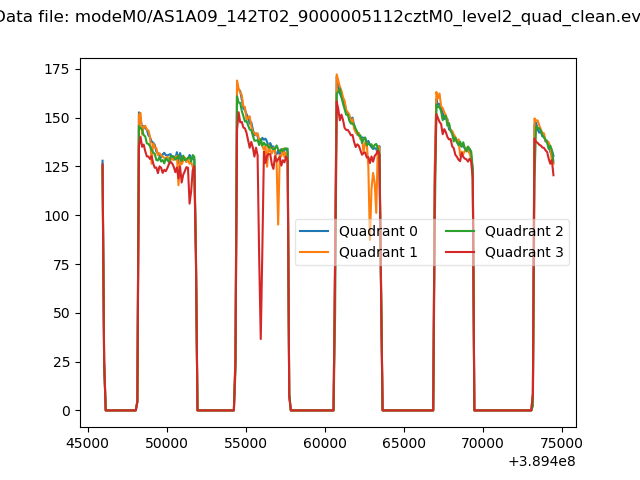 |
|
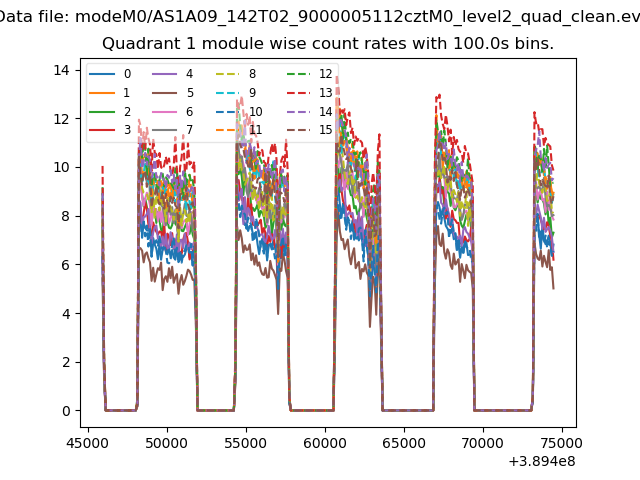
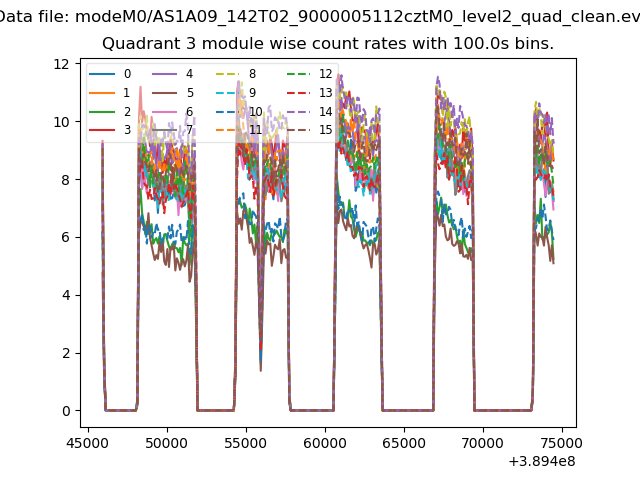
| Module-wise count rates for Quadrant A Data is divided into 100 sec bins |
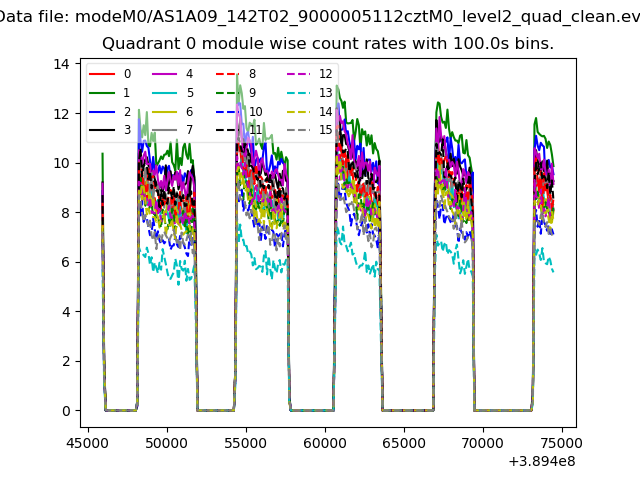 |
 |
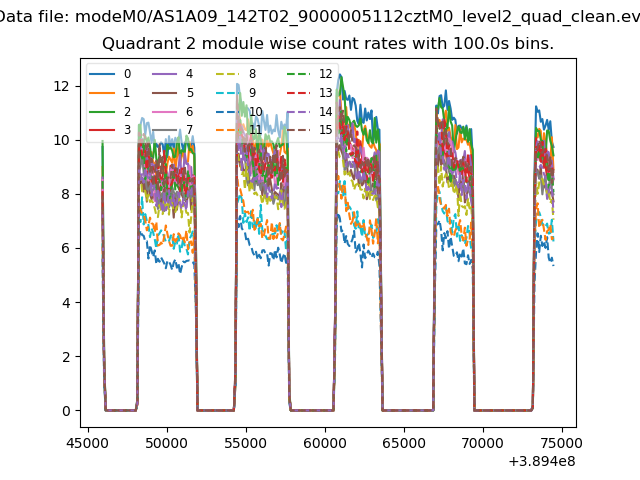
| Module-wise count rates for Quadrant B Data is divided into 100 sec bins |
 |
 |
| Module-wise count rates for Quadrant C Data is divided into 100 sec bins |
 |
 |
| Module-wise count rates for Quadrant D Data is divided into 100 sec bins |
 |
 |
| Parameter | Plot |
|---|---|
| CZT HV Monitor | 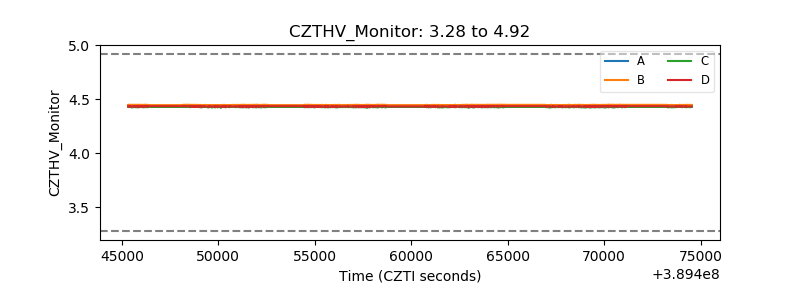 |
| D_VDD | 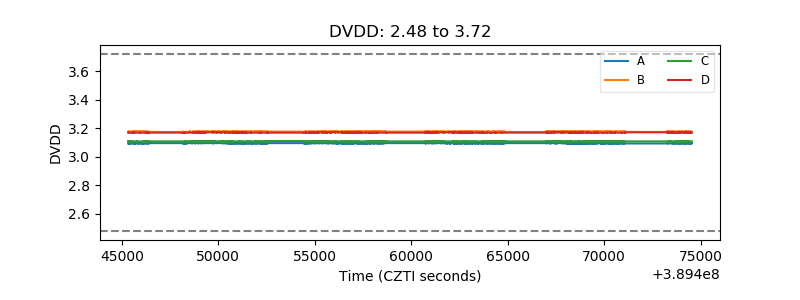 |
| Temperature 1 | 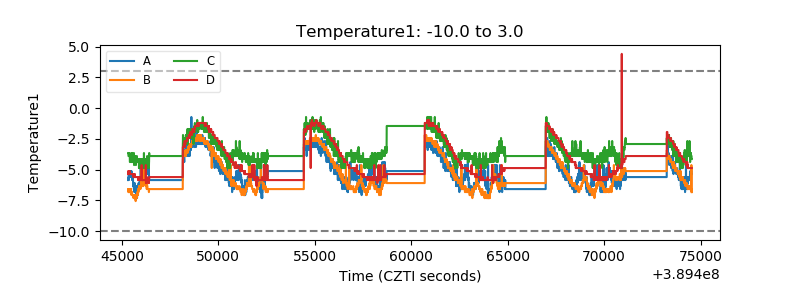 |
| Veto HV Monitor | 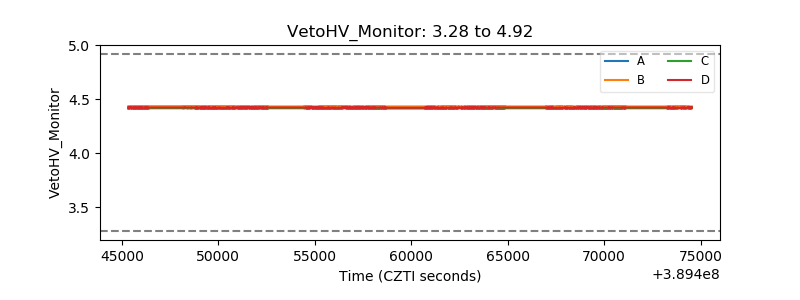 |
| Veto LLD | 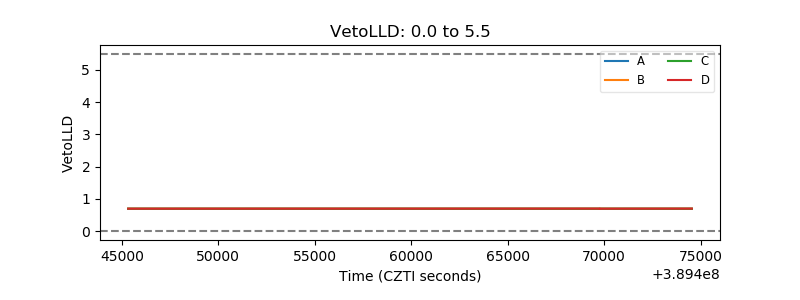 |
| Alpha Counter | 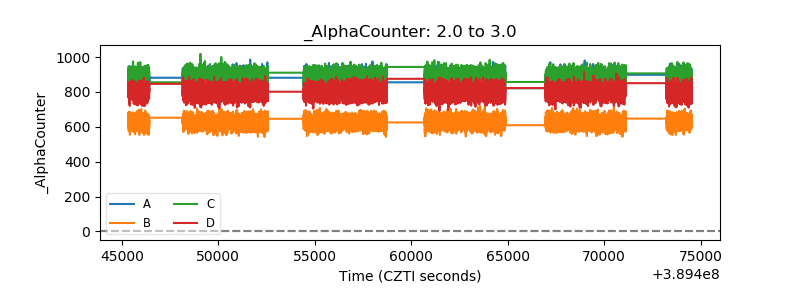 |
| _CPM_Rate | 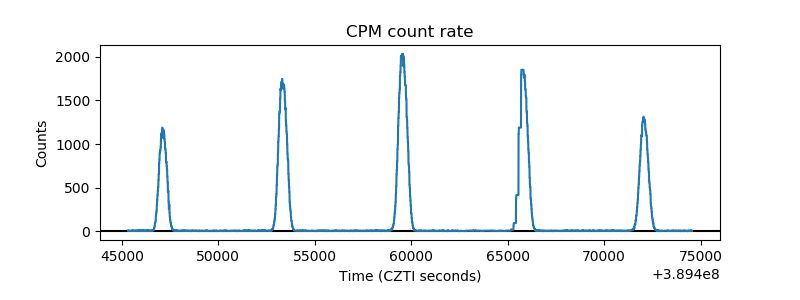 |
| CZT Counter | 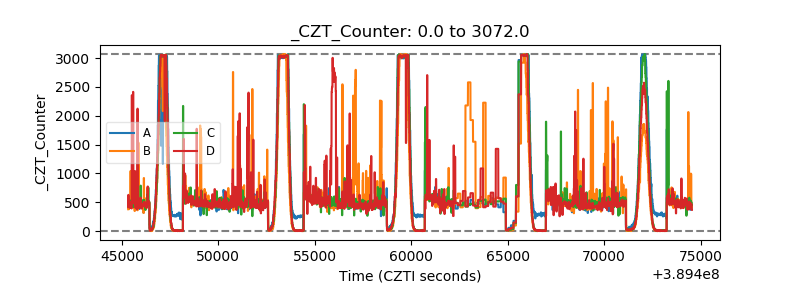 |
| +2.5 Volts monitor | 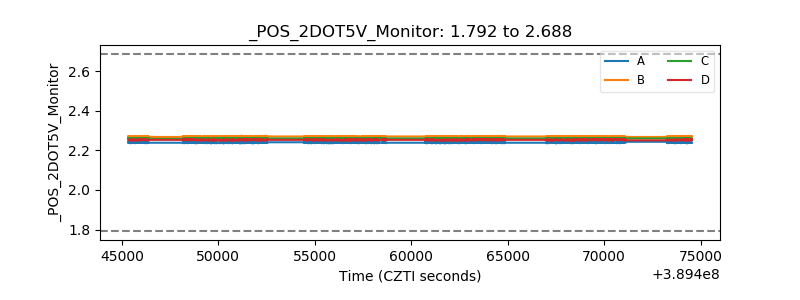 |
| +5 Volts monitor | 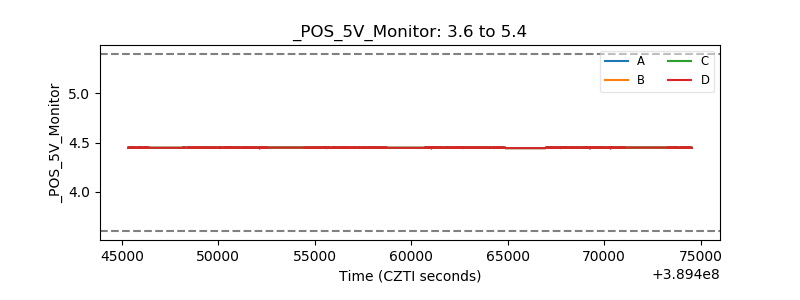 |
| _ROLL_ROT | 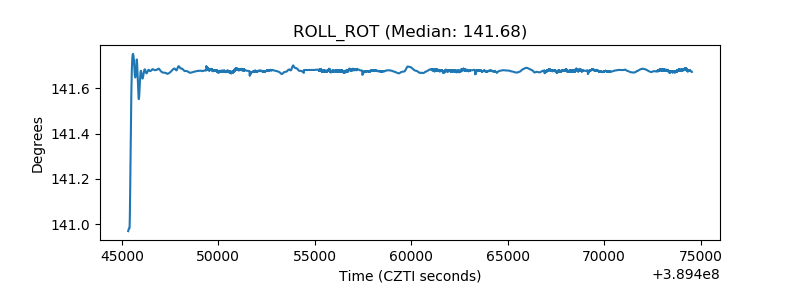 |
| _Roll_DEC | 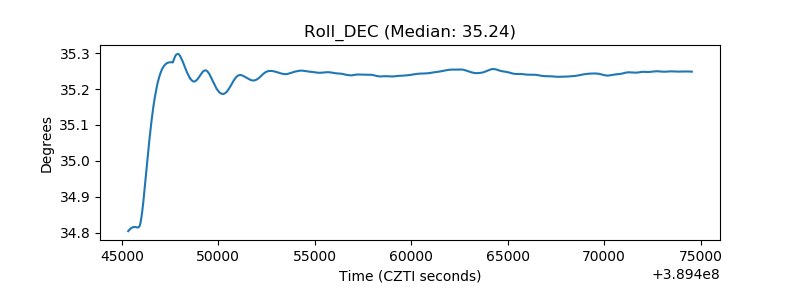 |
| _Roll_RA | 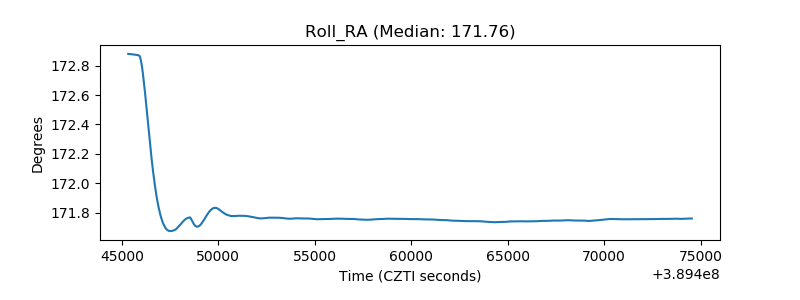 |
| Veto Counter | 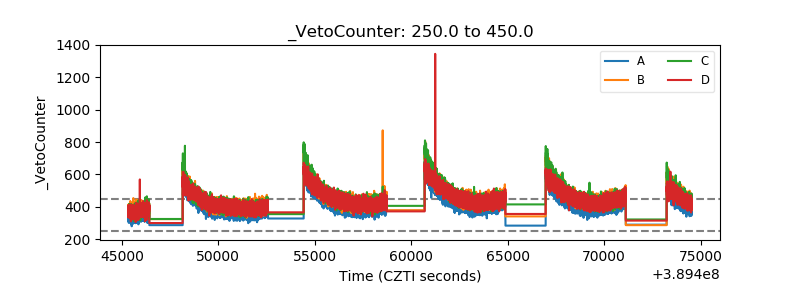 |