| Param | Original file | Final file |
|---|---|---|
| Filename | modeM0/AS1A09_029T02_9000005106_35672cztM0_level2.evt | modeM0/AS1A09_029T02_9000005106_35672cztM0_level2_quad_clean.evt |
| Size (bytes) | 463,343,040 | 65,275,200 |
| Size | 441.9 MB | 62.3 MB |
| Events in quadrant A | 2,832,328 | 400,637 |
| Events in quadrant B | 3,587,521 | 400,863 |
| Events in quadrant C | 3,396,945 | 400,195 |
| Events in quadrant D | 3,810,194 | 357,875 |
| Mode SS | |||
|---|---|---|---|
| Quadrant | BADHDUFLAG | Total packets | Discarded packets |
| A | 0 | 122 | 0 |
| B | 0 | 122 | 0 |
| C | 0 | 122 | 0 |
| D | 0 | 122 | 0 |
| Mode M0 | |||
|---|---|---|---|
| Quadrant | BADHDUFLAG | Total packets | Discarded packets |
| A | 0 | 12197 | 3 |
| B | 0 | 14578 | 2 |
| C | 0 | 13651 | 2 |
| D | 0 | 15412 | 2 |
| Mode M9 | |||
|---|---|---|---|
| Quadrant | BADHDUFLAG | Total packets | Discarded packets |
| A | 0 | 30 | 0 |
| B | 0 | 30 | 0 |
| C | 0 | 30 | 0 |
| D | 0 | 30 | 0 |
| Quadrant | Total seconds | Saturated seconds | Saturation percentage |
|---|---|---|---|
| A | 5969 | 8 | 0.134026% |
| B | 5969 | 162 | 2.714022% |
| C | 5969 | 191 | 3.199866% |
| D | 5969 | 342 | 5.729603% |
Noise dominated data is calculated using 1-second bins in cleaned event files. If a bin has >2000 counts, and if more than 50% of those come from <1% of pixels, then it is considered to be noise-dominated and hence unusable.
| Quadrant | # 1 sec bins | Bins with >0 counts | Bins with >2000 counts | High rate bins dominated by noise | Noise dominated (total time) | Noise dominated (detector-on time) | Marked lightcurve |
|---|---|---|---|---|---|---|---|
| A | 8891 | 5971 | 1 | 1 | 0.01% | 0.02% | 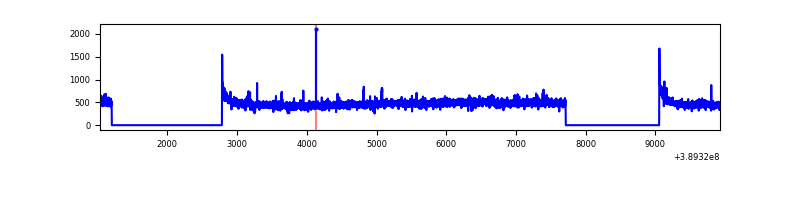 |
| B | 8891 | 5971 | 116 | 116 | 1.30% | 1.94% | 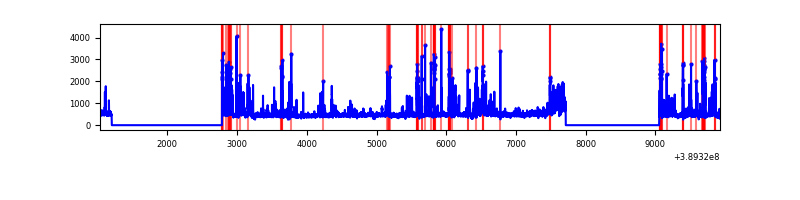 |
| C | 8891 | 5971 | 158 | 158 | 1.78% | 2.65% | 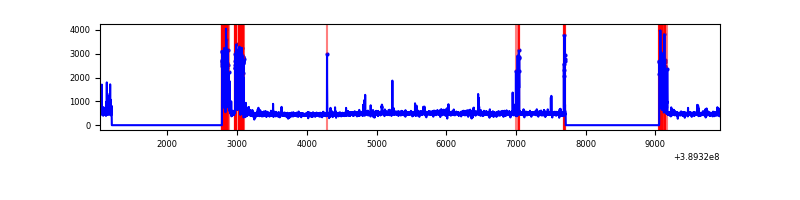 |
| D | 8891 | 5970 | 320 | 320 | 3.60% | 5.36% | 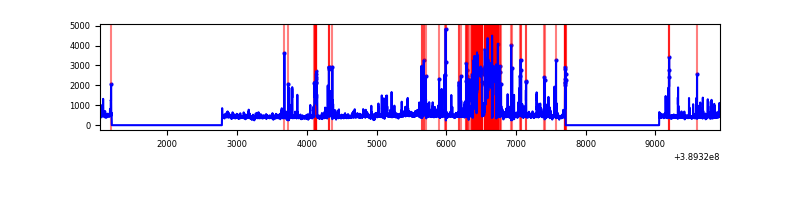 |
Top three noisy pixels from each quadrant. If the there are fewer than three noisy pixels in the level2.evt file, extra rows are filled as -1
| Pixel properties | Quadrant properties | ||||||
|---|---|---|---|---|---|---|---|
| Quadrant | DetID | PixID | Counts | Sigma | Mean | Median | Sigma |
| A | 10 | 83 | 151558 | 1090.39 | 679 | 664 | 138.4 |
| A | 15 | 169 | 29226 | 206.4 | 679 | 664 | 138.4 |
| A | 13 | 6 | 17282 | 120.09 | 679 | 664 | 138.4 |
| B | 5 | 172 | 606707 | 4669.78 | 669 | 650 | 129.8 |
| B | 5 | 255 | 187845 | 1442.37 | 669 | 650 | 129.8 |
| B | 5 | 31 | 104355 | 799.07 | 669 | 650 | 129.8 |
| C | 0 | 10 | 329977 | 2165.73 | 651 | 653 | 152.1 |
| C | 1 | 23 | 266244 | 1746.6 | 651 | 653 | 152.1 |
| C | 15 | 214 | 247397 | 1622.66 | 651 | 653 | 152.1 |
| D | 13 | 249 | 896953 | 5670.77 | 639 | 620 | 158.1 |
| D | 12 | 6 | 108487 | 682.43 | 639 | 620 | 158.1 |
| D | 2 | 153 | 46456 | 289.99 | 639 | 620 | 158.1 |
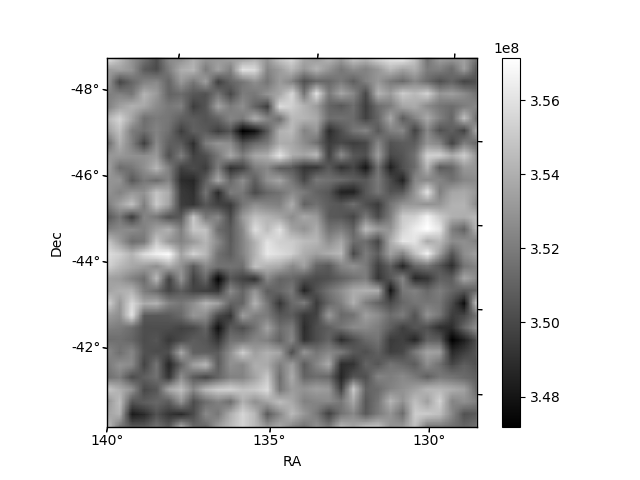
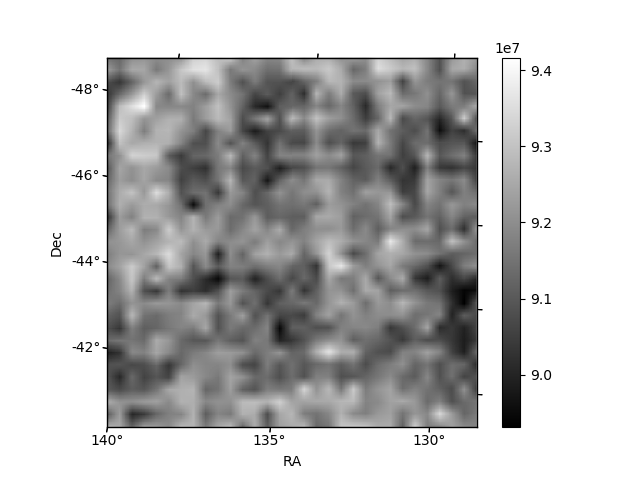
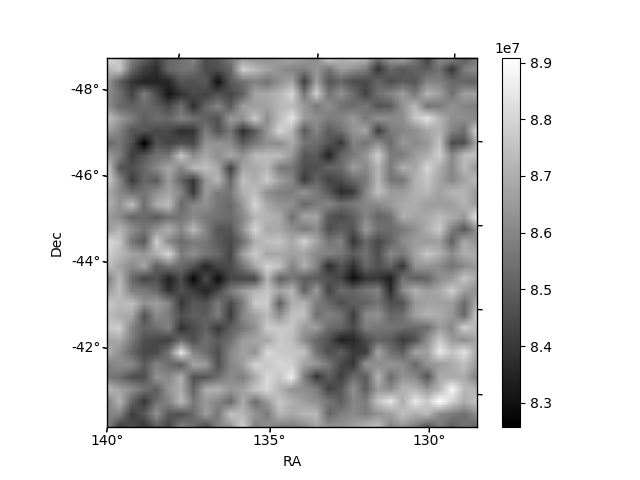
Histogram calculated using DETX and DETY for each event in the final _common_clean file
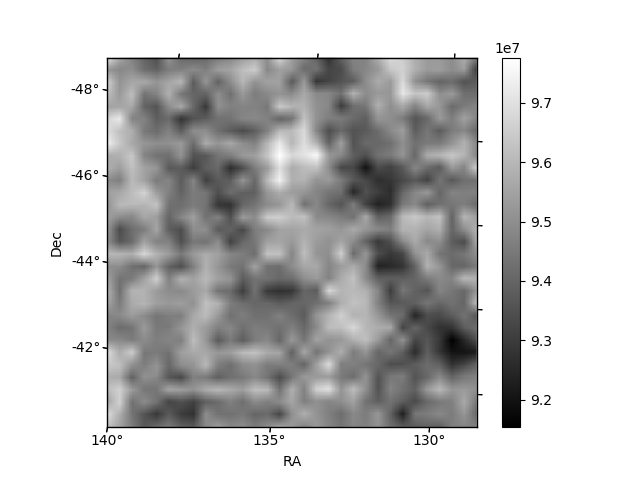
| Quadrant A | 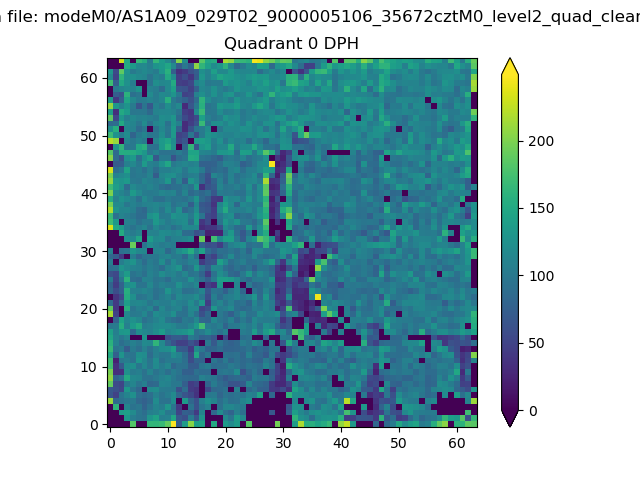 |
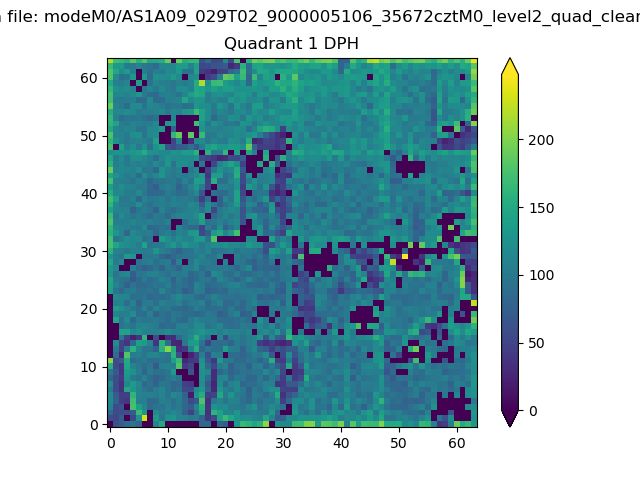 |
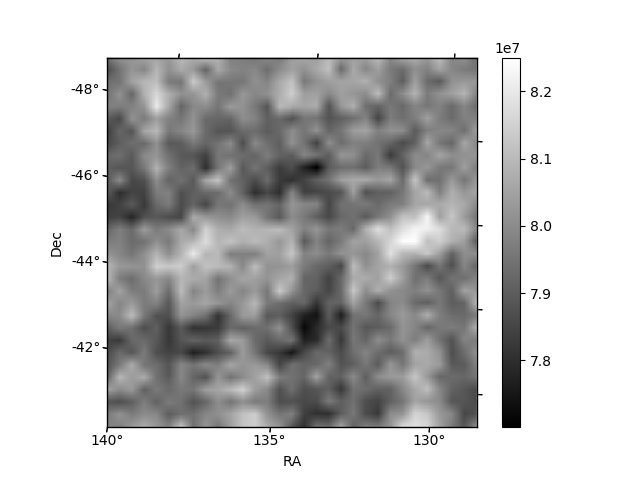
Quadrant B |
|---|---|---|---|
| Quadrant D |  |
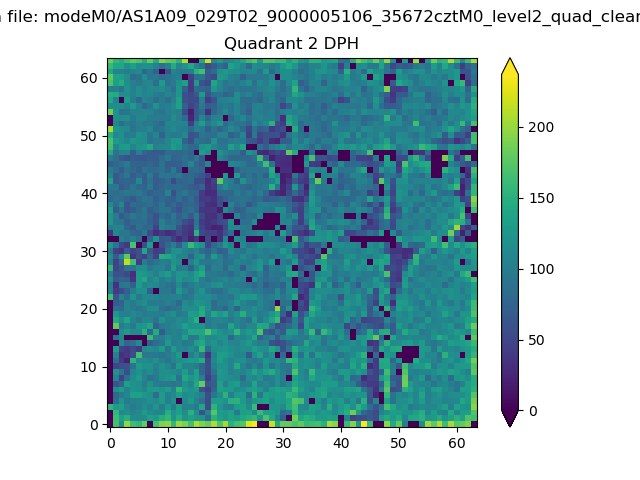 |
Quadrant C |
| Plot type | Count rate plots | Images |
|---|---|---|
| Comparison with Poisson distribution Blue bars denote a histogram of data divided into 1 sec bins. Red curve is a Poisson curve with rate = median count rate of data. |
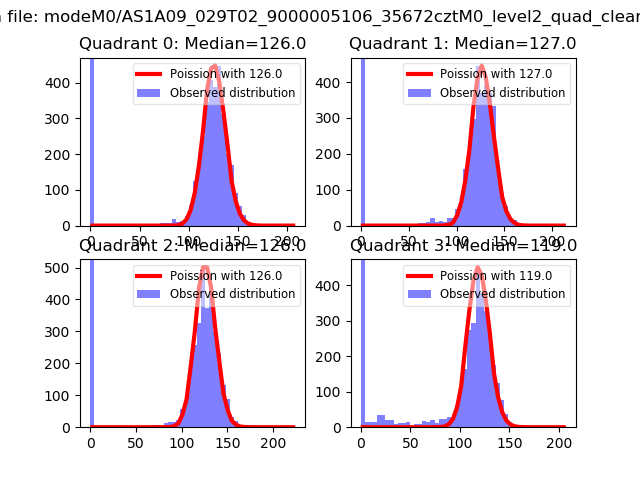 |
 |
| Quadrant-wise count rates Data is divided into 100 sec bins |
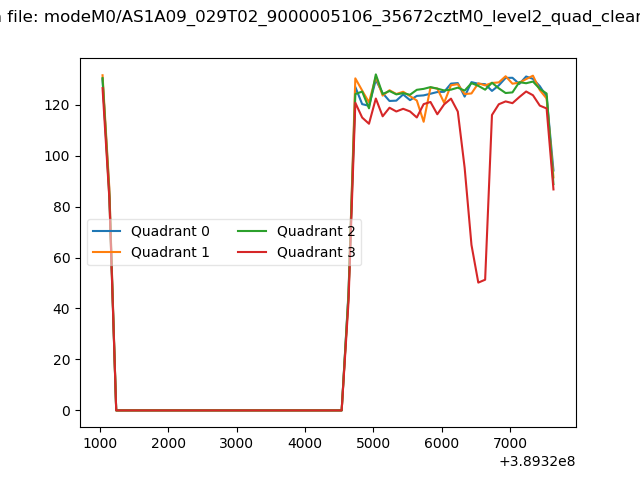 |
|
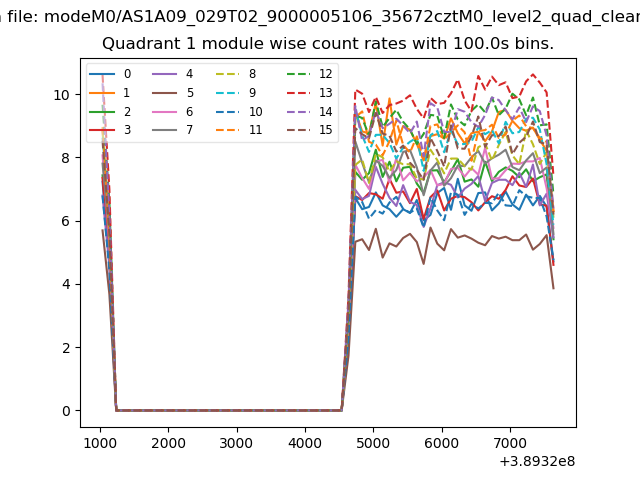
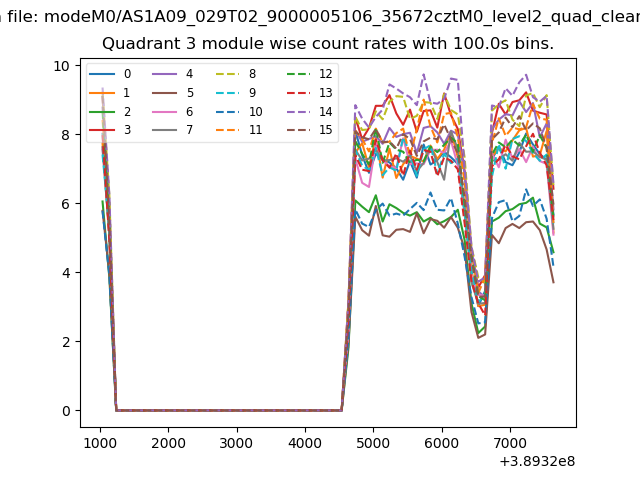
| Module-wise count rates for Quadrant A Data is divided into 100 sec bins |
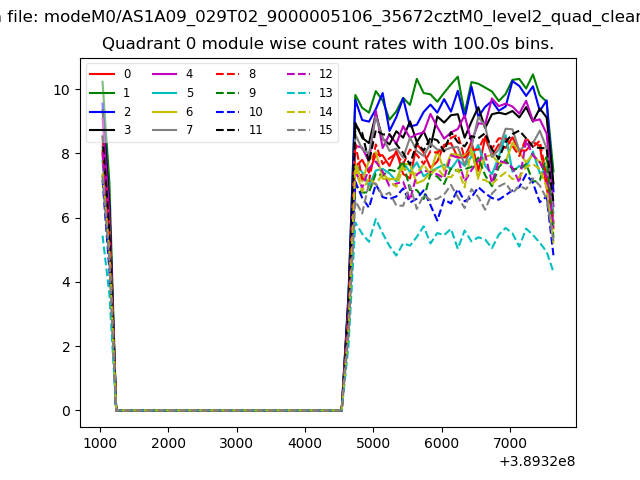 |
 |
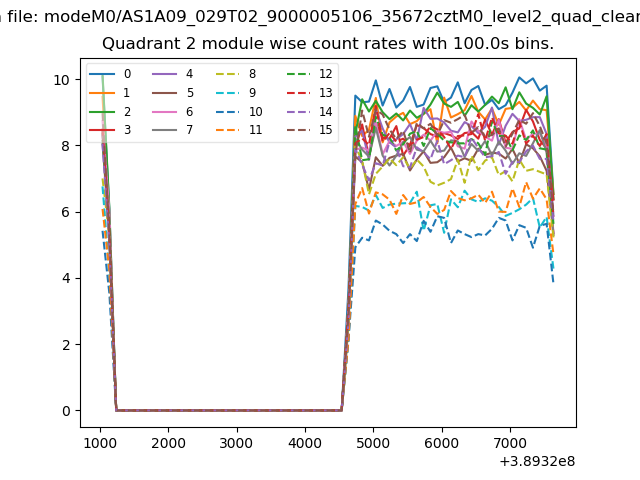
| Module-wise count rates for Quadrant B Data is divided into 100 sec bins |
 |
 |
| Module-wise count rates for Quadrant C Data is divided into 100 sec bins |
 |
 |
| Module-wise count rates for Quadrant D Data is divided into 100 sec bins |
 |
 |
| Parameter | Plot |
|---|---|
| CZT HV Monitor | 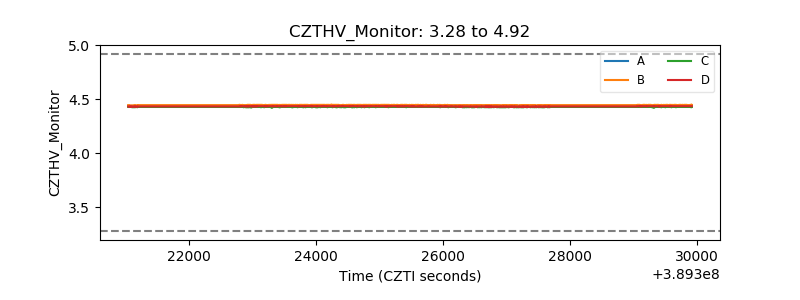 |
| D_VDD | 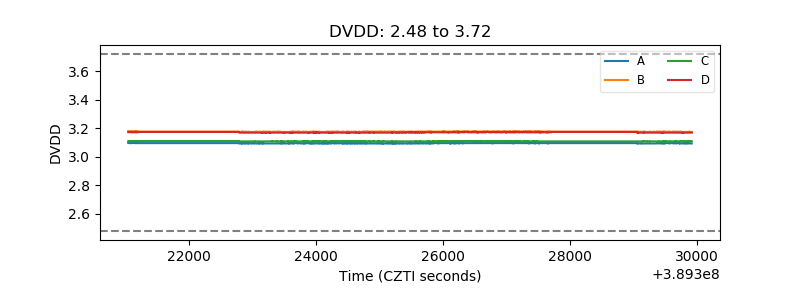 |
| Temperature 1 | 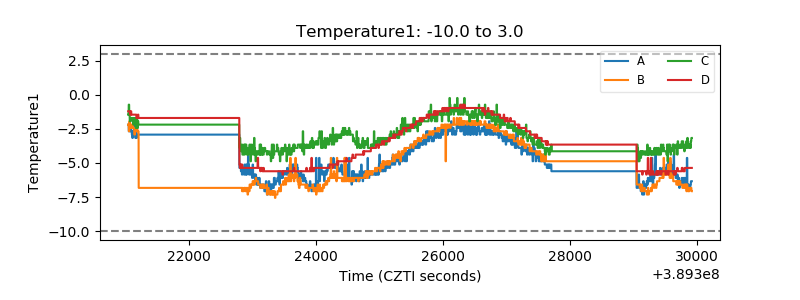 |
| Veto HV Monitor | 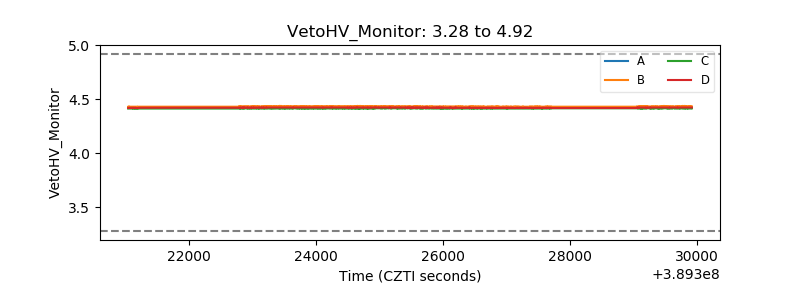 |
| Veto LLD | 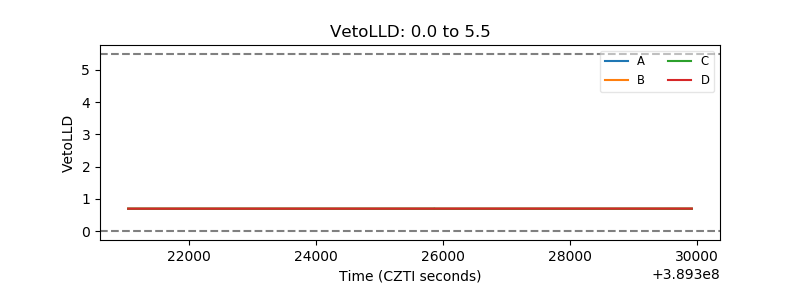 |
| Alpha Counter | 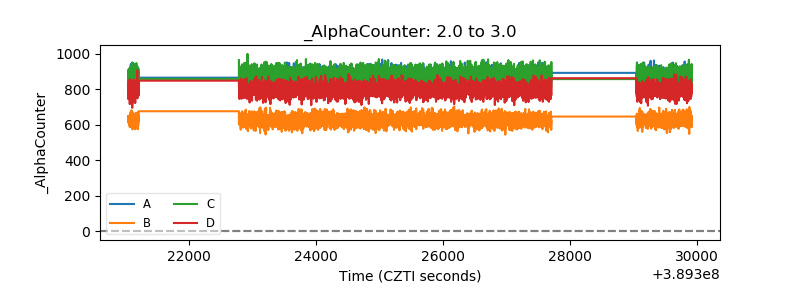 |
| _CPM_Rate | 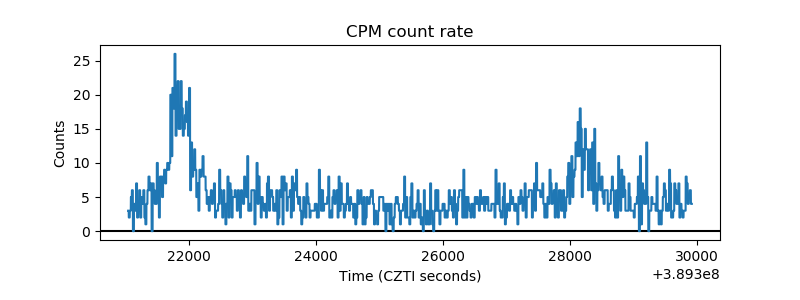 |
| CZT Counter | 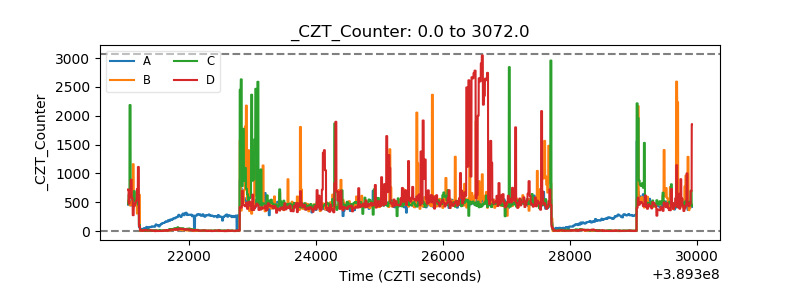 |
| +2.5 Volts monitor | 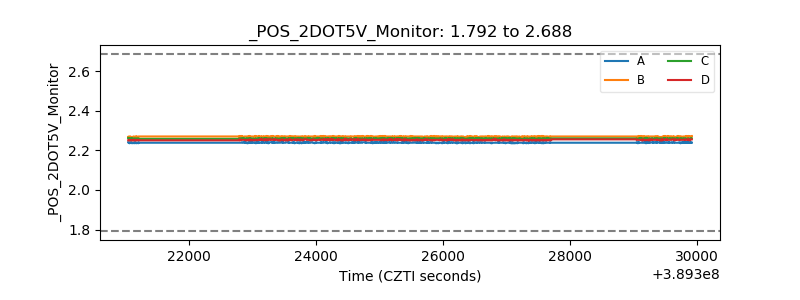 |
| +5 Volts monitor | 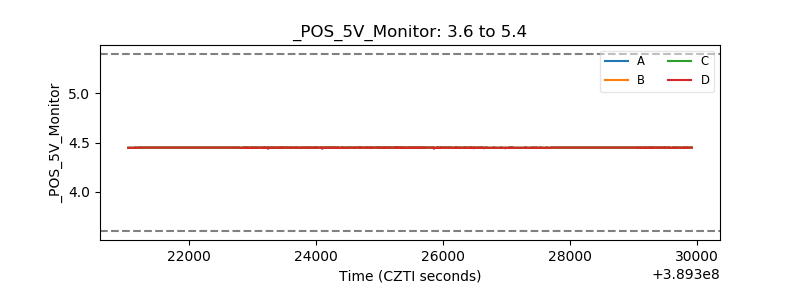 |
| _ROLL_ROT |  |
| _Roll_DEC | 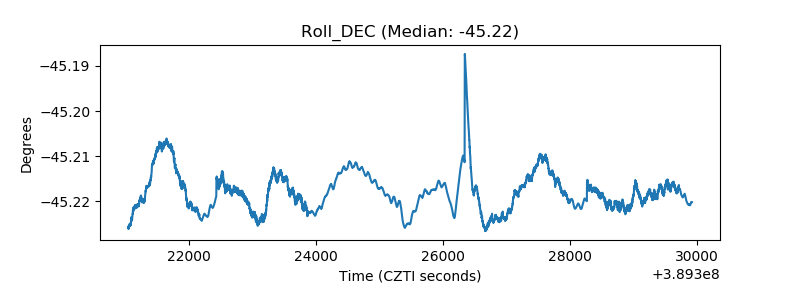 |
| _Roll_RA | 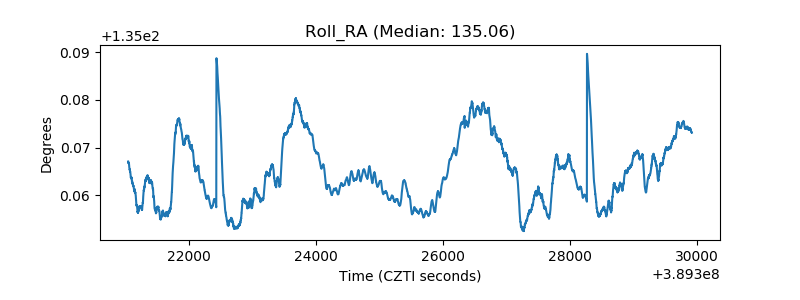 |
| Veto Counter | 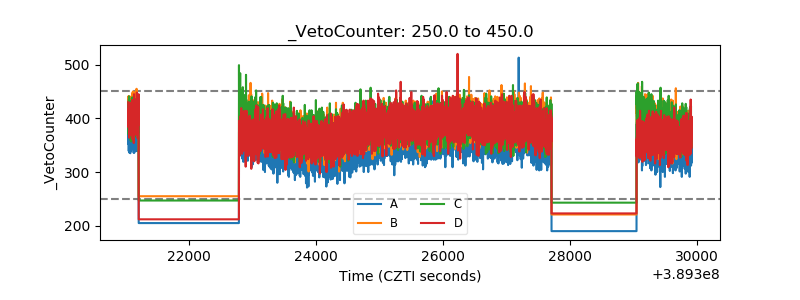 |