| Param | Original file | Final file |
|---|---|---|
| Filename | modeM0/AS1A09_029T02_9000005106_35671cztM0_level2.evt | modeM0/AS1A09_029T02_9000005106_35671cztM0_level2_quad_clean.evt |
| Size (bytes) | 444,890,880 | 60,713,280 |
| Size | 424.3 MB | 57.9 MB |
| Events in quadrant A | 2,716,586 | 367,399 |
| Events in quadrant B | 3,697,677 | 362,854 |
| Events in quadrant C | 3,496,713 | 361,005 |
| Events in quadrant D | 3,176,835 | 349,834 |
| Mode SS | |||
|---|---|---|---|
| Quadrant | BADHDUFLAG | Total packets | Discarded packets |
| A | 0 | 116 | 0 |
| B | 0 | 116 | 0 |
| C | 0 | 116 | 0 |
| D | 0 | 116 | 0 |
| Mode M0 | |||
|---|---|---|---|
| Quadrant | BADHDUFLAG | Total packets | Discarded packets |
| A | 0 | 11640 | 3 |
| B | 0 | 14707 | 2 |
| C | 0 | 13717 | 2 |
| D | 0 | 13189 | 2 |
| Mode M9 | |||
|---|---|---|---|
| Quadrant | BADHDUFLAG | Total packets | Discarded packets |
| A | 0 | 35 | 0 |
| B | 0 | 35 | 0 |
| C | 0 | 35 | 0 |
| D | 0 | 35 | 0 |
| Quadrant | Total seconds | Saturated seconds | Saturation percentage |
|---|---|---|---|
| A | 5682 | 8 | 0.140795% |
| B | 5682 | 268 | 4.716649% |
| C | 5682 | 232 | 4.083069% |
| D | 5682 | 55 | 0.967969% |
Noise dominated data is calculated using 1-second bins in cleaned event files. If a bin has >2000 counts, and if more than 50% of those come from <1% of pixels, then it is considered to be noise-dominated and hence unusable.
| Quadrant | # 1 sec bins | Bins with >0 counts | Bins with >2000 counts | High rate bins dominated by noise | Noise dominated (total time) | Noise dominated (detector-on time) | Marked lightcurve |
|---|---|---|---|---|---|---|---|
| A | 9175 | 5684 | 0 | 0 | 0.00% | 0.00% | 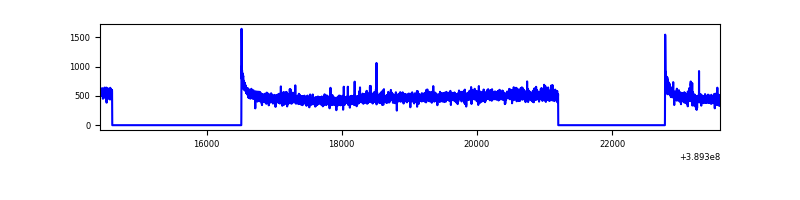 |
| B | 9175 | 5684 | 182 | 182 | 1.98% | 3.20% | 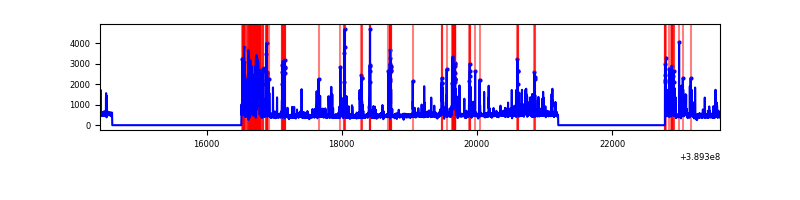 |
| C | 9175 | 5684 | 186 | 186 | 2.03% | 3.27% | 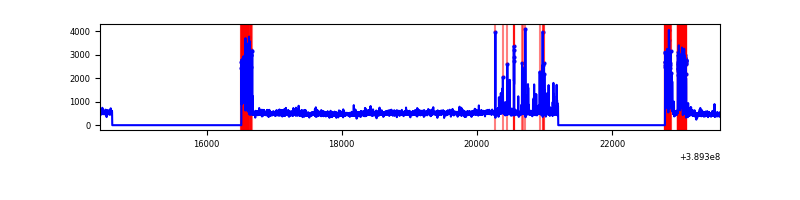 |
| D | 9175 | 5684 | 45 | 45 | 0.49% | 0.79% | 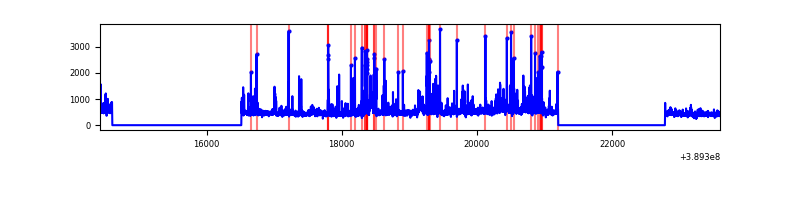 |
Top three noisy pixels from each quadrant. If the there are fewer than three noisy pixels in the level2.evt file, extra rows are filled as -1
| Pixel properties | Quadrant properties | ||||||
|---|---|---|---|---|---|---|---|
| Quadrant | DetID | PixID | Counts | Sigma | Mean | Median | Sigma |
| A | 10 | 83 | 149006 | 1134.21 | 650 | 636 | 130.8 |
| A | 15 | 169 | 42580 | 320.64 | 650 | 636 | 130.8 |
| A | 13 | 6 | 11080 | 79.84 | 650 | 636 | 130.8 |
| B | 5 | 172 | 907764 | 7379.41 | 636 | 618 | 122.9 |
| B | 5 | 255 | 165240 | 1339.16 | 636 | 618 | 122.9 |
| B | 0 | 189 | 50596 | 406.56 | 636 | 618 | 122.9 |
| C | 0 | 10 | 395253 | 2739.26 | 622 | 626 | 144.1 |
| C | 1 | 23 | 332623 | 2304.52 | 622 | 626 | 144.1 |
| C | 15 | 214 | 236740 | 1638.96 | 622 | 626 | 144.1 |
| D | 13 | 249 | 278931 | 1801.16 | 630 | 612 | 154.5 |
| D | 8 | 195 | 86090 | 553.17 | 630 | 612 | 154.5 |
| D | 7 | 80 | 84749 | 544.5 | 630 | 612 | 154.5 |
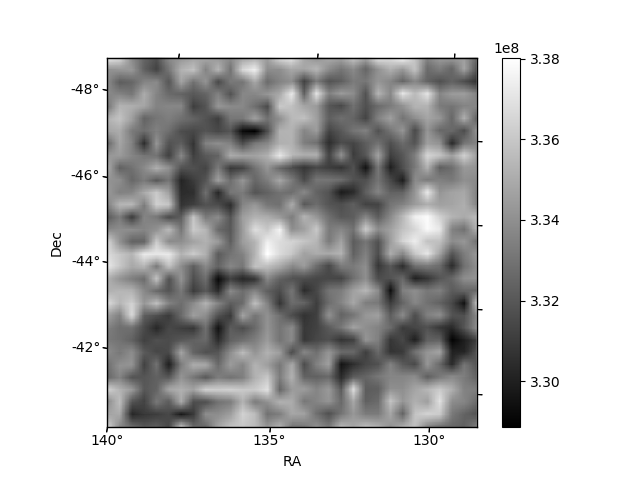
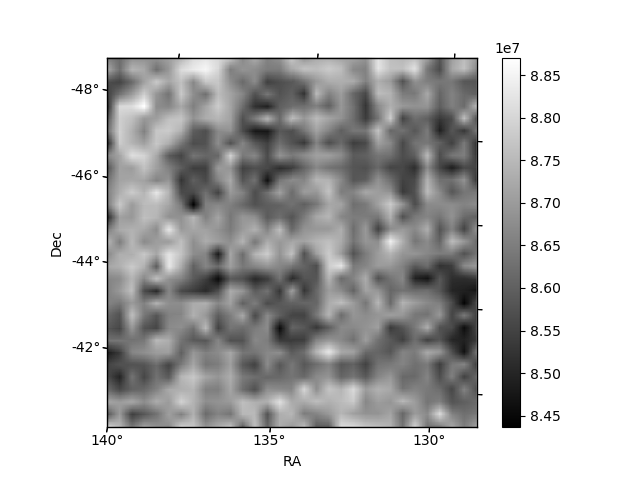
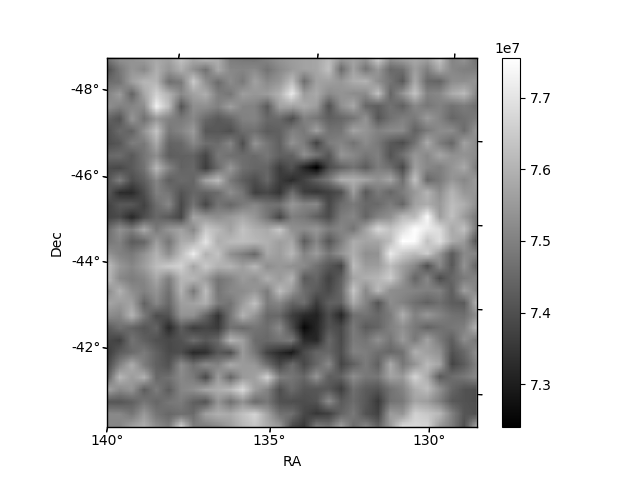
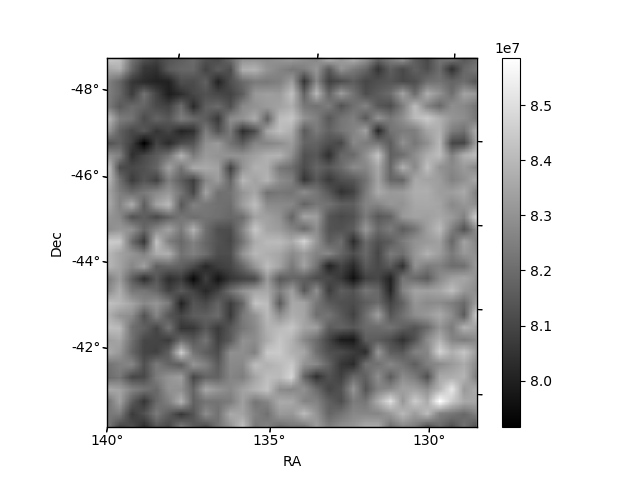
Histogram calculated using DETX and DETY for each event in the final _common_clean file
| Quadrant A | 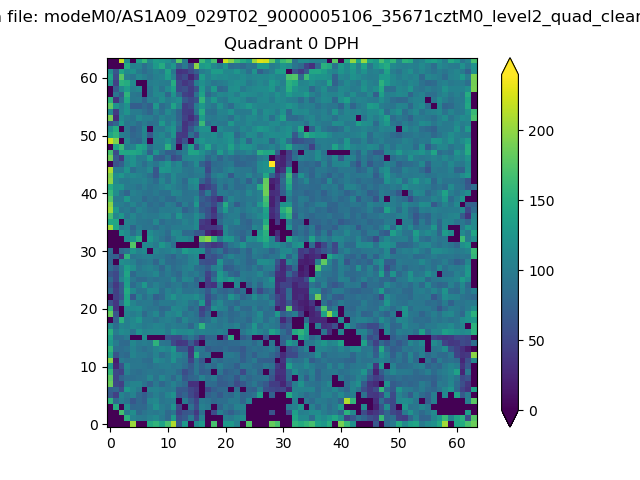 |
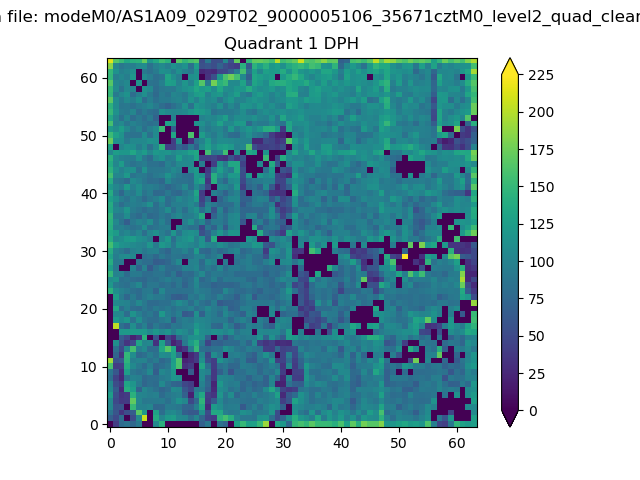 |
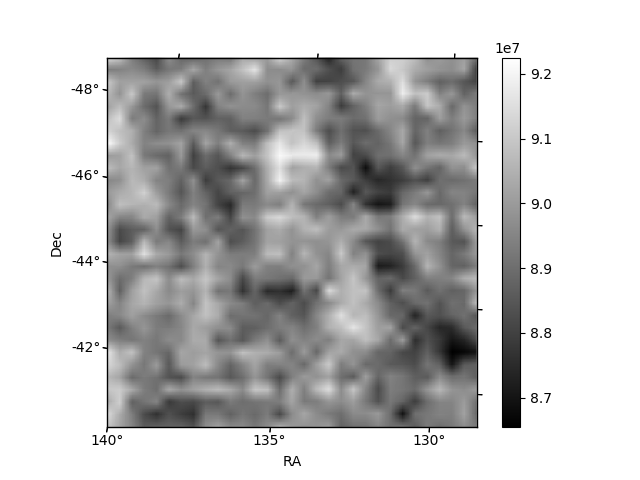
Quadrant B |
|---|---|---|---|
| Quadrant D | 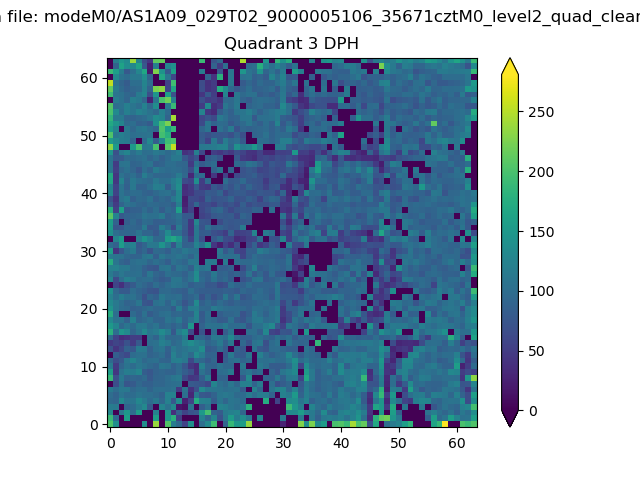 |
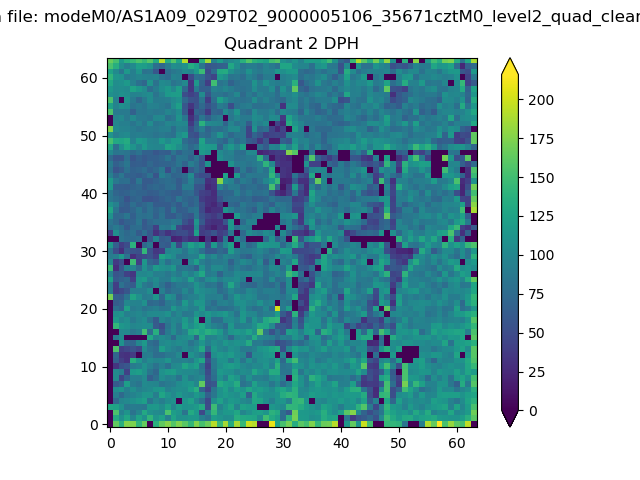 |
Quadrant C |
| Plot type | Count rate plots | Images |
|---|---|---|
| Comparison with Poisson distribution Blue bars denote a histogram of data divided into 1 sec bins. Red curve is a Poisson curve with rate = median count rate of data. |
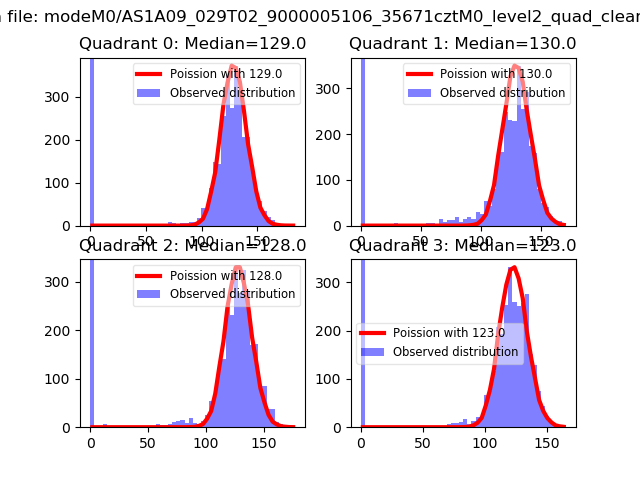 |
 |
| Quadrant-wise count rates Data is divided into 100 sec bins |
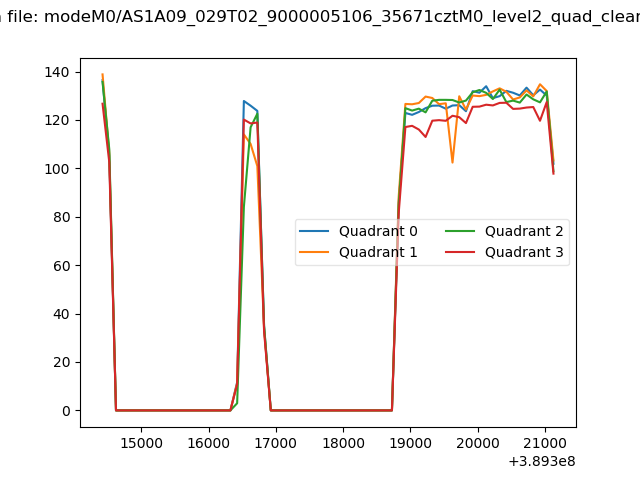 |
|
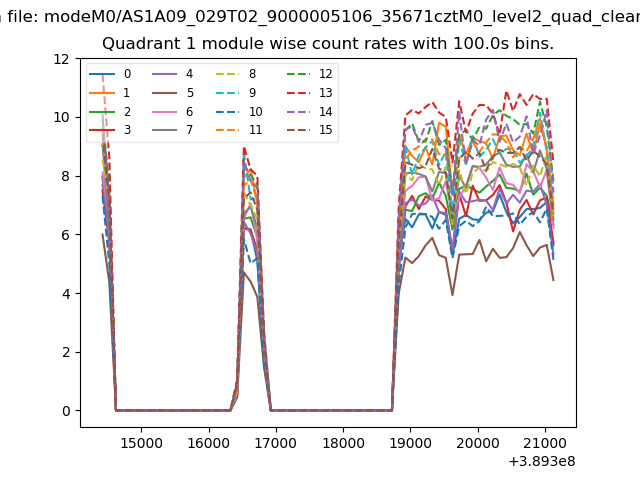
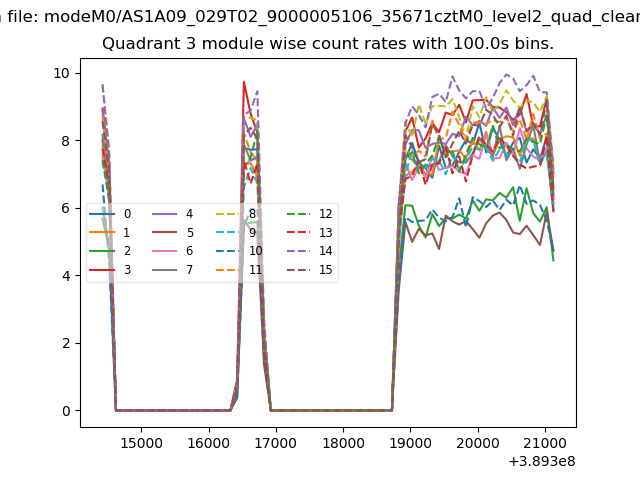
| Module-wise count rates for Quadrant A Data is divided into 100 sec bins |
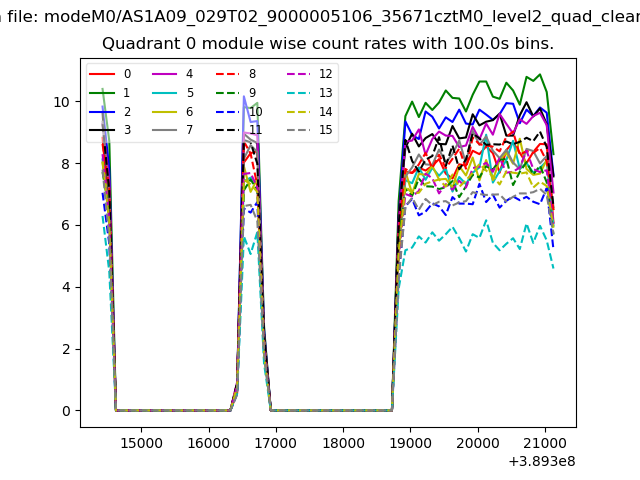 |
 |
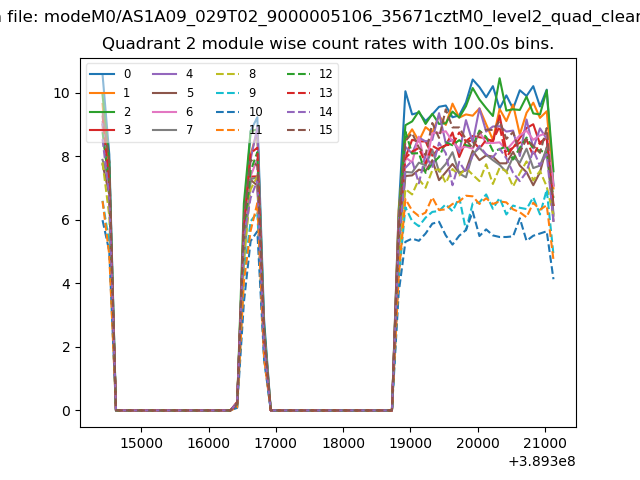
| Module-wise count rates for Quadrant B Data is divided into 100 sec bins |
 |
 |
| Module-wise count rates for Quadrant C Data is divided into 100 sec bins |
 |
 |
| Module-wise count rates for Quadrant D Data is divided into 100 sec bins |
 |
 |
| Parameter | Plot |
|---|---|
| CZT HV Monitor | 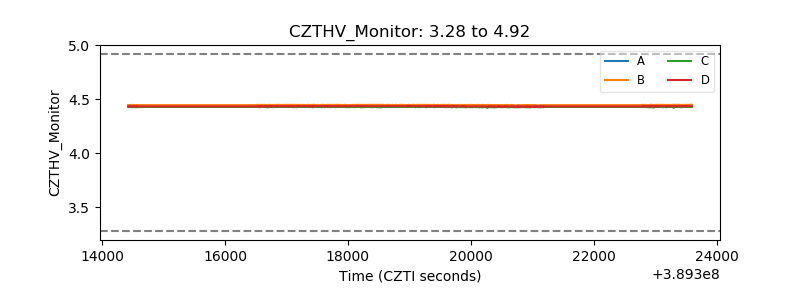 |
| D_VDD | 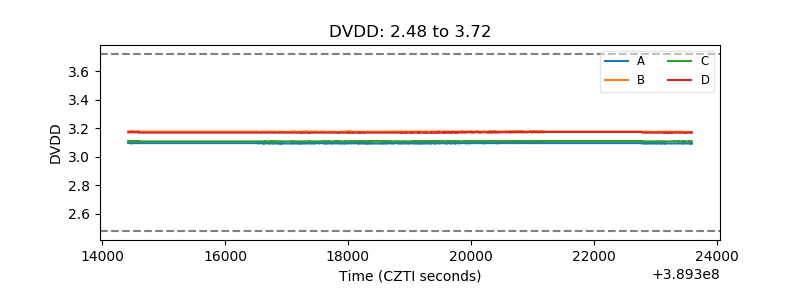 |
| Temperature 1 | 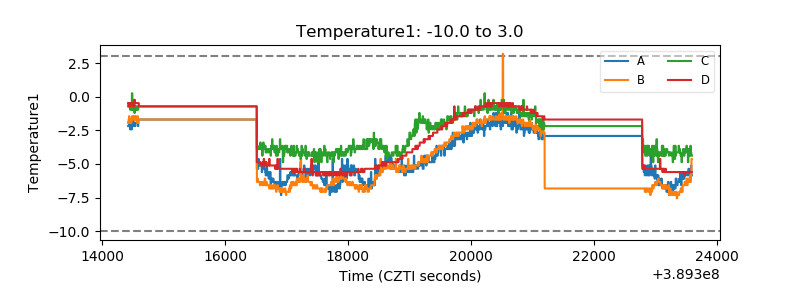 |
| Veto HV Monitor | 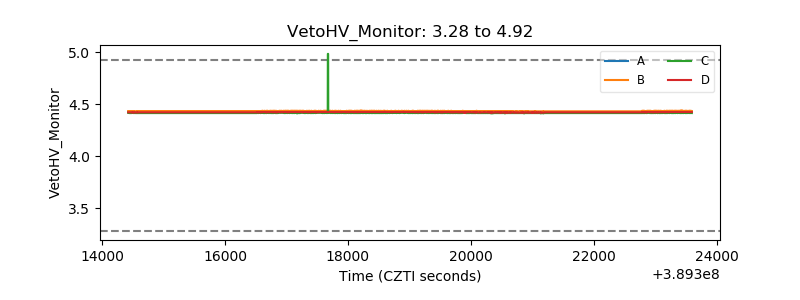 |
| Veto LLD | 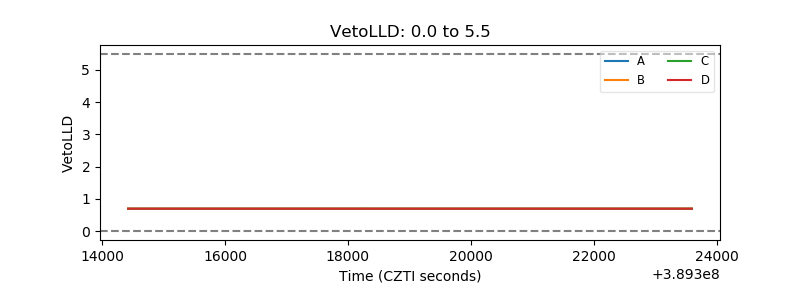 |
| Alpha Counter | 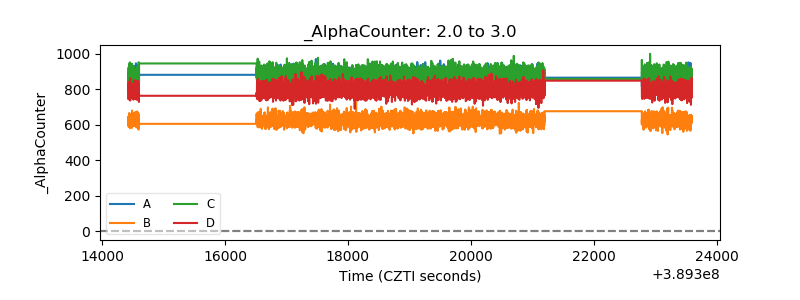 |
| _CPM_Rate | 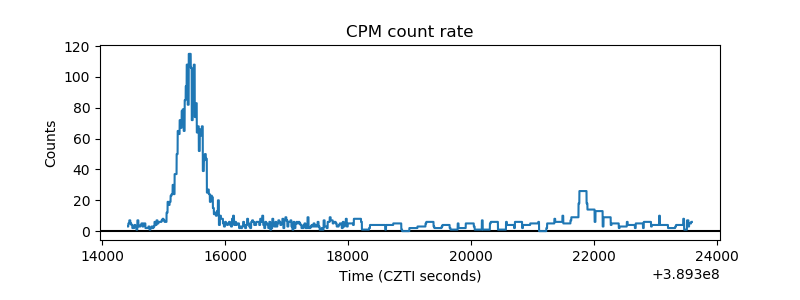 |
| CZT Counter | 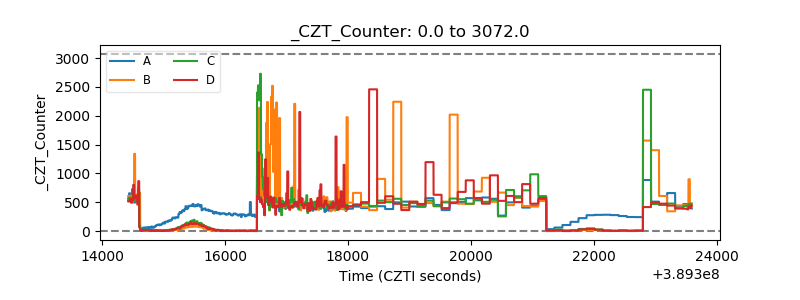 |
| +2.5 Volts monitor | 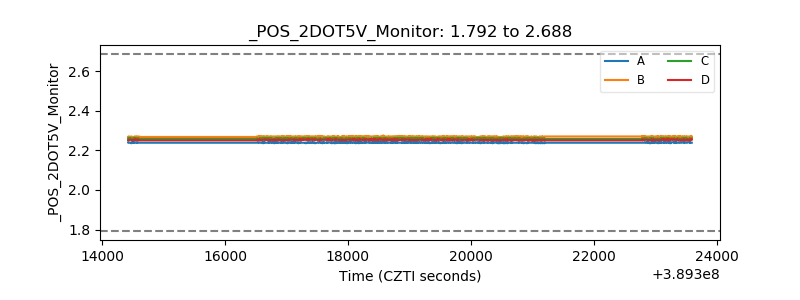 |
| +5 Volts monitor | 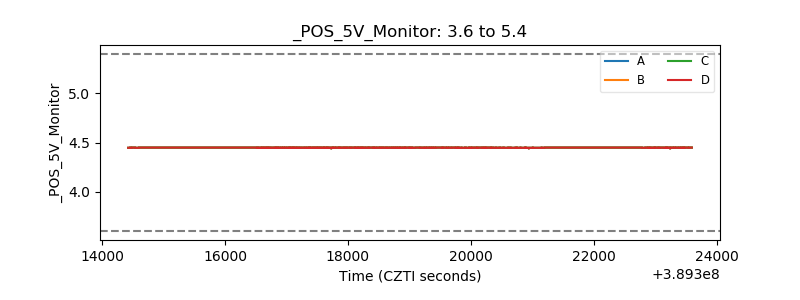 |
| _ROLL_ROT | 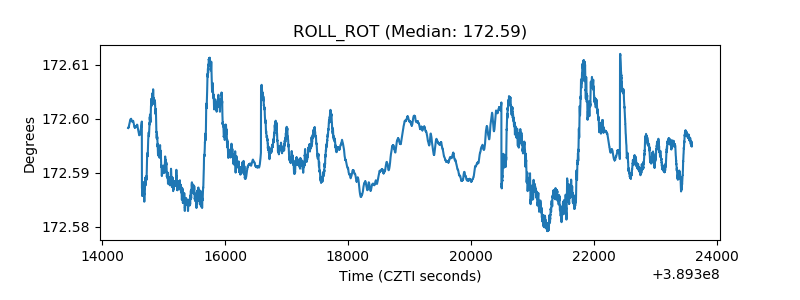 |
| _Roll_DEC | 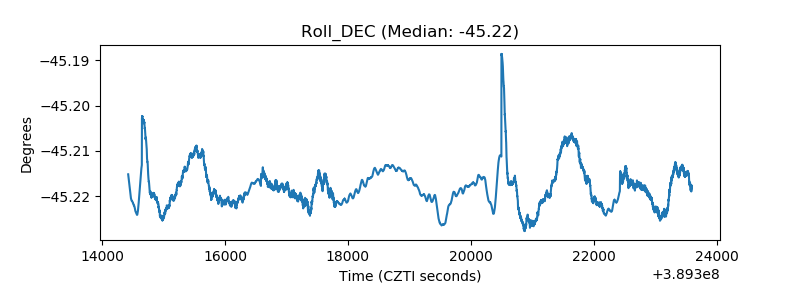 |
| _Roll_RA | 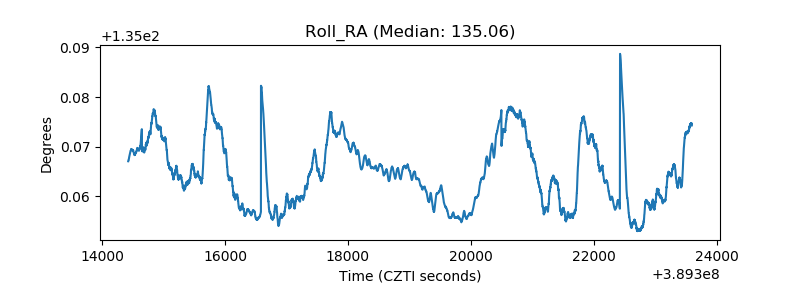 |
| Veto Counter | 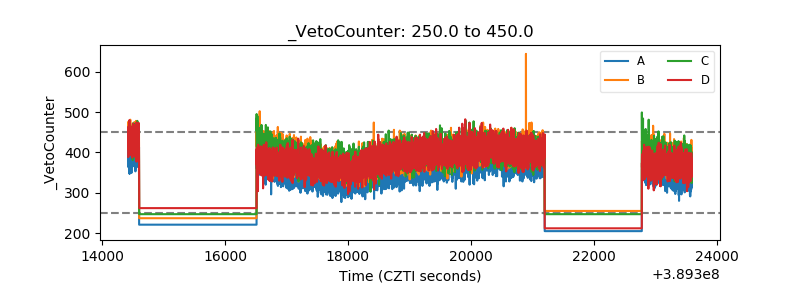 |