| Param | Original file | Final file |
|---|---|---|
| Filename | modeM0/AS1A09_029T02_9000005106cztM0_level2_bc.evt | modeM0/AS1A09_029T02_9000005106cztM0_level2_quad_clean.evt |
| Size (bytes) | 1,681,050,240 | 495,587,520 |
| Size | 1.6 GB | 472.6 MB |
| Events in quadrant A | 8,553,360 | 3,173,954 |
| Events in quadrant B | 16,097,132 | 3,096,894 |
| Events in quadrant C | 10,968,622 | 3,150,937 |
| Events in quadrant D | 12,703,862 | 2,981,035 |
| Mode SS | |||
|---|---|---|---|
| Quadrant | BADHDUFLAG | Total packets | Discarded packets |
| A | 0 | 776 | 0 |
| B | 0 | 776 | 0 |
| C | 0 | 776 | 0 |
| D | 0 | 776 | 0 |
| Mode M0 | |||
|---|---|---|---|
| Quadrant | BADHDUFLAG | Total packets | Discarded packets |
| A | 0 | 78021 | 0 |
| B | 0 | 108558 | 0 |
| C | 0 | 85492 | 0 |
| D | 0 | 94356 | 0 |
| Mode M9 | |||
|---|---|---|---|
| Quadrant | BADHDUFLAG | Total packets | Discarded packets |
| A | 0 | 131 | 0 |
| B | 0 | 131 | 0 |
| C | 0 | 131 | 0 |
| D | 0 | 131 | 0 |
| Quadrant | Total seconds | Saturated seconds | Saturation percentage |
|---|---|---|---|
| A | 37959 | 56 | 0.147528% |
| B | 37959 | 2980 | 7.850576% |
| C | 37959 | 841 | 2.215548% |
| D | 37959 | 1247 | 3.285123% |
Noise dominated data is calculated using 1-second bins in cleaned event files. If a bin has >2000 counts, and if more than 50% of those come from <1% of pixels, then it is considered to be noise-dominated and hence unusable.
| Quadrant | # 1 sec bins | Bins with >0 counts | Bins with >2000 counts | High rate bins dominated by noise | Noise dominated (total time) | Noise dominated (detector-on time) | Marked lightcurve |
|---|---|---|---|---|---|---|---|
| A | 51067 | 37967 | 6 | 6 | 0.01% | 0.02% |  |
| B | 51067 | 37958 | 543 | 543 | 1.06% | 1.43% |  |
| C | 51067 | 37959 | 150 | 150 | 0.29% | 0.40% |  |
| D | 51067 | 37956 | 221 | 221 | 0.43% | 0.58% |  |
Top three noisy pixels from each quadrant. If the there are fewer than three noisy pixels in the level2.evt file, extra rows are filled as -1
| Pixel properties | Quadrant properties | ||||||
|---|---|---|---|---|---|---|---|
| Quadrant | DetID | PixID | Counts | Sigma | Mean | Median | Sigma |
| A | 10 | 83 | 757618 | 1794.31 | 1889 | 1855 | 421.2 |
| A | 15 | 169 | 264999 | 624.75 | 1889 | 1855 | 421.2 |
| A | 7 | 16 | 108547 | 253.3 | 1889 | 1855 | 421.2 |
| B | 5 | 172 | 4258036 | 11505.2 | 1852 | 1811 | 369.9 |
| B | 5 | 31 | 2948110 | 7964.28 | 1852 | 1811 | 369.9 |
| B | 5 | 255 | 723823 | 1951.7 | 1852 | 1811 | 369.9 |
| C | 15 | 214 | 1473877 | 3499.0 | 1835 | 1817 | 420.7 |
| C | 0 | 10 | 1057492 | 2509.28 | 1835 | 1817 | 420.7 |
| C | 1 | 23 | 561129 | 1329.45 | 1835 | 1817 | 420.7 |
| D | 13 | 249 | 2955009 | 6666.24 | 1840 | 1779 | 443.0 |
| D | 8 | 195 | 471269 | 1059.77 | 1840 | 1779 | 443.0 |
| D | 10 | 118 | 298580 | 669.96 | 1840 | 1779 | 443.0 |
Histogram calculated using DETX and DETY for each event in the final _common_clean file
| Quadrant A |  |
 |
Quadrant B |
|---|---|---|---|
| Quadrant D |  |
 |
Quadrant C |
| Plot type | Count rate plots | Images |
|---|---|---|
| Comparison with Poisson distribution Blue bars denote a histogram of data divided into 1 sec bins. Red curve is a Poisson curve with rate = median count rate of data. |
 |
 |
| Quadrant-wise count rates Data is divided into 100 sec bins |
 |
|
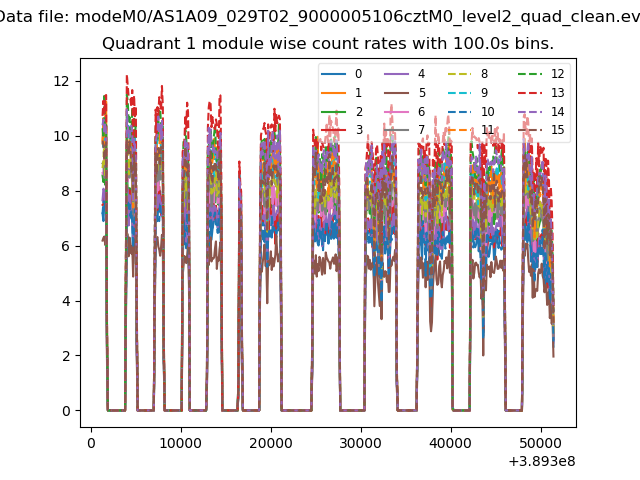
| Module-wise count rates for Quadrant A Data is divided into 100 sec bins |
 |
 |
| Module-wise count rates for Quadrant B Data is divided into 100 sec bins |
 |
 |
| Module-wise count rates for Quadrant C Data is divided into 100 sec bins |
 |
 |
| Module-wise count rates for Quadrant D Data is divided into 100 sec bins |
 |
 |
| Parameter | Plot |
|---|---|
| CZT HV Monitor |  |
| D_VDD |  |
| Temperature 1 |  |
| Veto HV Monitor |  |
| Veto LLD |  |
| Alpha Counter |  |
| _CPM_Rate |  |
| CZT Counter |  |
| +2.5 Volts monitor |  |
| +5 Volts monitor |  |
| _ROLL_ROT |  |
| _Roll_DEC |  |
| _Roll_RA |  |
| Veto Counter |  |