| Param | Original file | Final file |
|---|---|---|
| Filename | modeM0/AS1C07_001T07_9000005104_35668cztM0_level2.evt | modeM0/AS1C07_001T07_9000005104_35668cztM0_level2_quad_clean.evt |
| Size (bytes) | 130,947,840 | 30,335,040 |
| Size | 124.9 MB | 28.9 MB |
| Events in quadrant A | 844,694 | 204,313 |
| Events in quadrant B | 812,288 | 213,279 |
| Events in quadrant C | 979,068 | 207,532 |
| Events in quadrant D | 1,233,603 | 190,413 |
| Mode SS | |||
|---|---|---|---|
| Quadrant | BADHDUFLAG | Total packets | Discarded packets |
| A | 0 | 28 | 0 |
| B | 0 | 28 | 0 |
| C | 0 | 28 | 0 |
| D | 0 | 28 | 0 |
| Mode M9 | |||
|---|---|---|---|
| Quadrant | BADHDUFLAG | Total packets | Discarded packets |
| A | 0 | 4 | 0 |
| B | 0 | 4 | 0 |
| C | 0 | 4 | 0 |
| D | 0 | 5 | 0 |
| Mode M0 | |||
|---|---|---|---|
| Quadrant | BADHDUFLAG | Total packets | Discarded packets |
| A | 0 | 3394 | 1 |
| B | 0 | 3220 | 1 |
| C | 0 | 3785 | 1 |
| D | 0 | 4564 | 1 |
| Quadrant | Total seconds | Saturated seconds | Saturation percentage |
|---|---|---|---|
| A | 1375 | 6 | 0.436364% |
| B | 1375 | 17 | 1.236364% |
| C | 1375 | 83 | 6.036364% |
| D | 1375 | 153 | 11.127273% |
Noise dominated data is calculated using 1-second bins in cleaned event files. If a bin has >2000 counts, and if more than 50% of those come from <1% of pixels, then it is considered to be noise-dominated and hence unusable.
| Quadrant | # 1 sec bins | Bins with >0 counts | Bins with >2000 counts | High rate bins dominated by noise | Noise dominated (total time) | Noise dominated (detector-on time) | Marked lightcurve |
|---|---|---|---|---|---|---|---|
| A | 1378 | 1378 | 0 | 0 | 0.00% | 0.00% |  |
| B | 1378 | 1378 | 7 | 7 | 0.51% | 0.51% |  |
| C | 1378 | 1378 | 66 | 66 | 4.79% | 4.79% |  |
| D | 1378 | 1378 | 133 | 133 | 9.65% | 9.65% |  |
Top three noisy pixels from each quadrant. If the there are fewer than three noisy pixels in the level2.evt file, extra rows are filled as -1
| Pixel properties | Quadrant properties | ||||||
|---|---|---|---|---|---|---|---|
| Quadrant | DetID | PixID | Counts | Sigma | Mean | Median | Sigma |
| A | 15 | 169 | 102027 | 2833.69 | 172 | 169 | 35.9 |
| A | 10 | 83 | 58932 | 1634.79 | 172 | 169 | 35.9 |
| A | 13 | 6 | 14612 | 401.8 | 172 | 169 | 35.9 |
| B | 5 | 255 | 59844 | 1777.17 | 174 | 169 | 33.6 |
| B | 5 | 172 | 42694 | 1266.43 | 174 | 169 | 33.6 |
| B | 5 | 200 | 9617 | 281.37 | 174 | 169 | 33.6 |
| C | 0 | 10 | 154104 | 3789.57 | 172 | 173 | 40.6 |
| C | 1 | 23 | 62007 | 1522.27 | 172 | 173 | 40.6 |
| C | 15 | 214 | 58257 | 1429.95 | 172 | 173 | 40.6 |
| D | 10 | 234 | 195899 | 4784.19 | 166 | 162 | 40.9 |
| D | 10 | 249 | 91402 | 2230.08 | 166 | 162 | 40.9 |
| D | 2 | 249 | 67696 | 1650.66 | 166 | 162 | 40.9 |
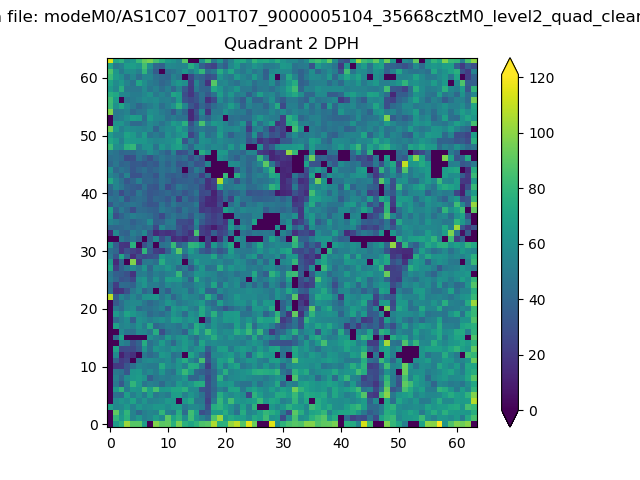
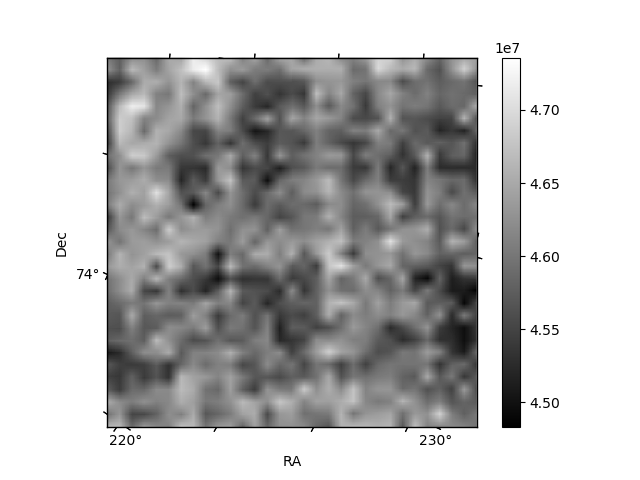
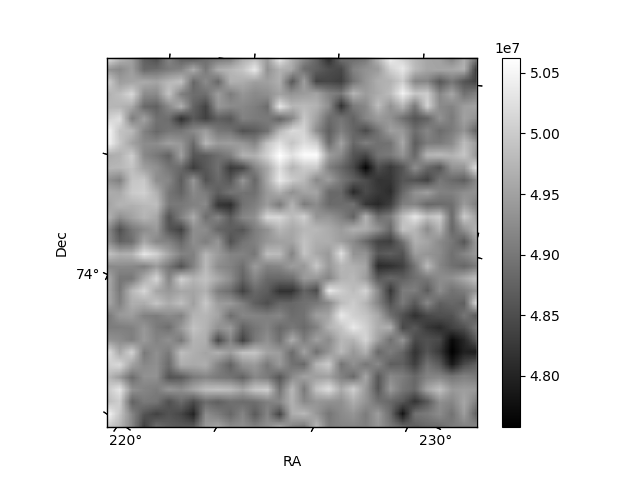
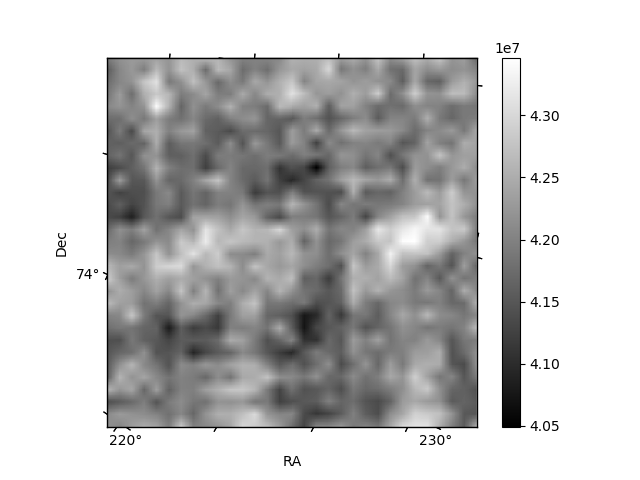
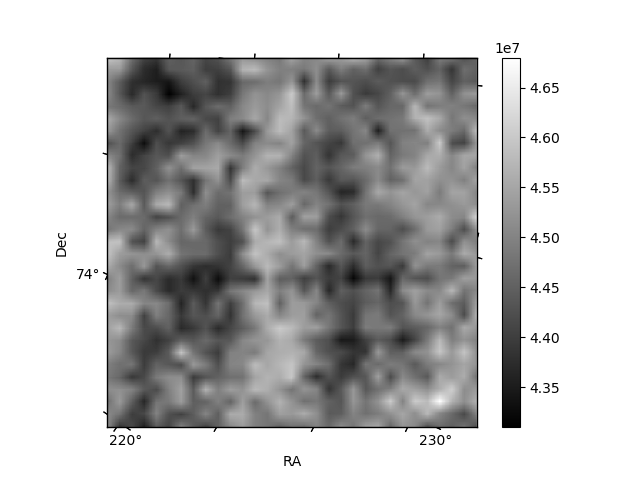
Histogram calculated using DETX and DETY for each event in the final _common_clean file
| Quadrant A | 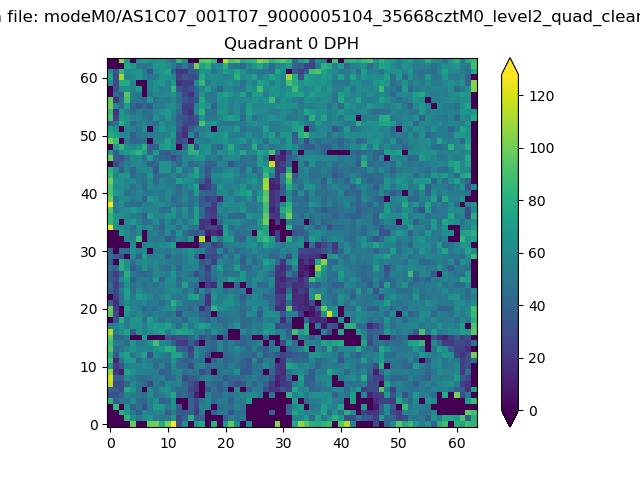 |
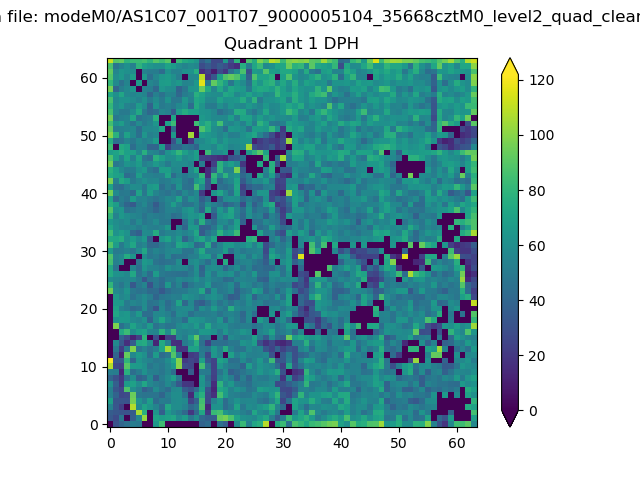 |
Quadrant B |
|---|---|---|---|
| Quadrant D | 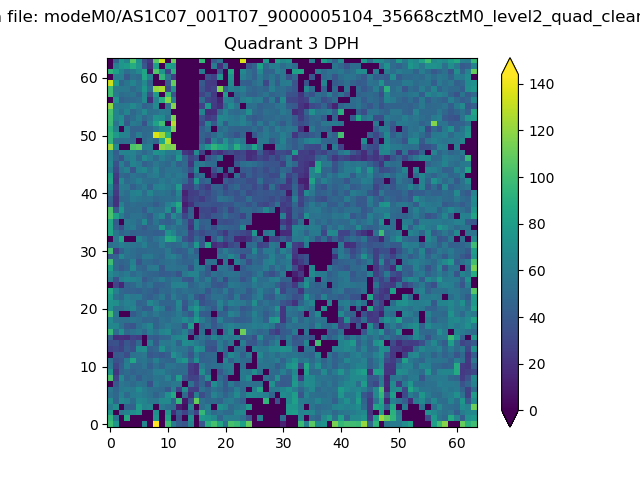 |
 |
Quadrant C |
| Plot type | Count rate plots | Images |
|---|---|---|
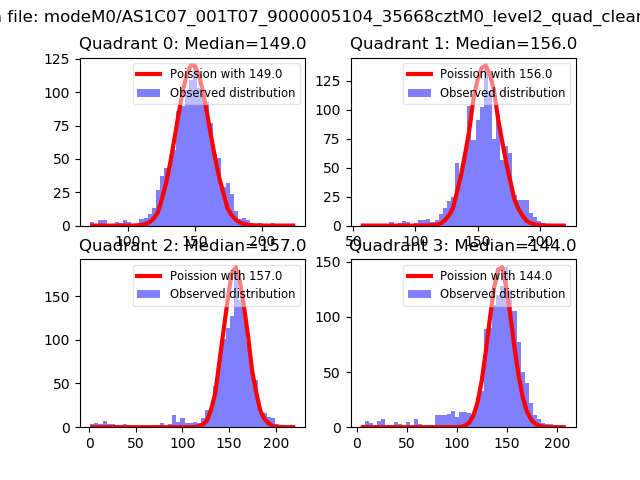
| Comparison with Poisson distribution Blue bars denote a histogram of data divided into 1 sec bins. Red curve is a Poisson curve with rate = median count rate of data. |
 |
 |
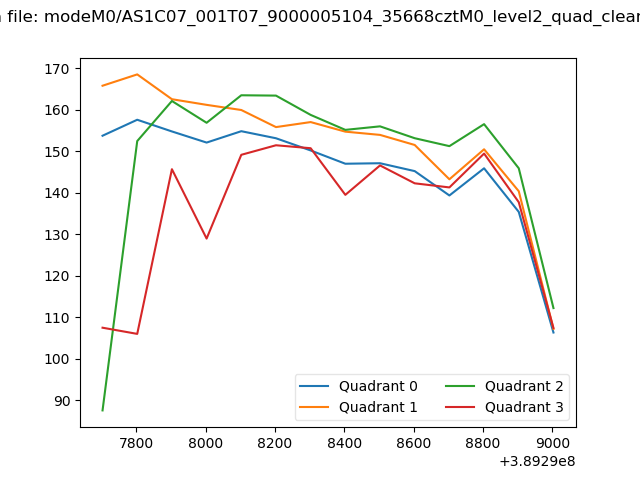
| Quadrant-wise count rates Data is divided into 100 sec bins |
 |
|
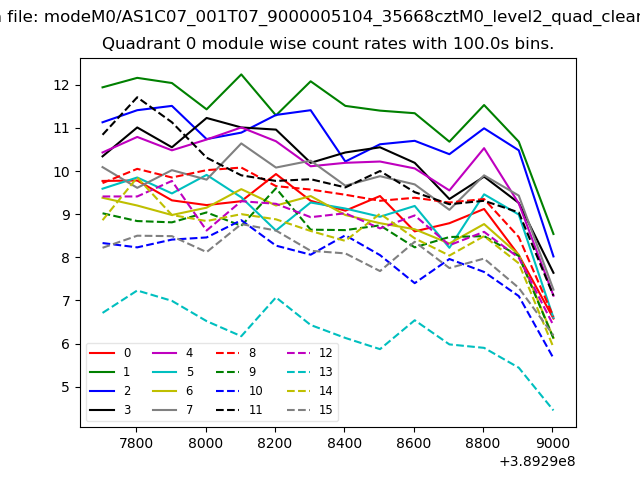
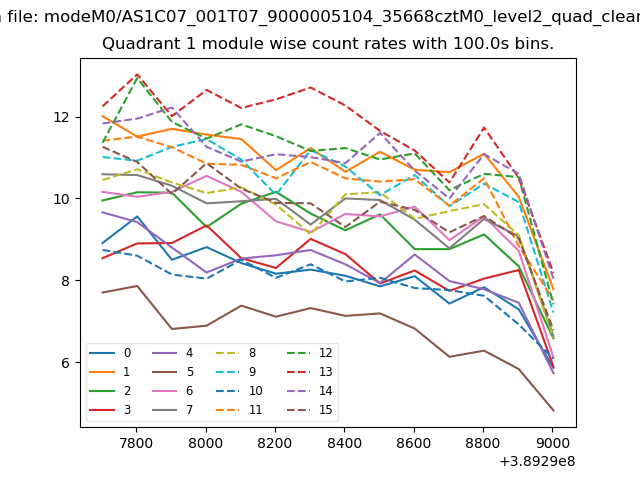
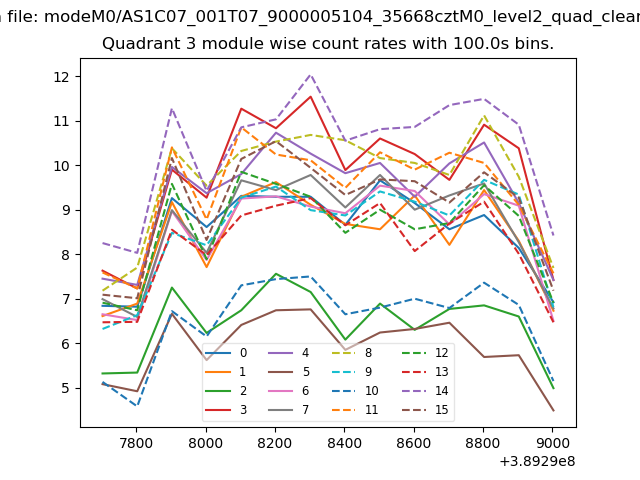
| Module-wise count rates for Quadrant A Data is divided into 100 sec bins |
 |
 |
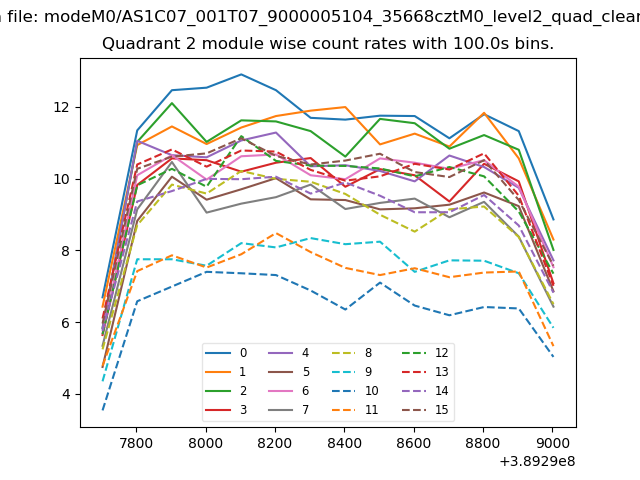
| Module-wise count rates for Quadrant B Data is divided into 100 sec bins |
 |
 |
| Module-wise count rates for Quadrant C Data is divided into 100 sec bins |
 |
 |
| Module-wise count rates for Quadrant D Data is divided into 100 sec bins |
 |
 |
| Parameter | Plot |
|---|---|
| CZT HV Monitor | 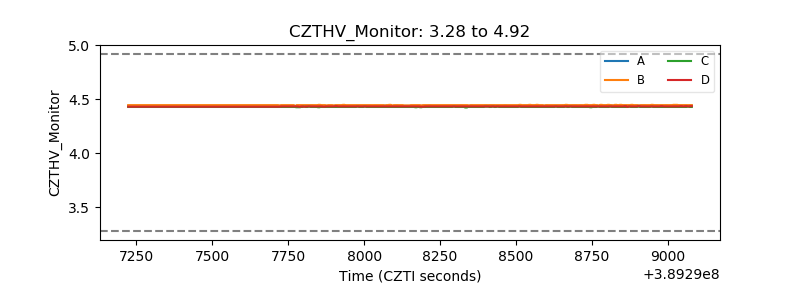 |
| D_VDD | 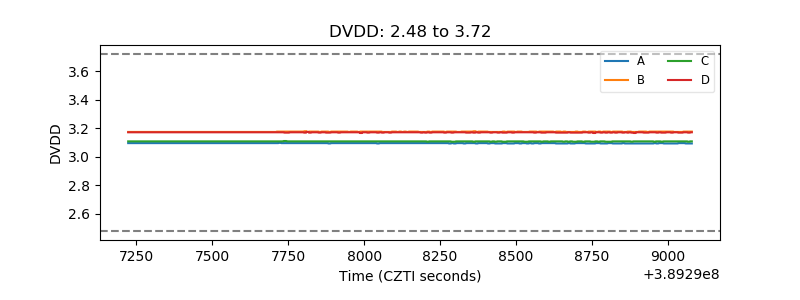 |
| Temperature 1 | 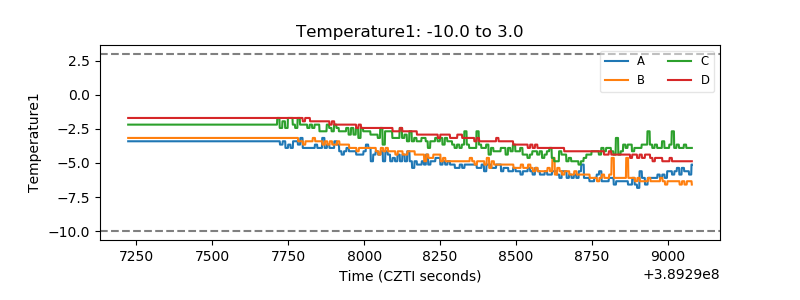 |
| Veto HV Monitor | 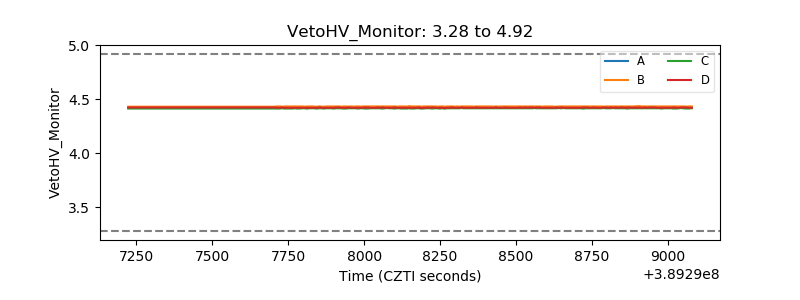 |
| Veto LLD | 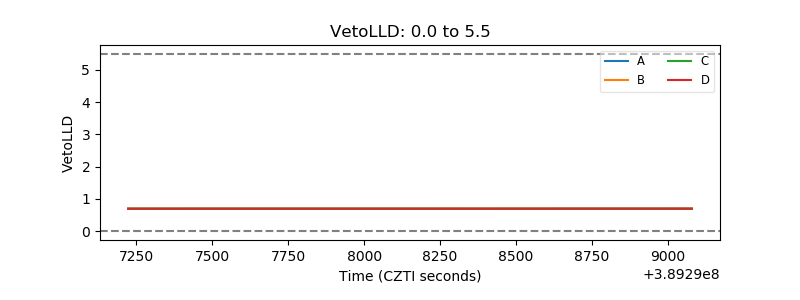 |
| Alpha Counter | 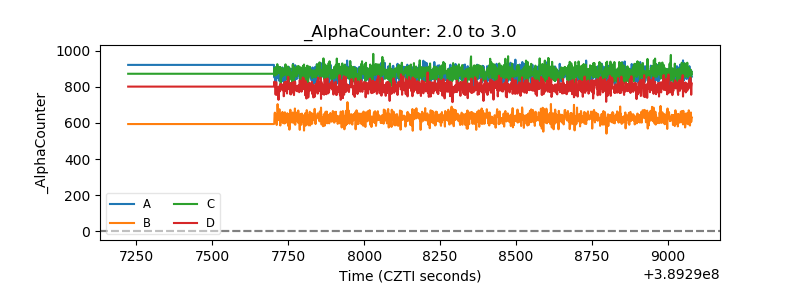 |
| _CPM_Rate | 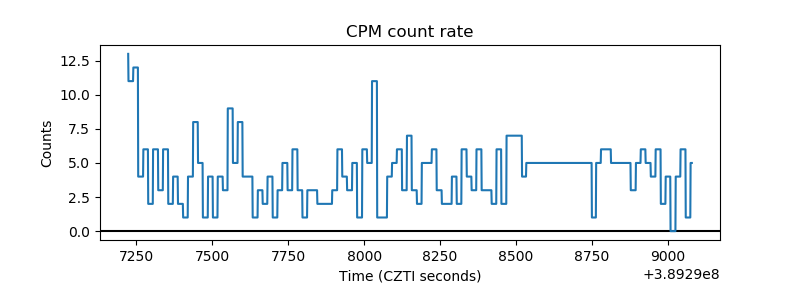 |
| CZT Counter | 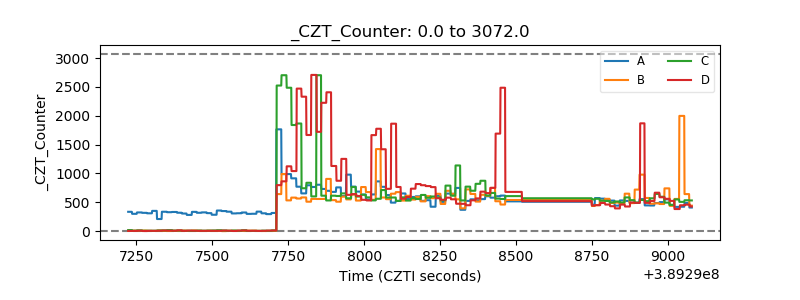 |
| +2.5 Volts monitor |  |
| +5 Volts monitor | 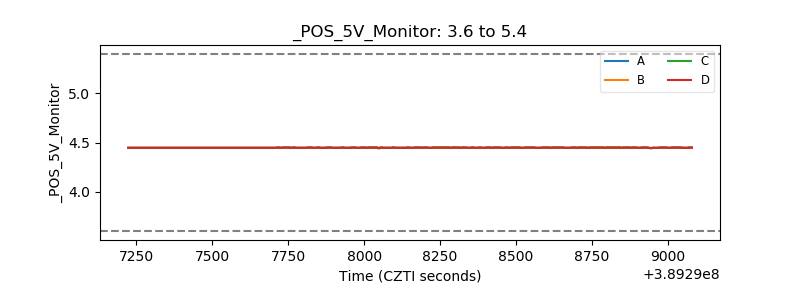 |
| _ROLL_ROT | 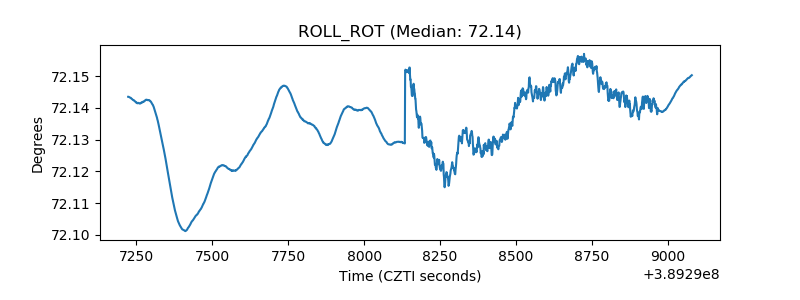 |
| _Roll_DEC | 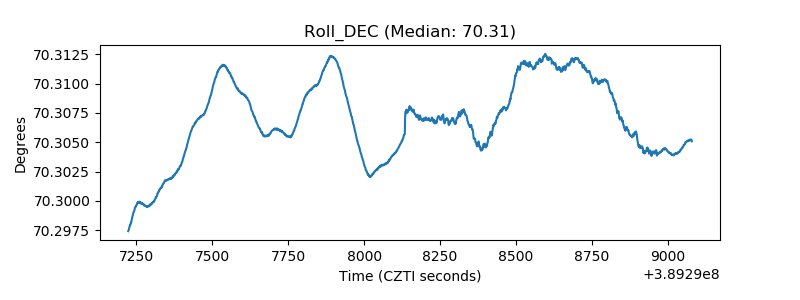 |
| _Roll_RA |  |
| Veto Counter | 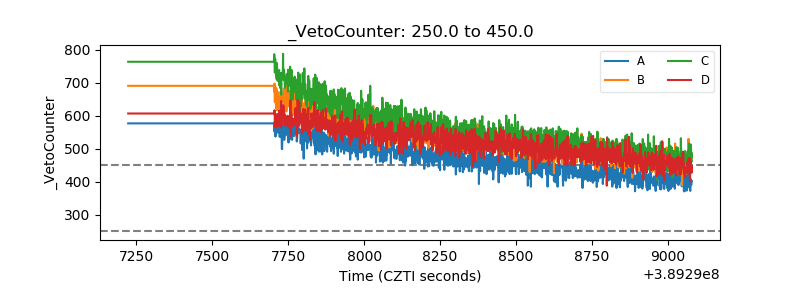 |