| Param | Original file | Final file |
|---|---|---|
| Filename | modeM0/AS1C07_001T07_9000005104_35666cztM0_level2.evt | modeM0/AS1C07_001T07_9000005104_35666cztM0_level2_quad_clean.evt |
| Size (bytes) | 489,136,320 | 106,948,800 |
| Size | 466.5 MB | 102.0 MB |
| Events in quadrant A | 2,864,748 | 731,850 |
| Events in quadrant B | 4,358,808 | 707,589 |
| Events in quadrant C | 3,415,058 | 736,781 |
| Events in quadrant D | 3,824,663 | 700,758 |
| Mode SS | |||
|---|---|---|---|
| Quadrant | BADHDUFLAG | Total packets | Discarded packets |
| A | 0 | 104 | 0 |
| B | 0 | 104 | 0 |
| C | 0 | 104 | 0 |
| D | 0 | 104 | 0 |
| Mode M9 | |||
|---|---|---|---|
| Quadrant | BADHDUFLAG | Total packets | Discarded packets |
| A | 0 | 24 | 0 |
| B | 0 | 24 | 0 |
| C | 0 | 24 | 0 |
| D | 0 | 25 | 0 |
| Mode M0 | |||
|---|---|---|---|
| Quadrant | BADHDUFLAG | Total packets | Discarded packets |
| A | 0 | 11922 | 3 |
| B | 0 | 16362 | 2 |
| C | 0 | 13288 | 2 |
| D | 0 | 14891 | 2 |
| Quadrant | Total seconds | Saturated seconds | Saturation percentage |
|---|---|---|---|
| A | 5168 | 54 | 1.044892% |
| B | 5168 | 611 | 11.822755% |
| C | 5168 | 237 | 4.585913% |
| D | 5168 | 262 | 5.069659% |
Noise dominated data is calculated using 1-second bins in cleaned event files. If a bin has >2000 counts, and if more than 50% of those come from <1% of pixels, then it is considered to be noise-dominated and hence unusable.
| Quadrant | # 1 sec bins | Bins with >0 counts | Bins with >2000 counts | High rate bins dominated by noise | Noise dominated (total time) | Noise dominated (detector-on time) | Marked lightcurve |
|---|---|---|---|---|---|---|---|
| A | 7143 | 5168 | 21 | 21 | 0.29% | 0.41% | 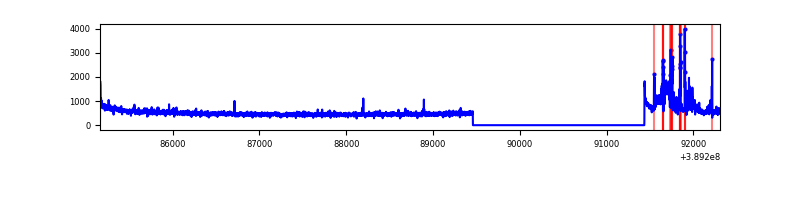 |
| B | 7143 | 5168 | 444 | 444 | 6.22% | 8.59% | 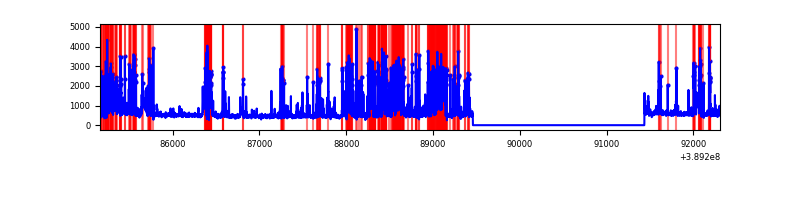 |
| C | 7143 | 5168 | 200 | 200 | 2.80% | 3.87% | 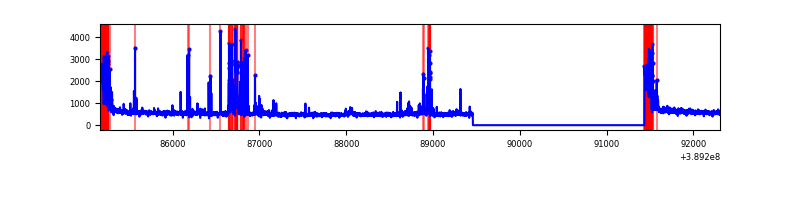 |
| D | 7143 | 5168 | 237 | 237 | 3.32% | 4.59% | 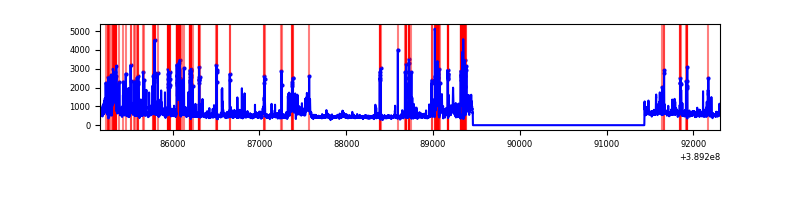 |
Top three noisy pixels from each quadrant. If the there are fewer than three noisy pixels in the level2.evt file, extra rows are filled as -1
| Pixel properties | Quadrant properties | ||||||
|---|---|---|---|---|---|---|---|
| Quadrant | DetID | PixID | Counts | Sigma | Mean | Median | Sigma |
| A | 15 | 169 | 252349 | 2001.96 | 628 | 618 | 125.7 |
| A | 10 | 83 | 150692 | 1193.51 | 628 | 618 | 125.7 |
| A | 13 | 6 | 16998 | 130.27 | 628 | 618 | 125.7 |
| B | 5 | 172 | 1704657 | 15194.25 | 602 | 587 | 112.2 |
| B | 5 | 255 | 217584 | 1934.84 | 602 | 587 | 112.2 |
| B | 3 | 112 | 29638 | 259.03 | 602 | 587 | 112.2 |
| C | 0 | 10 | 407470 | 2879.69 | 617 | 620 | 141.3 |
| C | 1 | 23 | 374046 | 2643.11 | 617 | 620 | 141.3 |
| C | 15 | 214 | 211694 | 1493.98 | 617 | 620 | 141.3 |
| D | 7 | 80 | 462424 | 3107.68 | 617 | 603 | 148.6 |
| D | 13 | 249 | 432769 | 2908.12 | 617 | 603 | 148.6 |
| D | 8 | 230 | 164180 | 1100.74 | 617 | 603 | 148.6 |
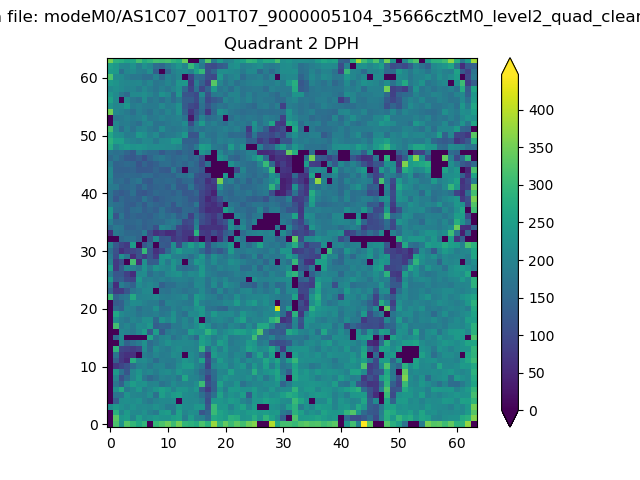
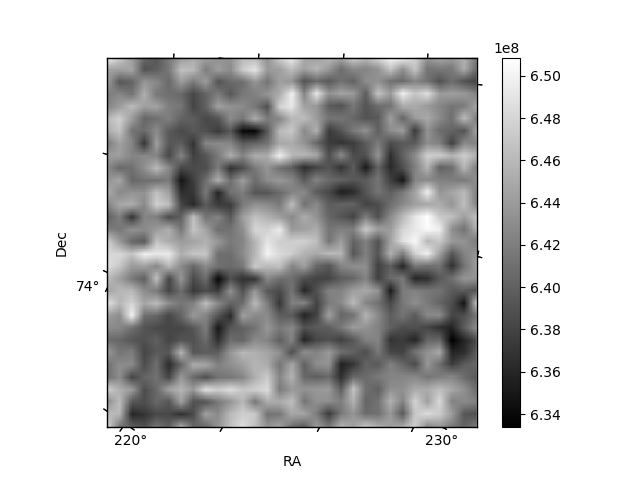
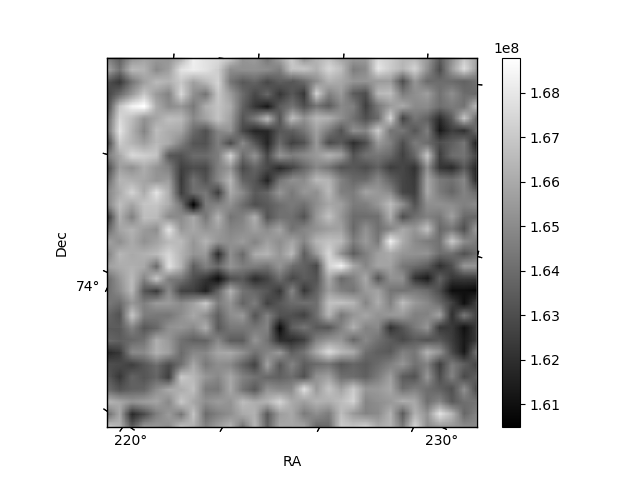
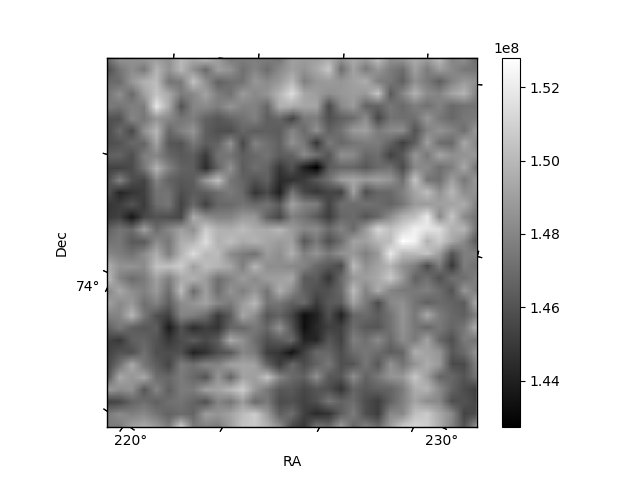
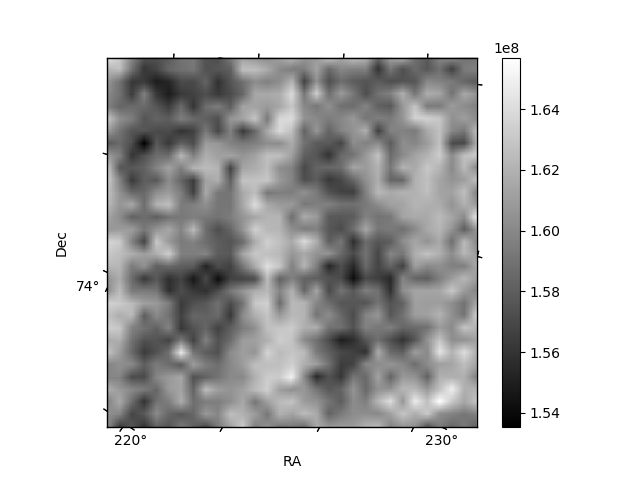
Histogram calculated using DETX and DETY for each event in the final _common_clean file
| Quadrant A | 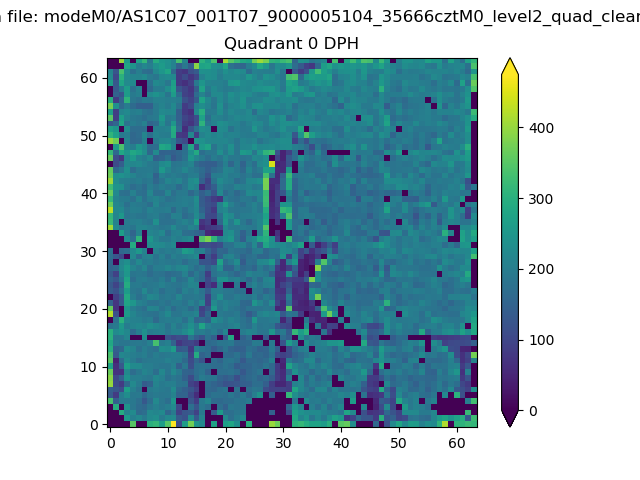 |
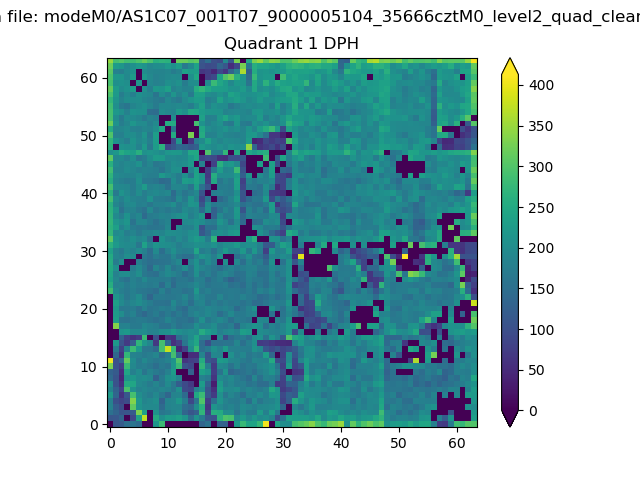 |
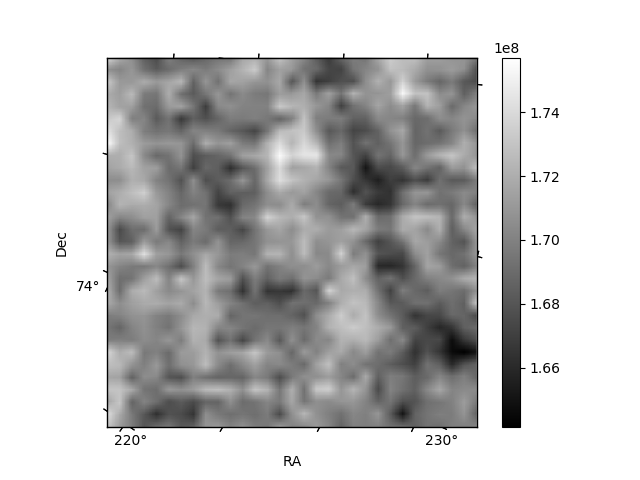
Quadrant B |
|---|---|---|---|
| Quadrant D | 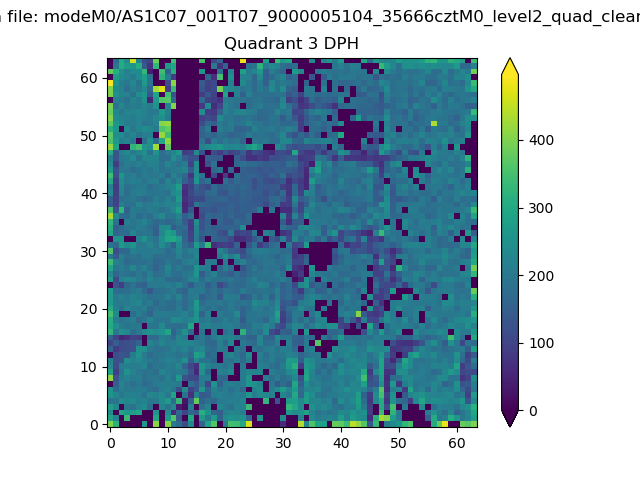 |
 |
Quadrant C |
| Plot type | Count rate plots | Images |
|---|---|---|
| Comparison with Poisson distribution Blue bars denote a histogram of data divided into 1 sec bins. Red curve is a Poisson curve with rate = median count rate of data. |
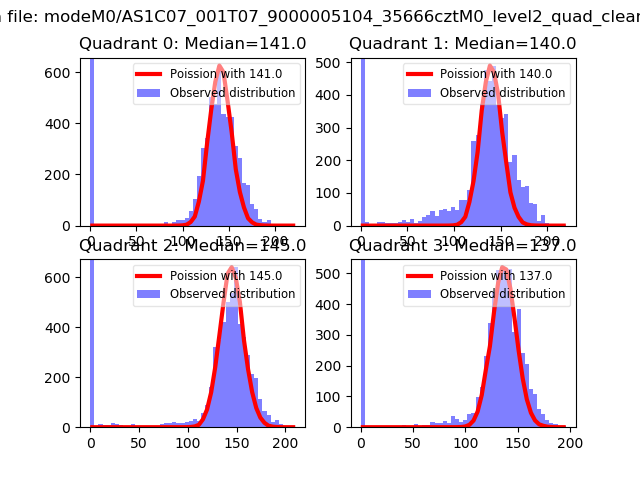 |
 |
| Quadrant-wise count rates Data is divided into 100 sec bins |
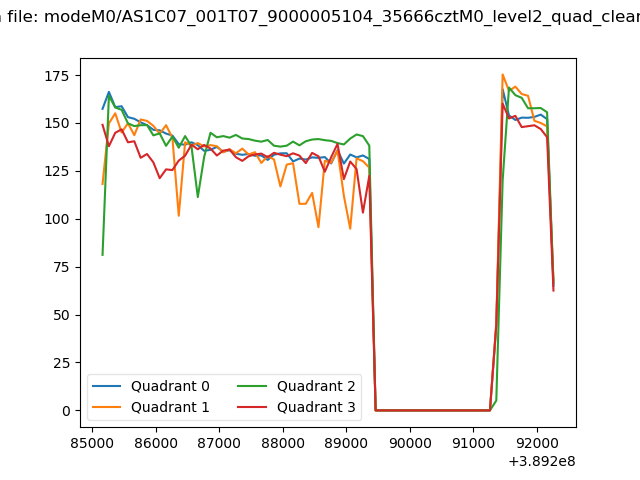 |
|
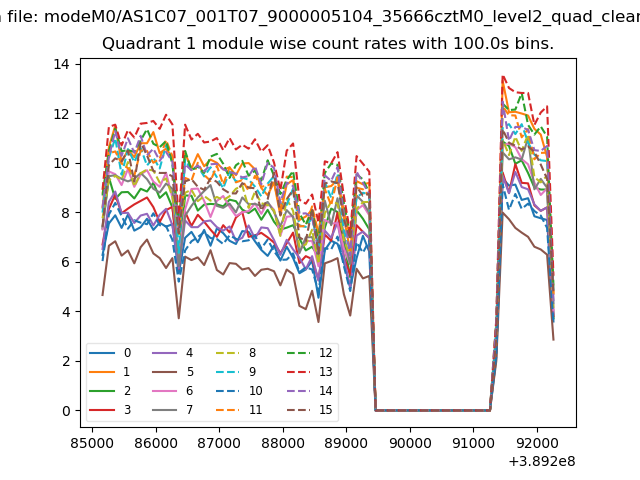
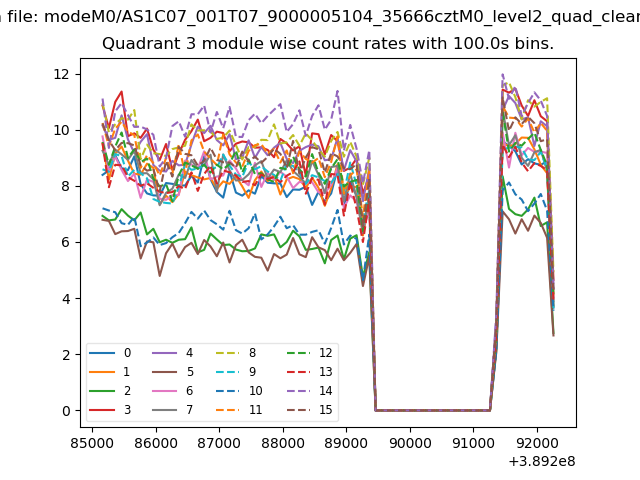
| Module-wise count rates for Quadrant A Data is divided into 100 sec bins |
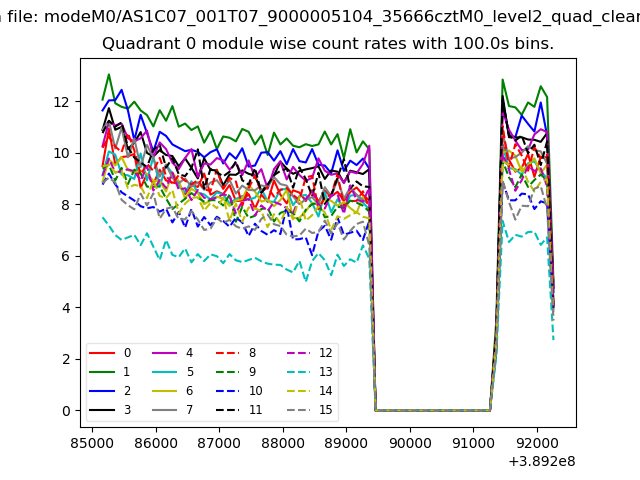 |
 |
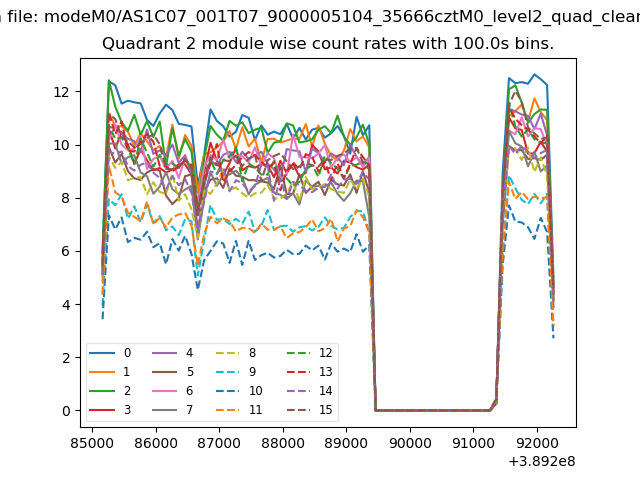
| Module-wise count rates for Quadrant B Data is divided into 100 sec bins |
 |
 |
| Module-wise count rates for Quadrant C Data is divided into 100 sec bins |
 |
 |
| Module-wise count rates for Quadrant D Data is divided into 100 sec bins |
 |
 |
| Parameter | Plot |
|---|---|
| CZT HV Monitor |  |
| D_VDD | 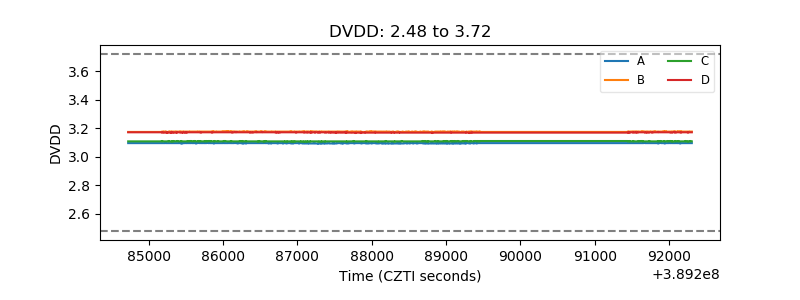 |
| Temperature 1 | 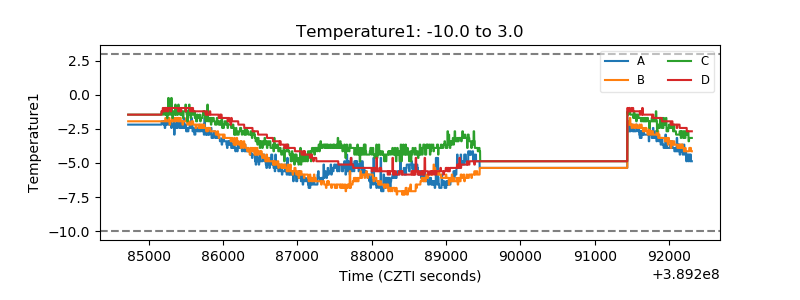 |
| Veto HV Monitor | 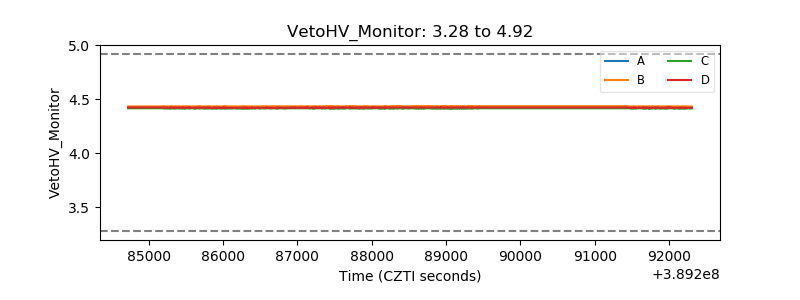 |
| Veto LLD | 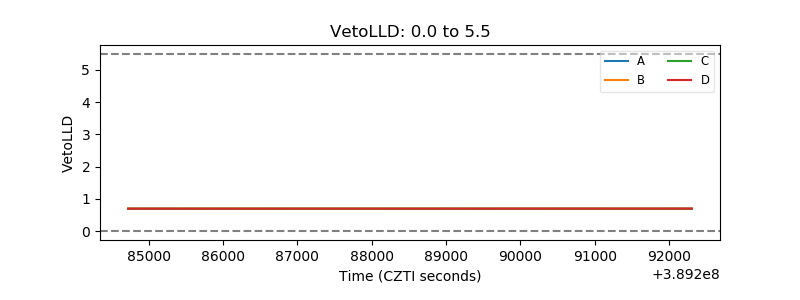 |
| Alpha Counter | 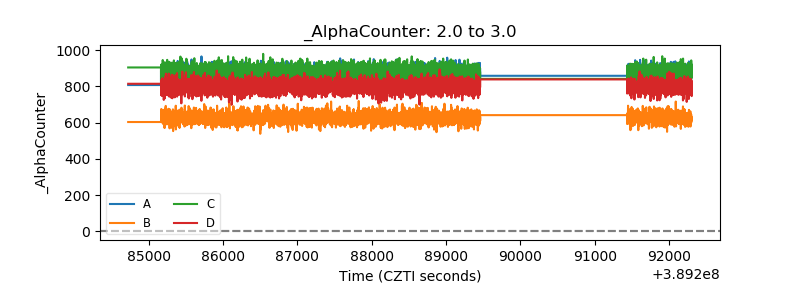 |
| _CPM_Rate | 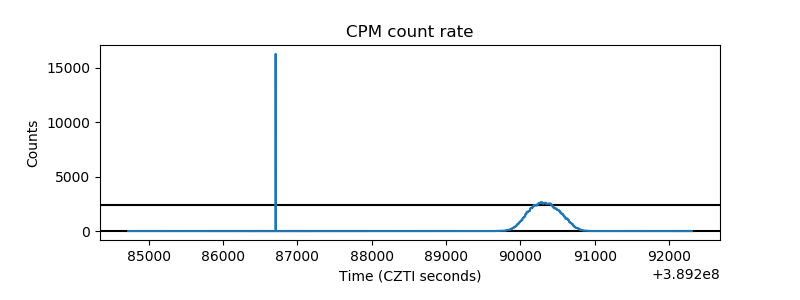 |
| CZT Counter | 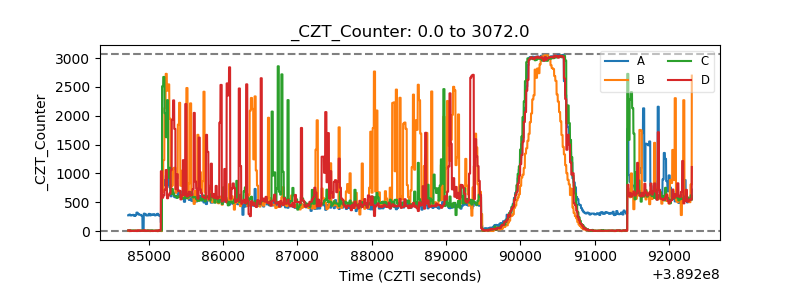 |
| +2.5 Volts monitor | 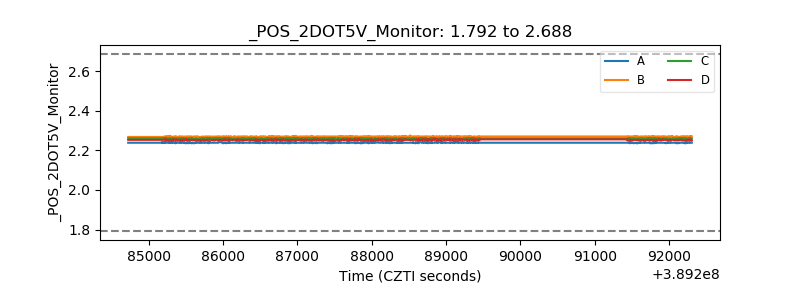 |
| +5 Volts monitor | 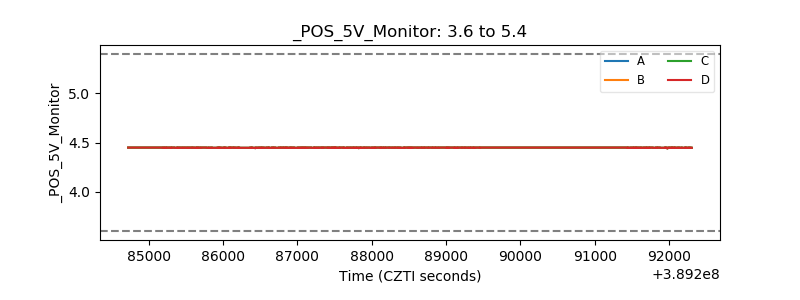 |
| _ROLL_ROT | 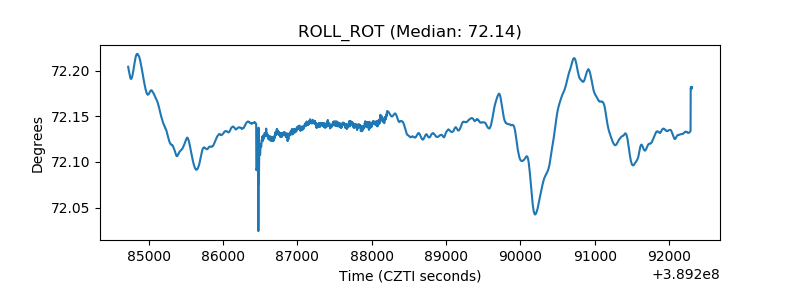 |
| _Roll_DEC | 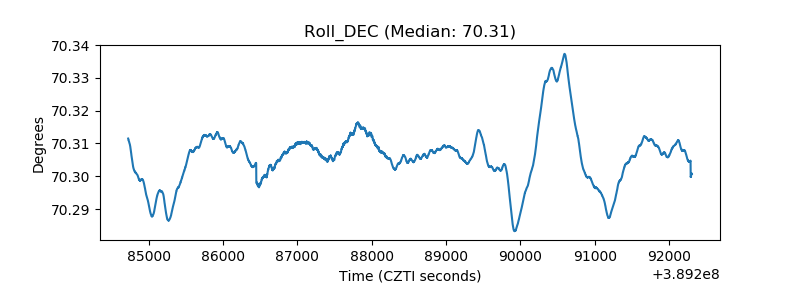 |
| _Roll_RA | 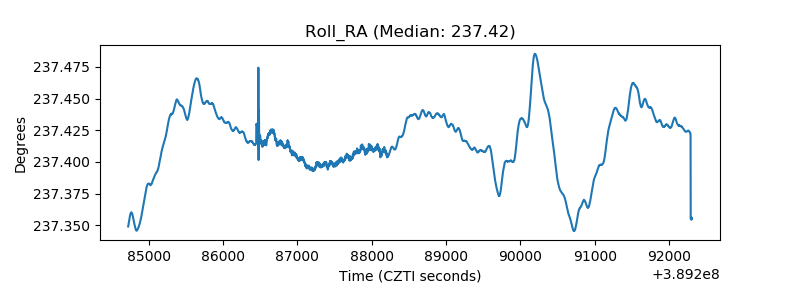 |
| Veto Counter | 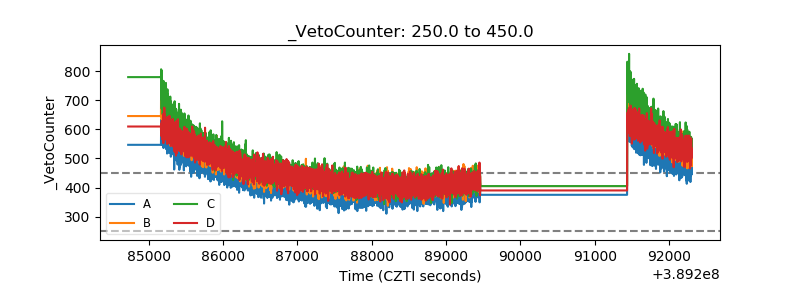 |