| Param | Original file | Final file |
|---|---|---|
| Filename | modeM0/AS1C07_001T07_9000005104_35648cztM0_level2.evt | modeM0/AS1C07_001T07_9000005104_35648cztM0_level2_quad_clean.evt |
| Size (bytes) | 295,666,560 | 23,970,240 |
| Size | 282.0 MB | 22.9 MB |
| Events in quadrant A | 4,746,757 | 77,981 |
| Events in quadrant B | 1,796,558 | 161,435 |
| Events in quadrant C | 1,288,230 | 176,797 |
| Events in quadrant D | 991,981 | 169,901 |
| Mode SS | |||
|---|---|---|---|
| Quadrant | BADHDUFLAG | Total packets | Discarded packets |
| A | 0 | 40 | 0 |
| B | 0 | 40 | 0 |
| C | 0 | 40 | 0 |
| D | 0 | 40 | 0 |
| Mode M9 | |||
|---|---|---|---|
| Quadrant | BADHDUFLAG | Total packets | Discarded packets |
| A | 0 | 17 | 0 |
| B | 0 | 17 | 0 |
| C | 0 | 17 | 0 |
| D | 0 | 17 | 0 |
| Mode M0 | |||
|---|---|---|---|
| Quadrant | BADHDUFLAG | Total packets | Discarded packets |
| A | 0 | 15369 | 2 |
| B | 0 | 6538 | 1 |
| C | 0 | 4960 | 1 |
| D | 0 | 4197 | 1 |
| Quadrant | Total seconds | Saturated seconds | Saturation percentage |
|---|---|---|---|
| A | 1899 | 1899 | 100.000000% |
| B | 1899 | 350 | 18.430753% |
| C | 1899 | 119 | 6.266456% |
| D | 1899 | 16 | 0.842549% |
Noise dominated data is calculated using 1-second bins in cleaned event files. If a bin has >2000 counts, and if more than 50% of those come from <1% of pixels, then it is considered to be noise-dominated and hence unusable.
| Quadrant | # 1 sec bins | Bins with >0 counts | Bins with >2000 counts | High rate bins dominated by noise | Noise dominated (total time) | Noise dominated (detector-on time) | Marked lightcurve |
|---|---|---|---|---|---|---|---|
| A | 3570 | 1899 | 1867 | 1867 | 52.30% | 98.31% | 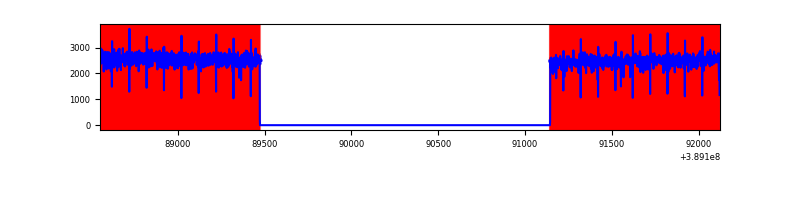 |
| B | 3571 | 1900 | 233 | 233 | 6.52% | 12.26% | 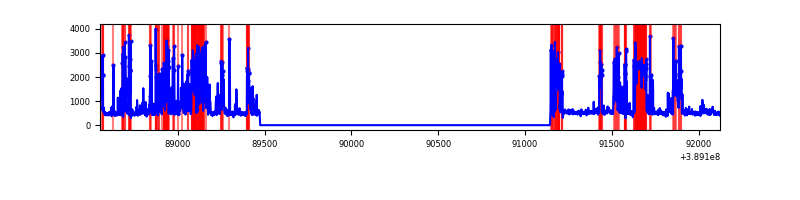 |
| C | 3571 | 1900 | 82 | 82 | 2.30% | 4.32% | 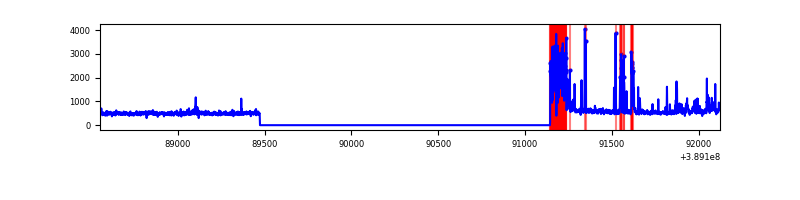 |
| D | 3571 | 1900 | 7 | 7 | 0.20% | 0.37% | 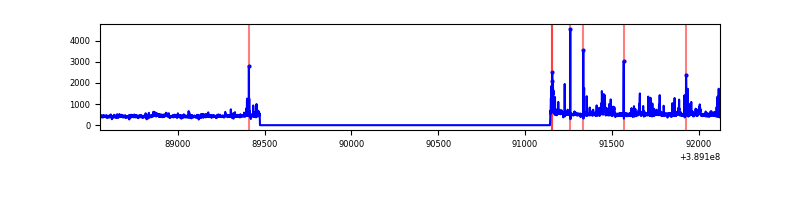 |
Top three noisy pixels from each quadrant. If the there are fewer than three noisy pixels in the level2.evt file, extra rows are filled as -1
| Pixel properties | Quadrant properties | ||||||
|---|---|---|---|---|---|---|---|
| Quadrant | DetID | PixID | Counts | Sigma | Mean | Median | Sigma |
| A | 15 | 169 | 4234613 | 162676.05 | 122 | 119 | 26.0 |
| A | 10 | 83 | 32590 | 1247.42 | 122 | 119 | 26.0 |
| A | 13 | 6 | 2418 | 88.3 | 122 | 119 | 26.0 |
| B | 5 | 172 | 955107 | 22381.54 | 210 | 205 | 42.7 |
| B | 12 | 111 | 5105 | 114.85 | 210 | 205 | 42.7 |
| B | 11 | 111 | 4656 | 104.33 | 210 | 205 | 42.7 |
| C | 0 | 10 | 231786 | 4542.14 | 216 | 217 | 51.0 |
| C | 12 | 249 | 83860 | 1640.62 | 216 | 217 | 51.0 |
| C | 15 | 214 | 78661 | 1538.65 | 216 | 217 | 51.0 |
| D | 2 | 249 | 44644 | 795.49 | 222 | 215 | 55.9 |
| D | 12 | 6 | 29272 | 520.26 | 222 | 215 | 55.9 |
| D | 8 | 195 | 16838 | 297.63 | 222 | 215 | 55.9 |
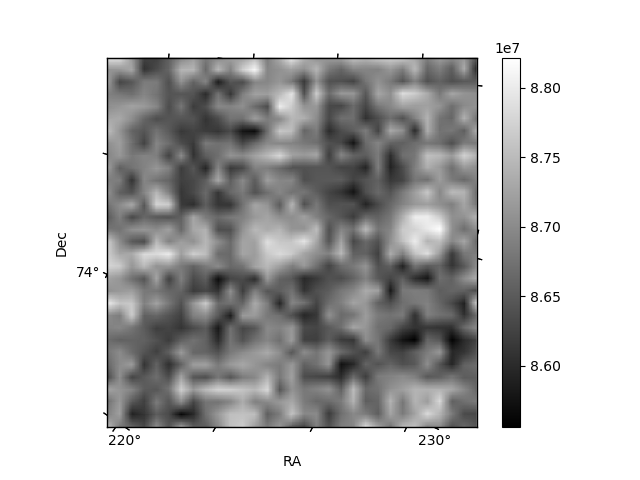
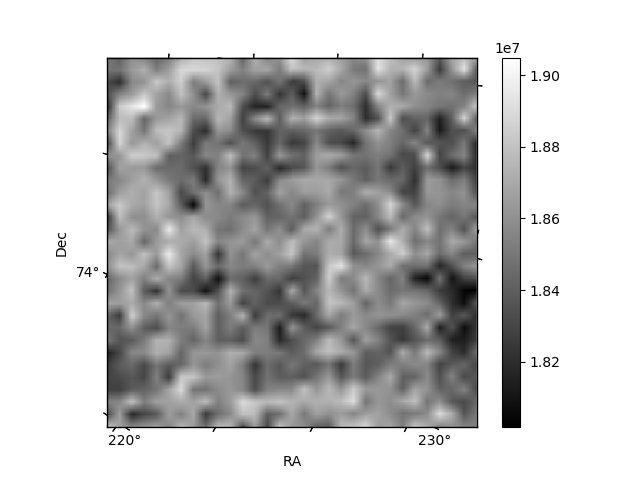
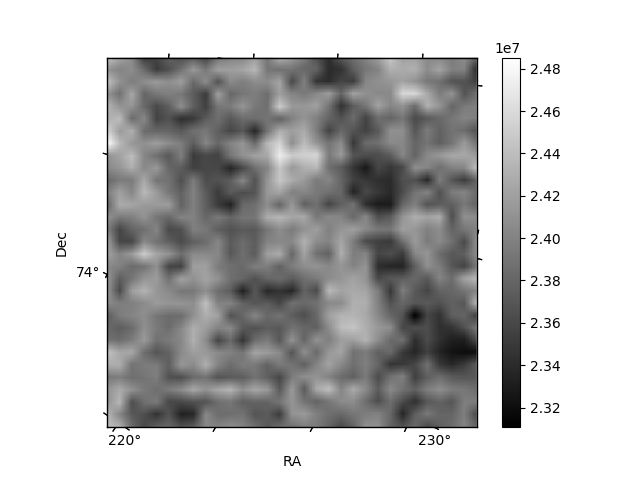
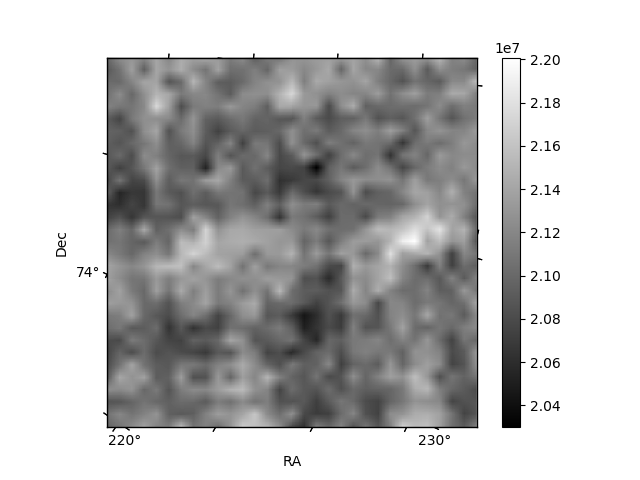
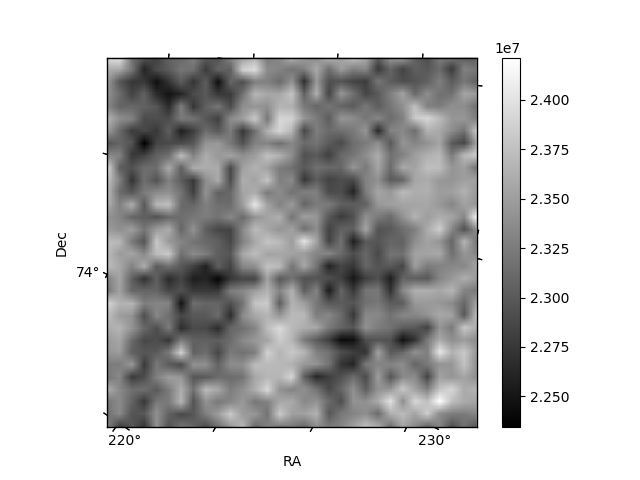
Histogram calculated using DETX and DETY for each event in the final _common_clean file
| Quadrant A | 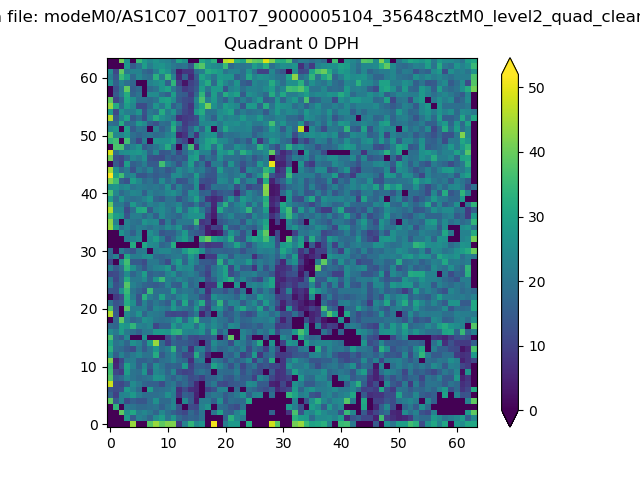 |
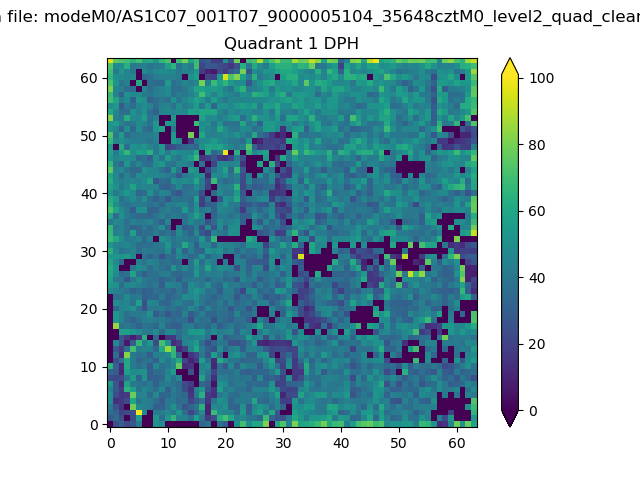 |
Quadrant B |
|---|---|---|---|
| Quadrant D | 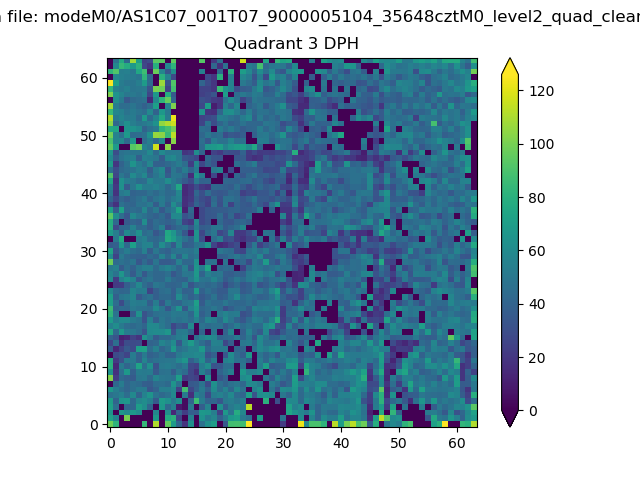 |
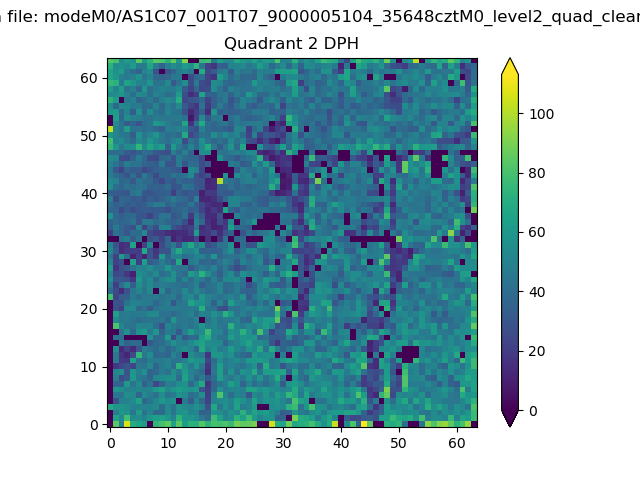 |
Quadrant C |
| Plot type | Count rate plots | Images |
|---|---|---|
| Comparison with Poisson distribution Blue bars denote a histogram of data divided into 1 sec bins. Red curve is a Poisson curve with rate = median count rate of data. |
 |
 |
| Quadrant-wise count rates Data is divided into 100 sec bins |
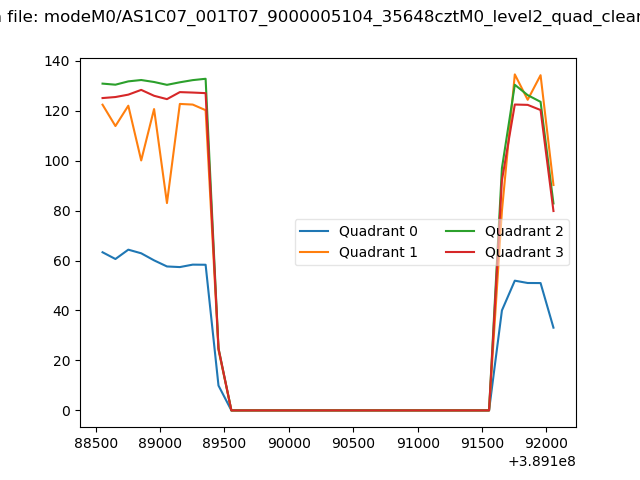 |
|
| Module-wise count rates for Quadrant A Data is divided into 100 sec bins |
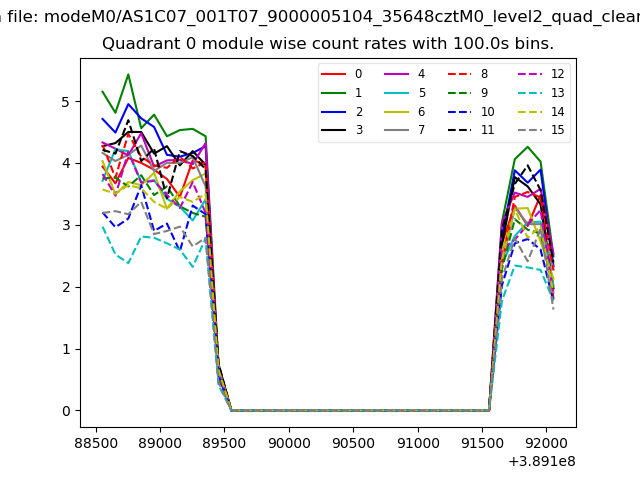 |
 |
| Module-wise count rates for Quadrant B Data is divided into 100 sec bins |
 |
 |
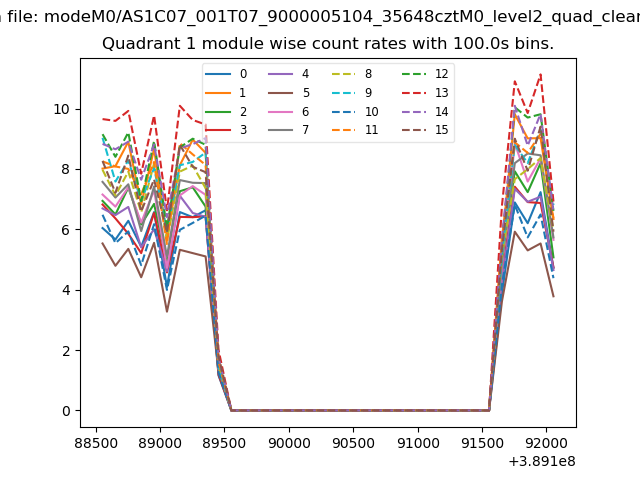
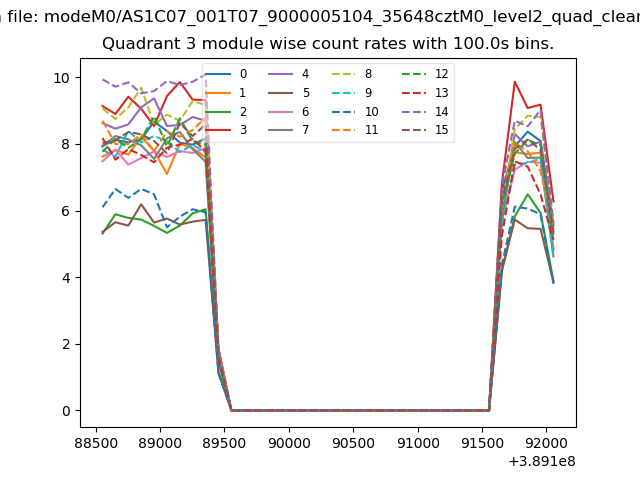
| Module-wise count rates for Quadrant C Data is divided into 100 sec bins |
 |
 |
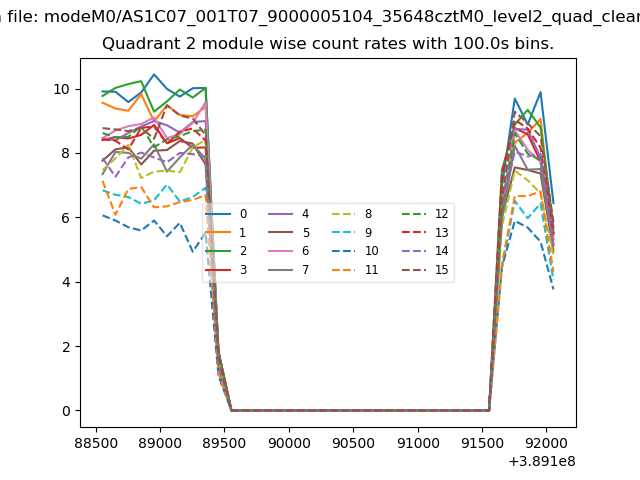
| Module-wise count rates for Quadrant D Data is divided into 100 sec bins |
 |
 |
| Parameter | Plot |
|---|---|
| CZT HV Monitor | 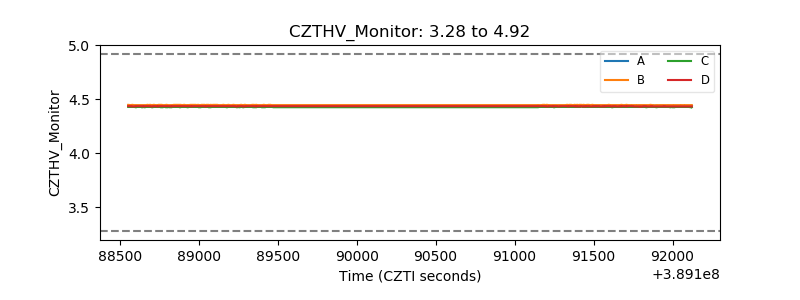 |
| D_VDD | 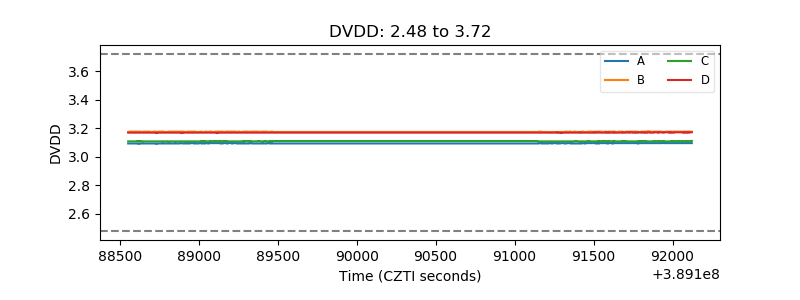 |
| Temperature 1 | 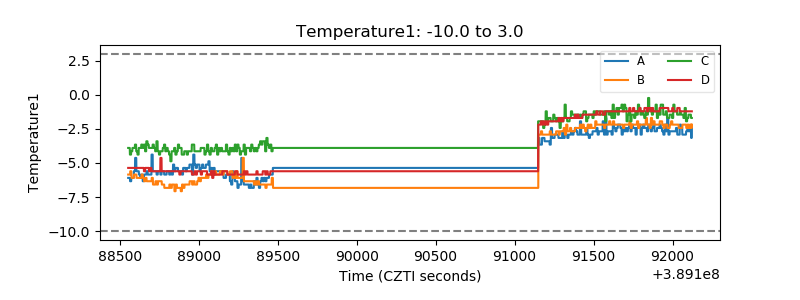 |
| Veto HV Monitor | 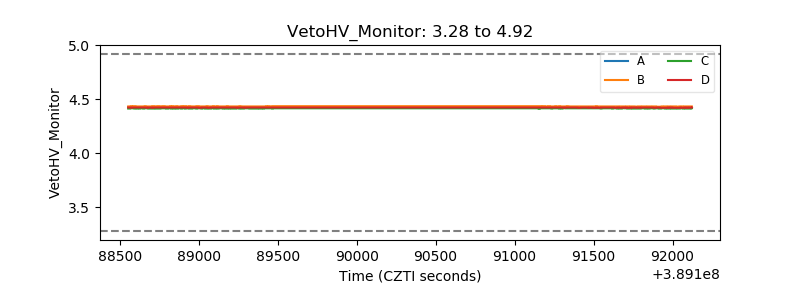 |
| Veto LLD | 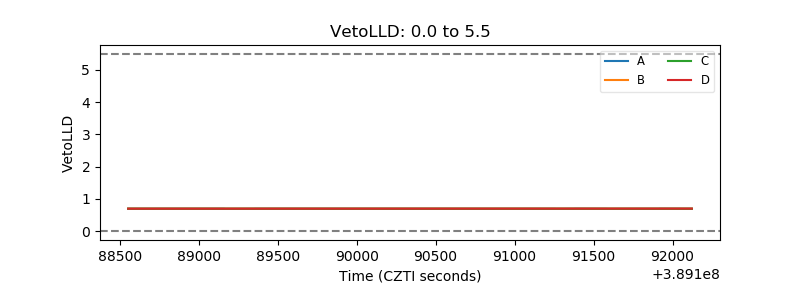 |
| Alpha Counter | 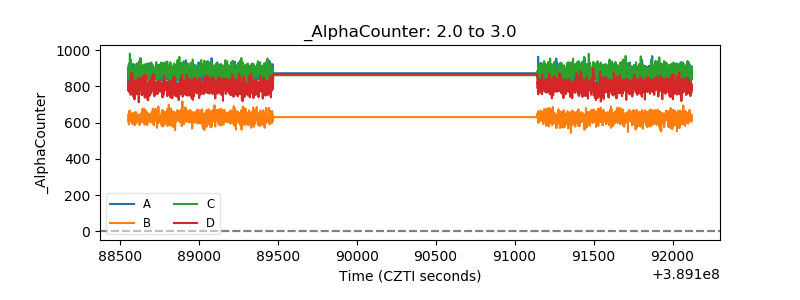 |
| _CPM_Rate | 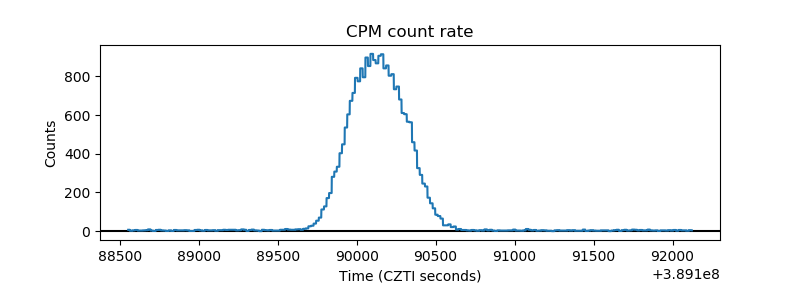 |
| CZT Counter | 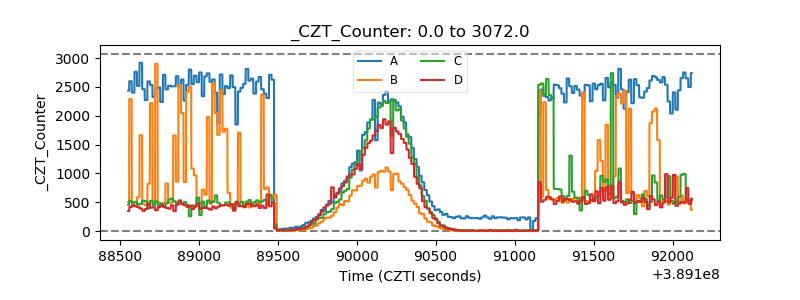 |
| +2.5 Volts monitor | 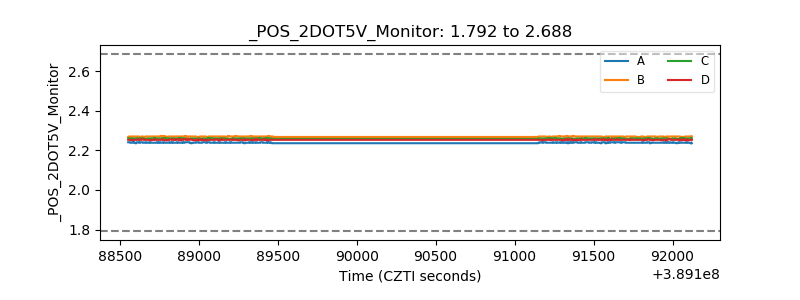 |
| +5 Volts monitor | 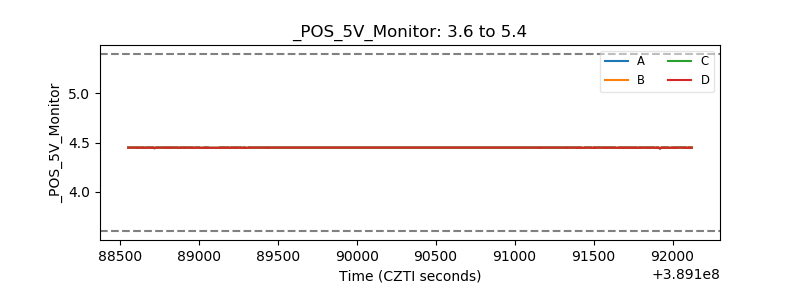 |
| _ROLL_ROT | 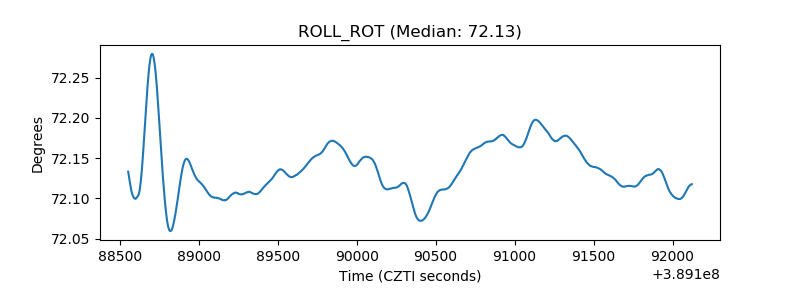 |
| _Roll_DEC | 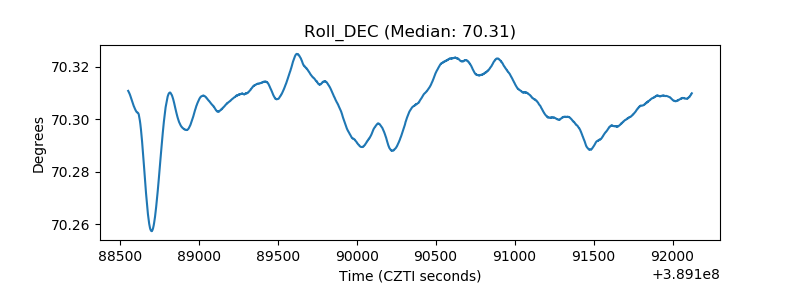 |
| _Roll_RA | 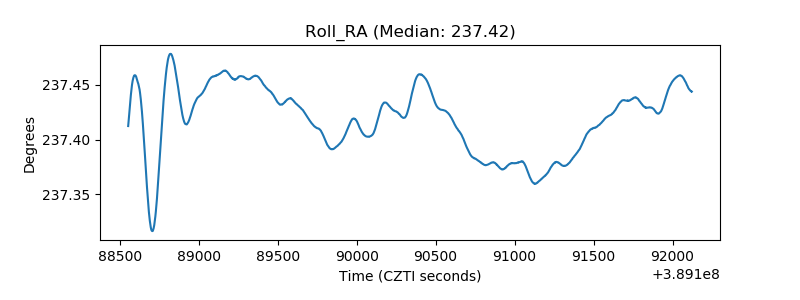 |
| Veto Counter | 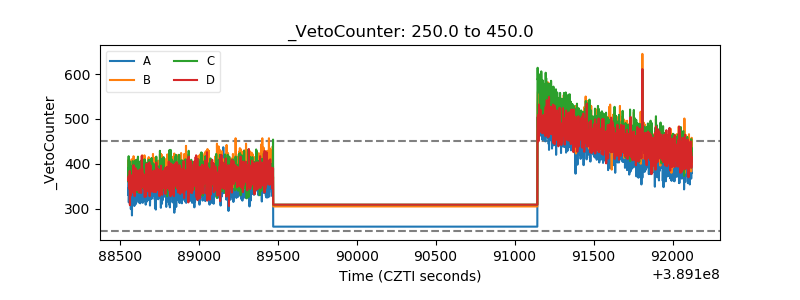 |