| Param | Original file | Final file |
|---|---|---|
| Filename | modeM0/AS1A11_106T01_9000005102_35642cztM0_level2.evt | modeM0/AS1A11_106T01_9000005102_35642cztM0_level2_quad_clean.evt |
| Size (bytes) | 758,292,480 | 61,274,880 |
| Size | 723.2 MB | 58.4 MB |
| Events in quadrant A | 13,542,000 | 229,198 |
| Events in quadrant B | 2,999,216 | 419,161 |
| Events in quadrant C | 3,442,037 | 410,314 |
| Events in quadrant D | 2,606,362 | 407,493 |
| Mode SS | |||
|---|---|---|---|
| Quadrant | BADHDUFLAG | Total packets | Discarded packets |
| A | 0 | 112 | 0 |
| B | 0 | 112 | 0 |
| C | 0 | 112 | 0 |
| D | 0 | 112 | 0 |
| Mode M0 | |||
|---|---|---|---|
| Quadrant | BADHDUFLAG | Total packets | Discarded packets |
| A | 0 | 43938 | 3 |
| B | 0 | 12494 | 2 |
| C | 0 | 13809 | 2 |
| D | 0 | 11607 | 2 |
| Mode M9 | |||
|---|---|---|---|
| Quadrant | BADHDUFLAG | Total packets | Discarded packets |
| A | 0 | 34 | 0 |
| B | 0 | 34 | 0 |
| C | 0 | 34 | 0 |
| D | 0 | 34 | 0 |
| Quadrant | Total seconds | Saturated seconds | Saturation percentage |
|---|---|---|---|
| A | 5537 | 5537 | 100.000000% |
| B | 5537 | 82 | 1.480946% |
| C | 5537 | 186 | 3.359220% |
| D | 5537 | 39 | 0.704353% |
Noise dominated data is calculated using 1-second bins in cleaned event files. If a bin has >2000 counts, and if more than 50% of those come from <1% of pixels, then it is considered to be noise-dominated and hence unusable.
| Quadrant | # 1 sec bins | Bins with >0 counts | Bins with >2000 counts | High rate bins dominated by noise | Noise dominated (total time) | Noise dominated (detector-on time) | Marked lightcurve |
|---|---|---|---|---|---|---|---|
| A | 7121 | 5538 | 5307 | 5307 | 74.53% | 95.83% | 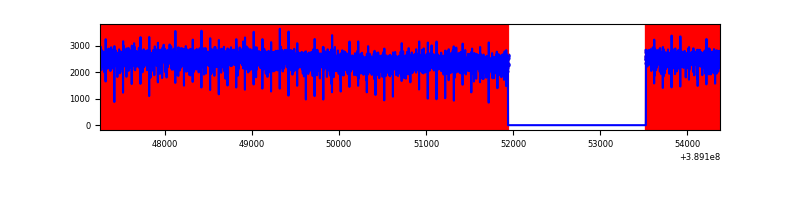 |
| B | 7121 | 5538 | 49 | 49 | 0.69% | 0.88% | 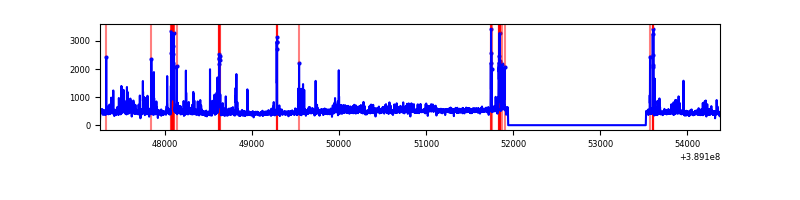 |
| C | 7121 | 5538 | 155 | 155 | 2.18% | 2.80% | 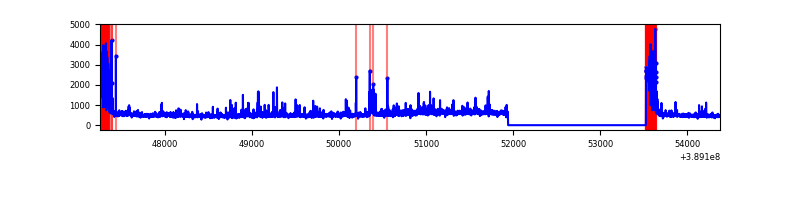 |
| D | 7121 | 5538 | 24 | 24 | 0.34% | 0.43% | 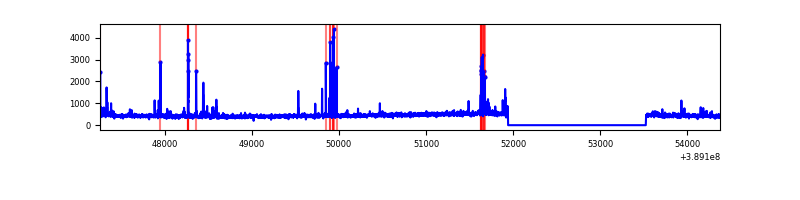 |
Top three noisy pixels from each quadrant. If the there are fewer than three noisy pixels in the level2.evt file, extra rows are filled as -1
| Pixel properties | Quadrant properties | ||||||
|---|---|---|---|---|---|---|---|
| Quadrant | DetID | PixID | Counts | Sigma | Mean | Median | Sigma |
| A | 15 | 169 | 11864753 | 144122.15 | 409 | 401 | 82.3 |
| A | 10 | 83 | 90505 | 1094.54 | 409 | 401 | 82.3 |
| A | 13 | 254 | 5271 | 59.16 | 409 | 401 | 82.3 |
| B | 5 | 172 | 384901 | 3107.96 | 630 | 611 | 123.6 |
| B | 0 | 197 | 100962 | 811.59 | 630 | 611 | 123.6 |
| B | 0 | 189 | 29740 | 235.58 | 630 | 611 | 123.6 |
| C | 0 | 10 | 722683 | 5037.41 | 616 | 620 | 143.3 |
| C | 15 | 214 | 230637 | 1604.69 | 616 | 620 | 143.3 |
| C | 10 | 49 | 43793 | 301.19 | 616 | 620 | 143.3 |
| D | 2 | 153 | 129114 | 852.8 | 622 | 607 | 150.7 |
| D | 2 | 249 | 38888 | 254.04 | 622 | 607 | 150.7 |
| D | 8 | 195 | 27312 | 177.22 | 622 | 607 | 150.7 |
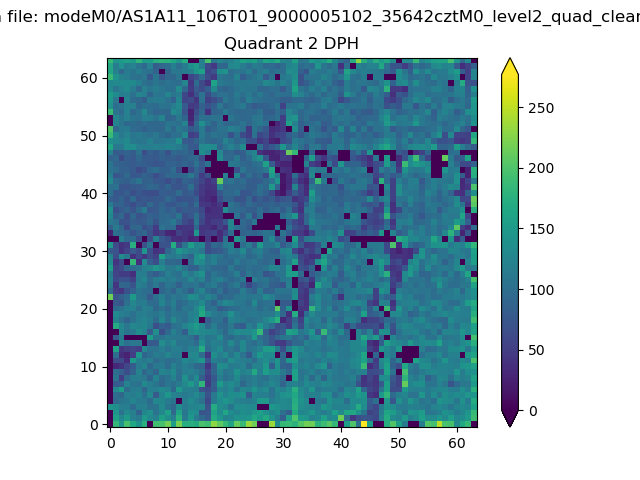
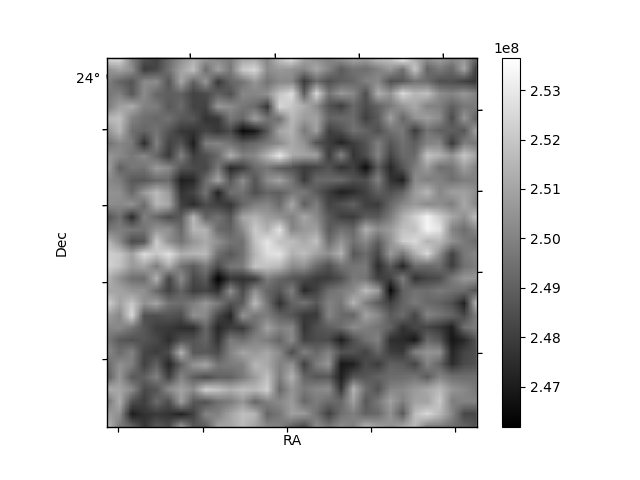
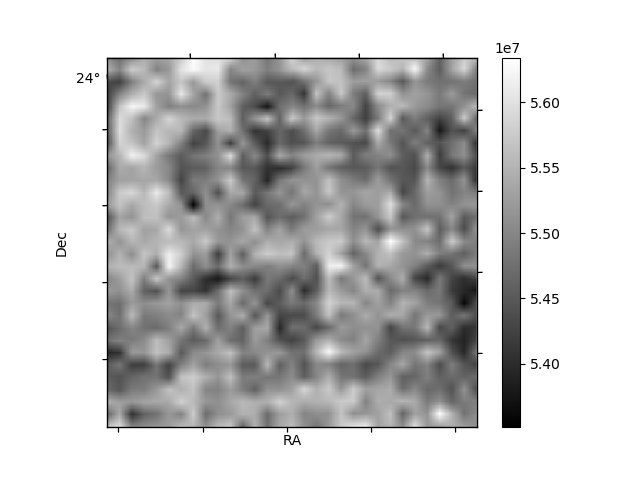
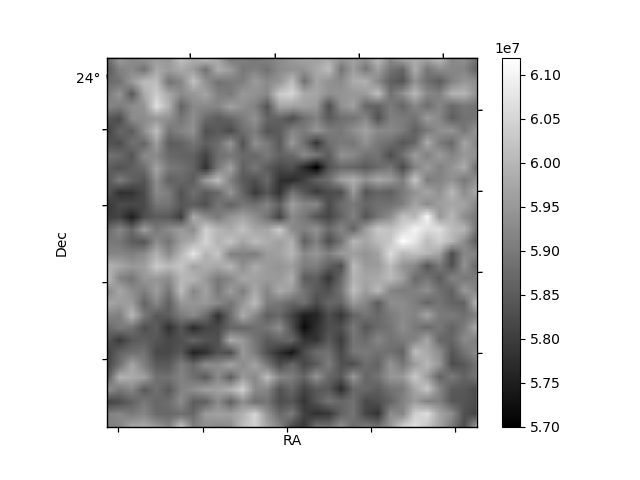
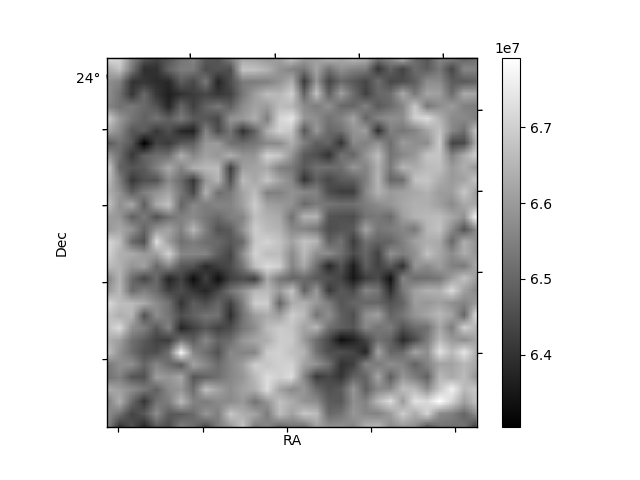
Histogram calculated using DETX and DETY for each event in the final _common_clean file
| Quadrant A | 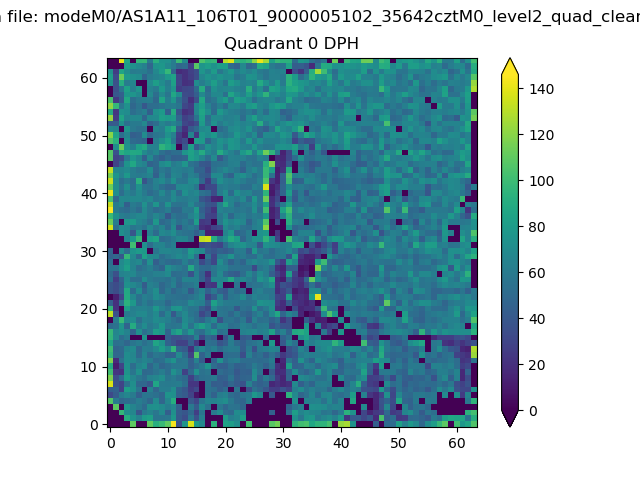 |
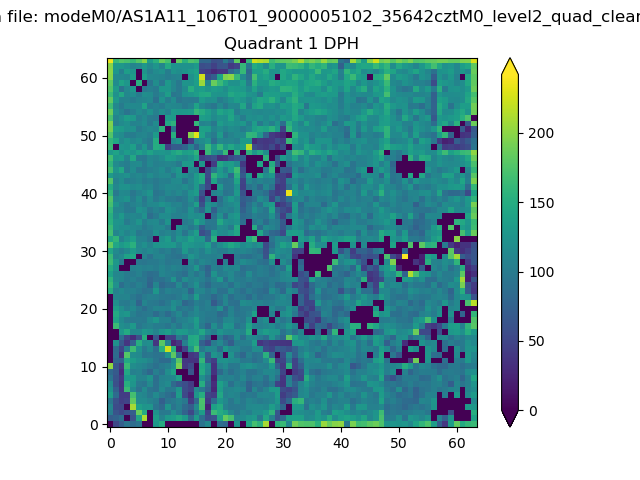 |
Quadrant B |
|---|---|---|---|
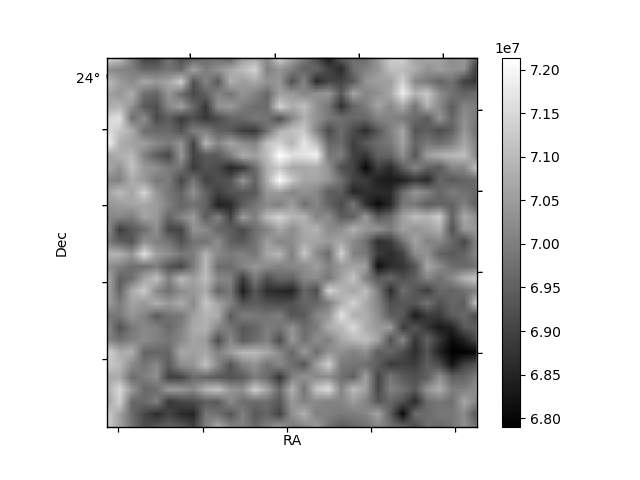
| Quadrant D | 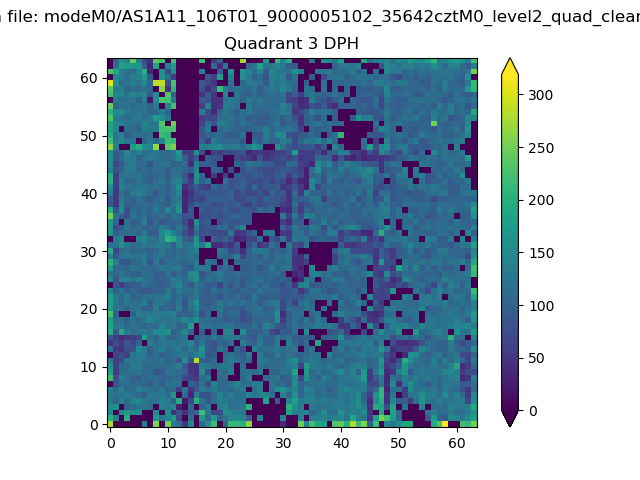 |
 |
Quadrant C |
| Plot type | Count rate plots | Images |
|---|---|---|
| Comparison with Poisson distribution Blue bars denote a histogram of data divided into 1 sec bins. Red curve is a Poisson curve with rate = median count rate of data. |
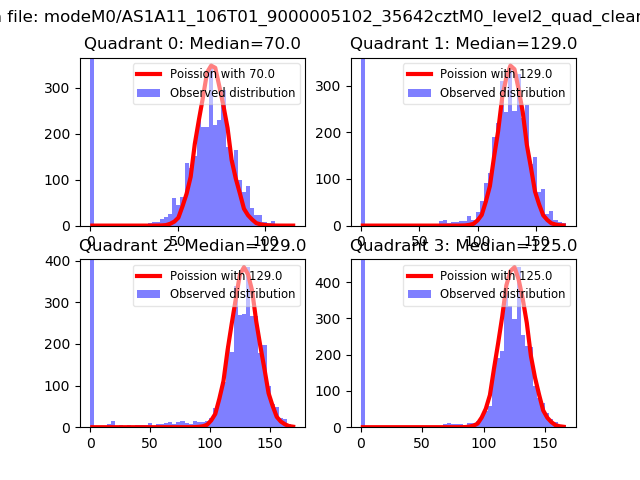 |
 |
| Quadrant-wise count rates Data is divided into 100 sec bins |
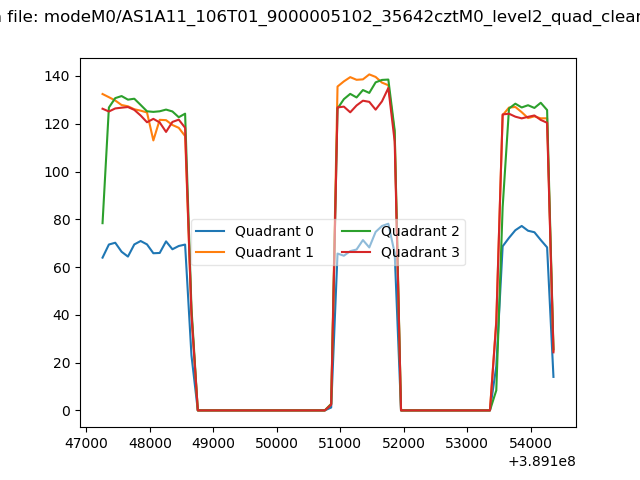 |
|
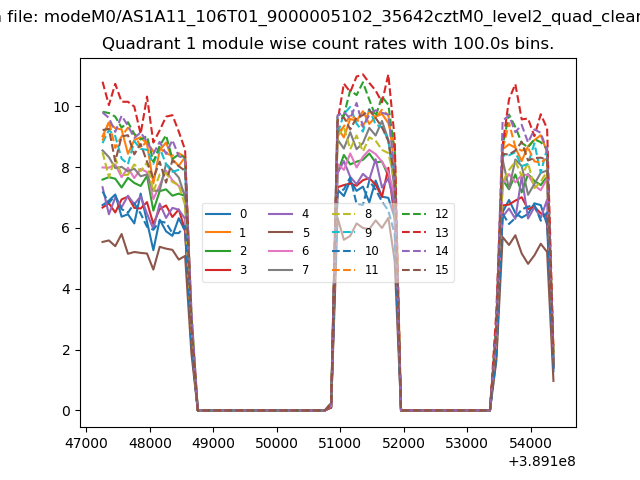
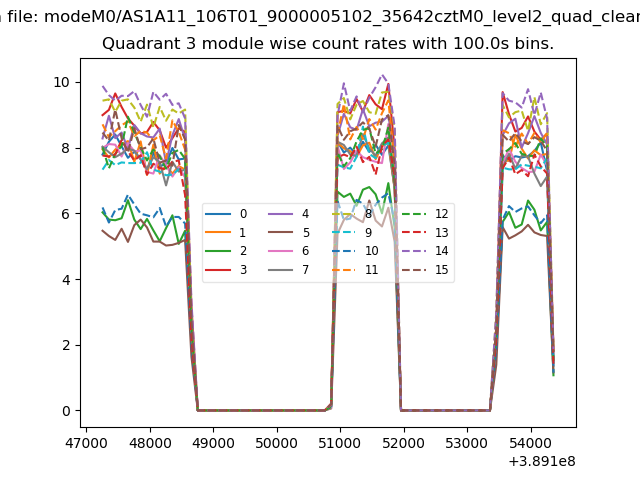
| Module-wise count rates for Quadrant A Data is divided into 100 sec bins |
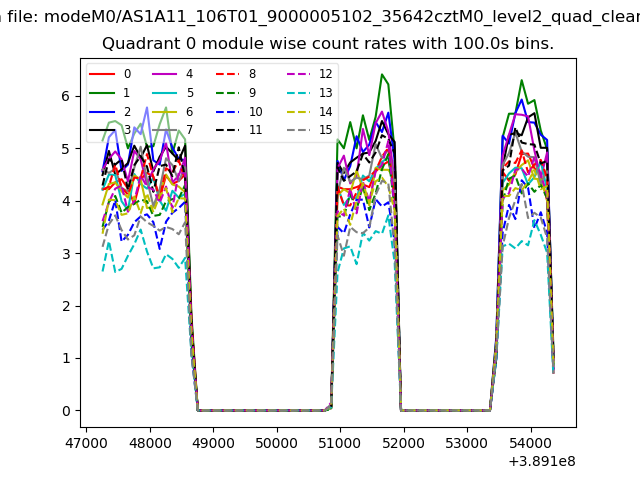 |
 |
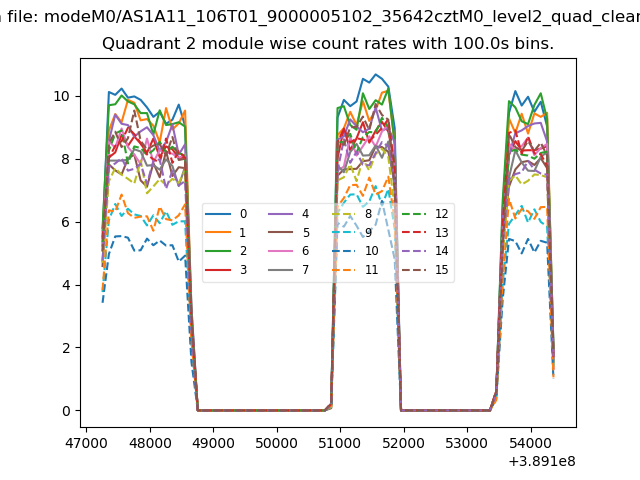
| Module-wise count rates for Quadrant B Data is divided into 100 sec bins |
 |
 |
| Module-wise count rates for Quadrant C Data is divided into 100 sec bins |
 |
 |
| Module-wise count rates for Quadrant D Data is divided into 100 sec bins |
 |
 |
| Parameter | Plot |
|---|---|
| CZT HV Monitor | 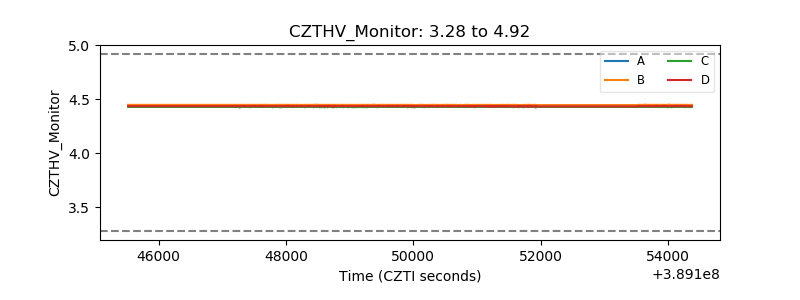 |
| D_VDD | 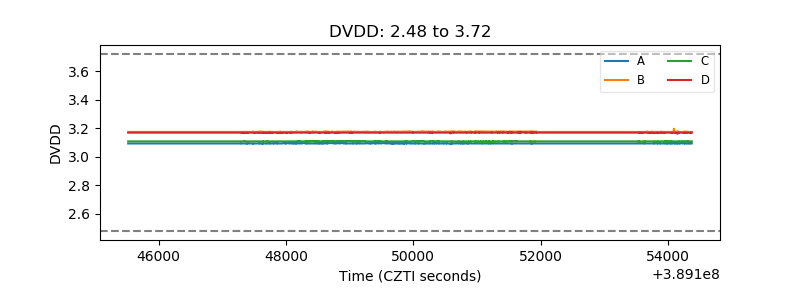 |
| Temperature 1 | 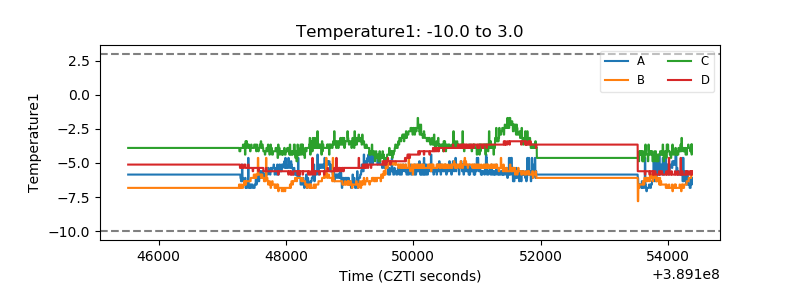 |
| Veto HV Monitor |  |
| Veto LLD | 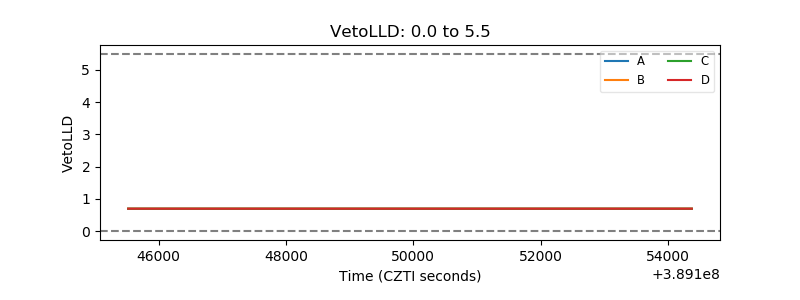 |
| Alpha Counter | 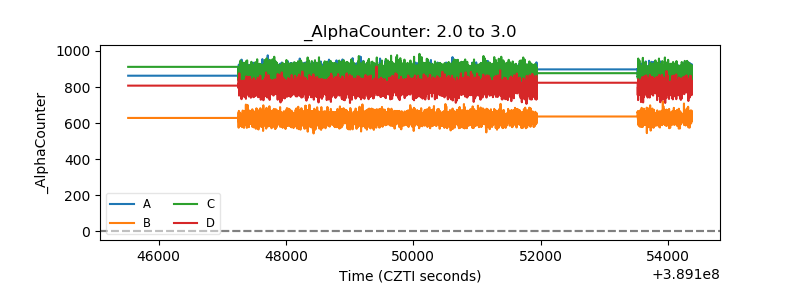 |
| _CPM_Rate | 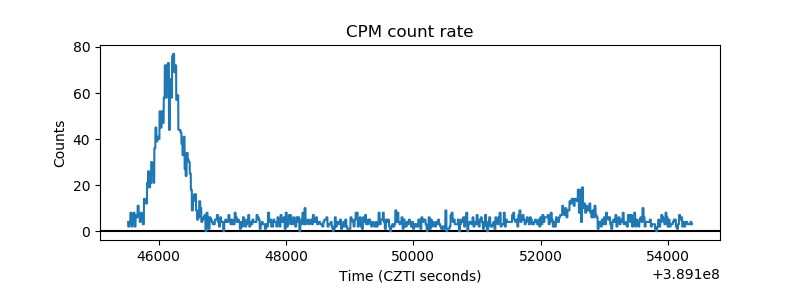 |
| CZT Counter | 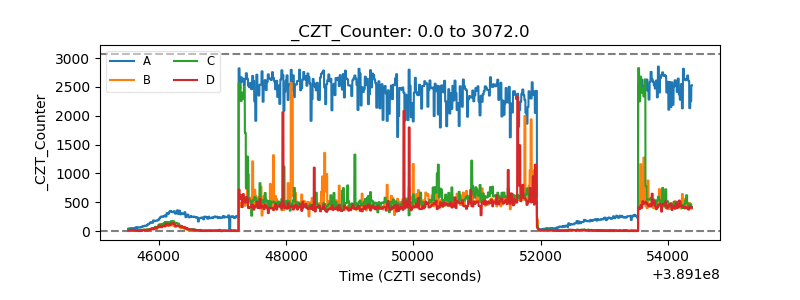 |
| +2.5 Volts monitor | 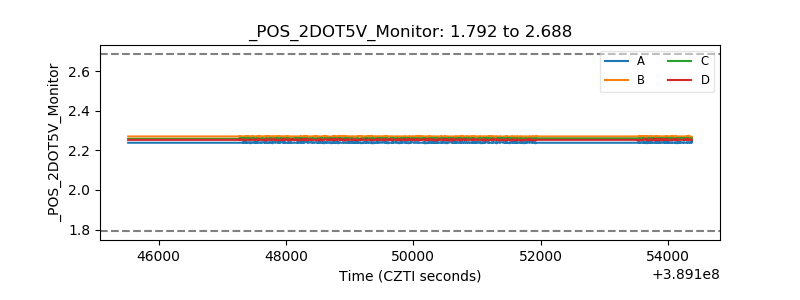 |
| +5 Volts monitor | 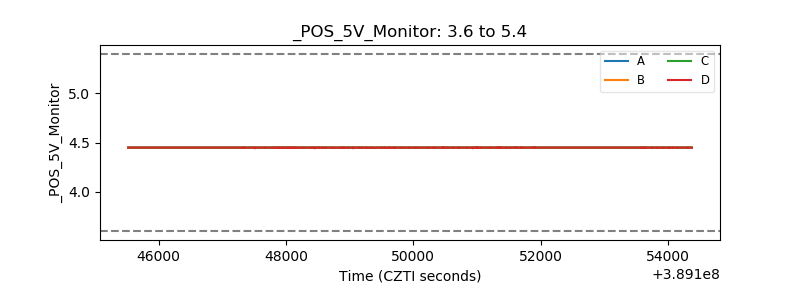 |
| _ROLL_ROT | 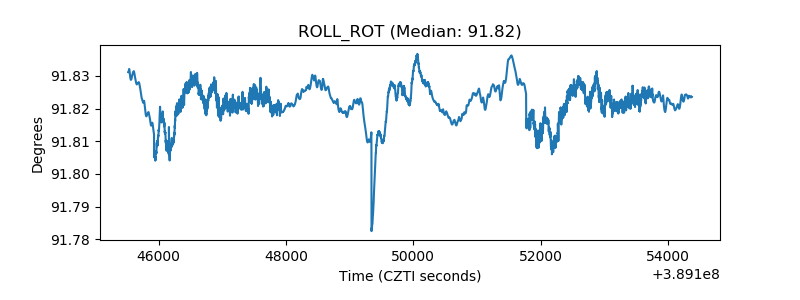 |
| _Roll_DEC | 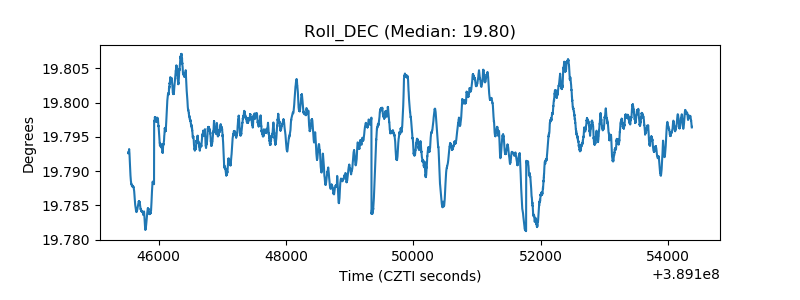 |
| _Roll_RA | 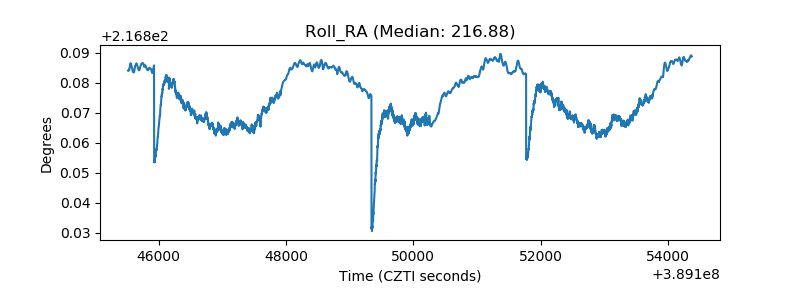 |
| Veto Counter | 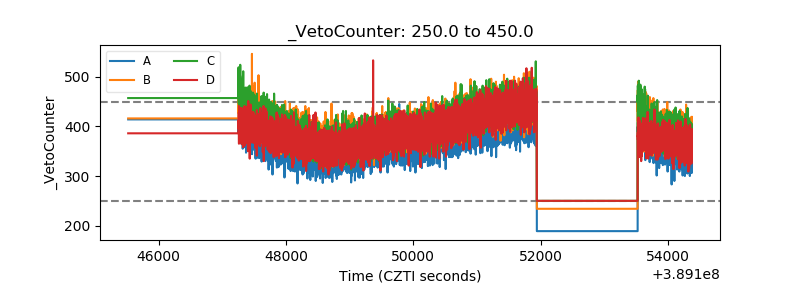 |