| Param | Original file | Final file |
|---|---|---|
| Filename | modeM0/AS1A11_106T01_9000005102_35641cztM0_level2.evt | modeM0/AS1A11_106T01_9000005102_35641cztM0_level2_quad_clean.evt |
| Size (bytes) | 732,438,720 | 54,299,520 |
| Size | 698.5 MB | 51.8 MB |
| Events in quadrant A | 12,601,912 | 203,065 |
| Events in quadrant B | 3,526,437 | 357,596 |
| Events in quadrant C | 3,187,587 | 363,291 |
| Events in quadrant D | 2,519,896 | 360,384 |
| Mode SS | |||
|---|---|---|---|
| Quadrant | BADHDUFLAG | Total packets | Discarded packets |
| A | 0 | 104 | 0 |
| B | 0 | 104 | 0 |
| C | 0 | 104 | 0 |
| D | 0 | 104 | 0 |
| Mode M0 | |||
|---|---|---|---|
| Quadrant | BADHDUFLAG | Total packets | Discarded packets |
| A | 0 | 40863 | 3 |
| B | 0 | 13761 | 2 |
| C | 0 | 12596 | 2 |
| D | 0 | 10971 | 2 |
| Mode M9 | |||
|---|---|---|---|
| Quadrant | BADHDUFLAG | Total packets | Discarded packets |
| A | 0 | 34 | 0 |
| B | 0 | 34 | 0 |
| C | 0 | 34 | 0 |
| D | 0 | 35 | 0 |
| Quadrant | Total seconds | Saturated seconds | Saturation percentage |
|---|---|---|---|
| A | 5109 | 5109 | 100.000000% |
| B | 5109 | 301 | 5.891564% |
| C | 5109 | 203 | 3.973380% |
| D | 5109 | 21 | 0.411039% |
Noise dominated data is calculated using 1-second bins in cleaned event files. If a bin has >2000 counts, and if more than 50% of those come from <1% of pixels, then it is considered to be noise-dominated and hence unusable.
| Quadrant | # 1 sec bins | Bins with >0 counts | Bins with >2000 counts | High rate bins dominated by noise | Noise dominated (total time) | Noise dominated (detector-on time) | Marked lightcurve |
|---|---|---|---|---|---|---|---|
| A | 7022 | 5110 | 4910 | 4910 | 69.92% | 96.09% | 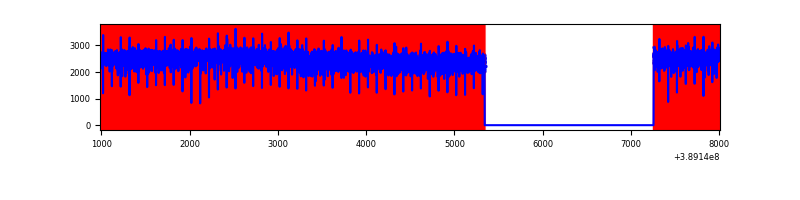 |
| B | 7022 | 5110 | 231 | 231 | 3.29% | 4.52% | 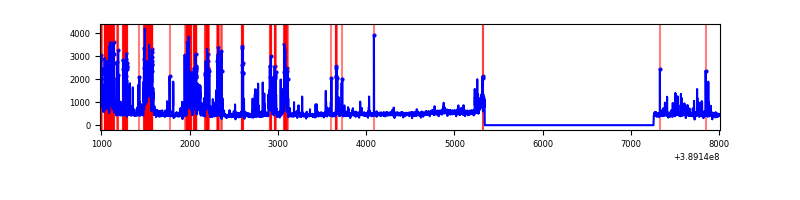 |
| C | 7022 | 5110 | 155 | 155 | 2.21% | 3.03% | 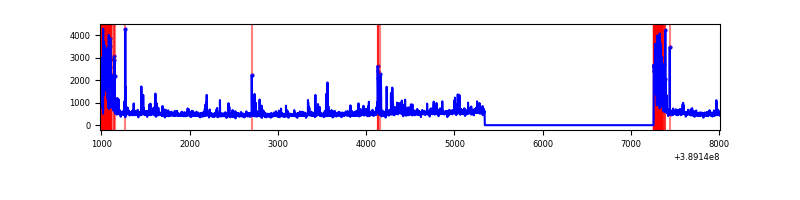 |
| D | 7022 | 5110 | 24 | 24 | 0.34% | 0.47% | 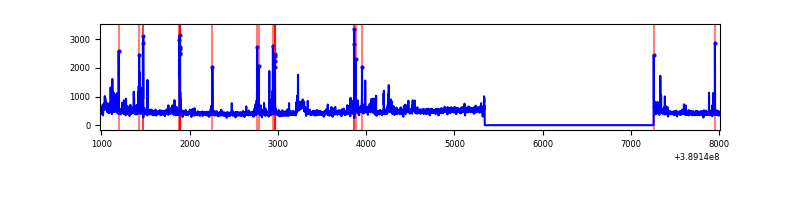 |
Top three noisy pixels from each quadrant. If the there are fewer than three noisy pixels in the level2.evt file, extra rows are filled as -1
| Pixel properties | Quadrant properties | ||||||
|---|---|---|---|---|---|---|---|
| Quadrant | DetID | PixID | Counts | Sigma | Mean | Median | Sigma |
| A | 15 | 169 | 11045682 | 143546.61 | 379 | 371 | 76.9 |
| A | 10 | 83 | 86763 | 1122.76 | 379 | 371 | 76.9 |
| A | 13 | 254 | 4325 | 51.39 | 379 | 371 | 76.9 |
| B | 5 | 172 | 1186624 | 10458.65 | 578 | 562 | 113.4 |
| B | 0 | 189 | 37247 | 323.49 | 578 | 562 | 113.4 |
| B | 0 | 197 | 24279 | 209.14 | 578 | 562 | 113.4 |
| C | 0 | 10 | 667134 | 5025.45 | 568 | 572 | 132.6 |
| C | 15 | 214 | 210223 | 1580.63 | 568 | 572 | 132.6 |
| C | 9 | 187 | 45087 | 335.61 | 568 | 572 | 132.6 |
| D | 12 | 217 | 106693 | 757.63 | 576 | 561 | 140.1 |
| D | 2 | 153 | 81344 | 576.67 | 576 | 561 | 140.1 |
| D | 13 | 249 | 55971 | 395.55 | 576 | 561 | 140.1 |
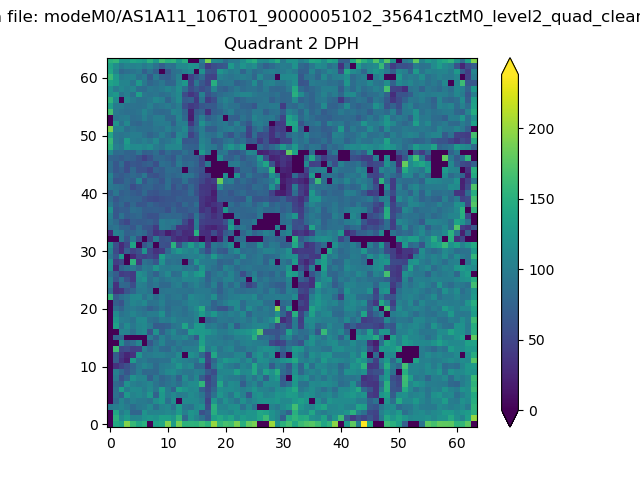
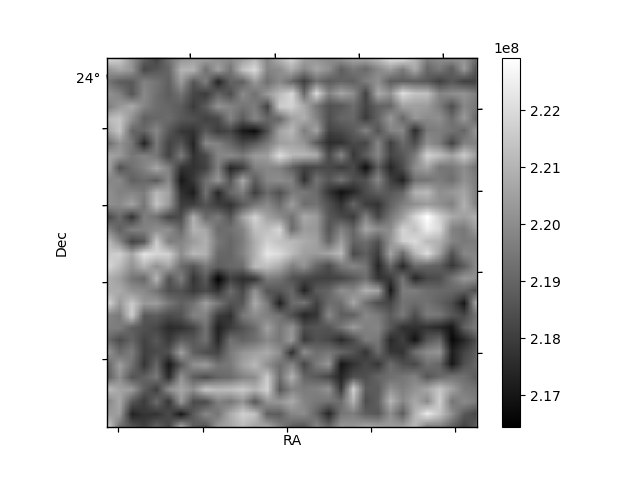
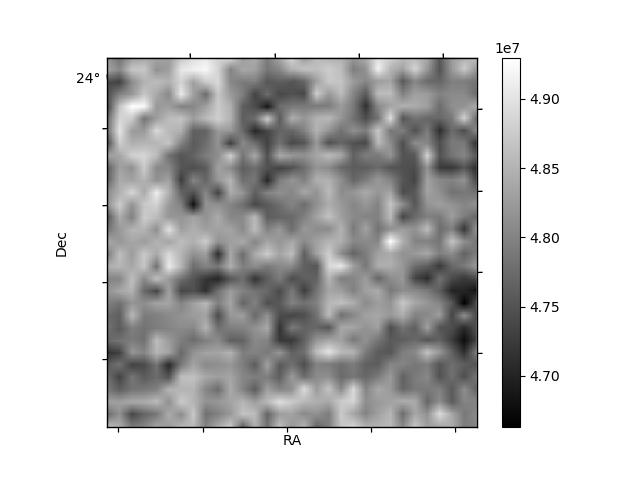
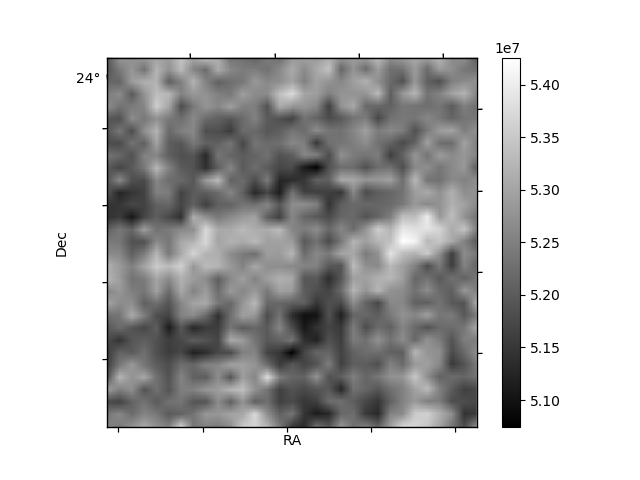
Histogram calculated using DETX and DETY for each event in the final _common_clean file
| Quadrant A | 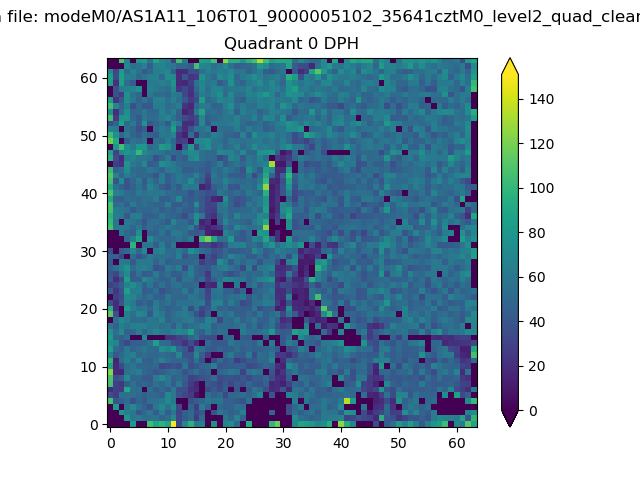 |
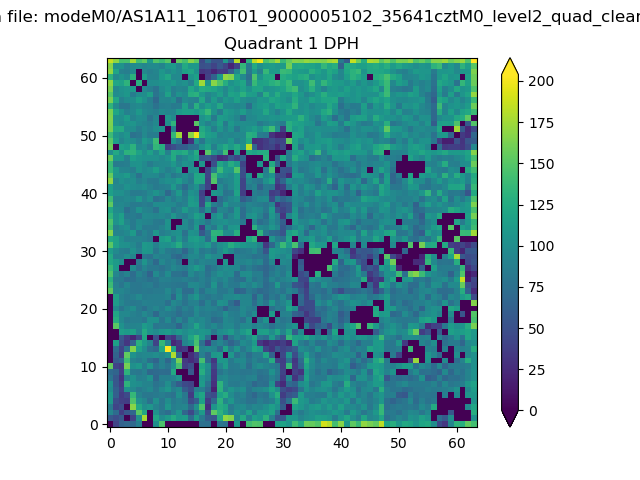 |
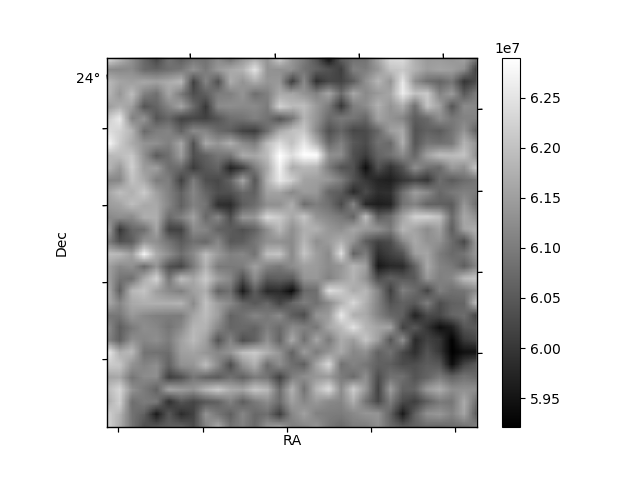
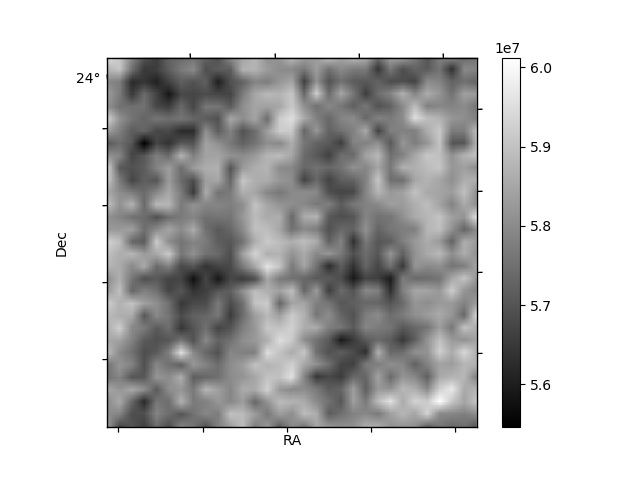
Quadrant B |
|---|---|---|---|
| Quadrant D | 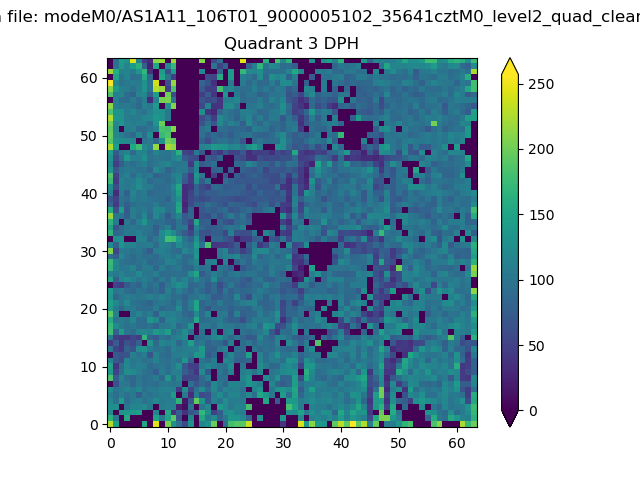 |
 |
Quadrant C |
| Plot type | Count rate plots | Images |
|---|---|---|
| Comparison with Poisson distribution Blue bars denote a histogram of data divided into 1 sec bins. Red curve is a Poisson curve with rate = median count rate of data. |
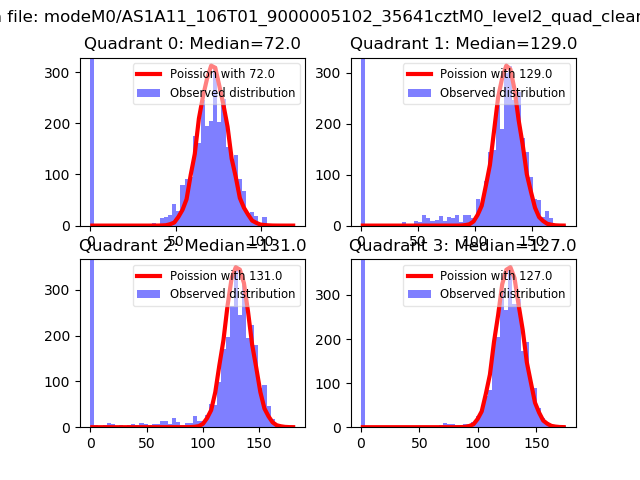 |
 |
| Quadrant-wise count rates Data is divided into 100 sec bins |
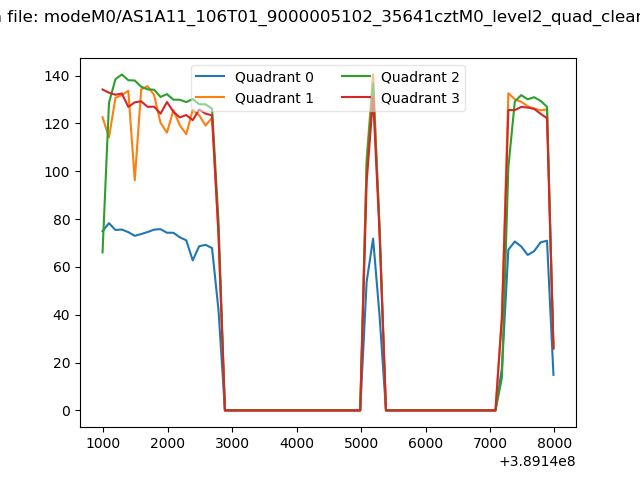 |
|
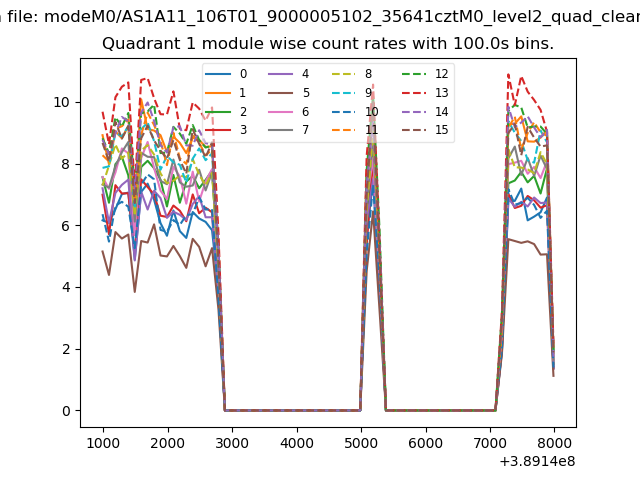
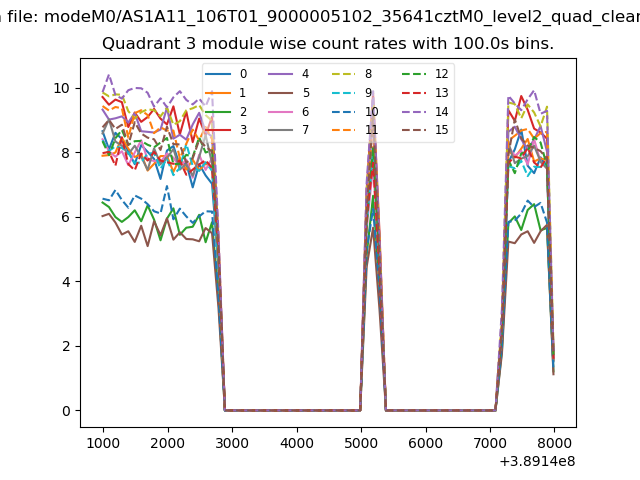
| Module-wise count rates for Quadrant A Data is divided into 100 sec bins |
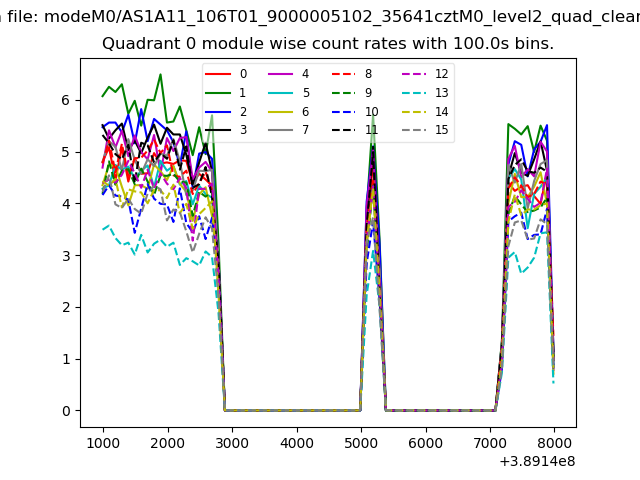 |
 |
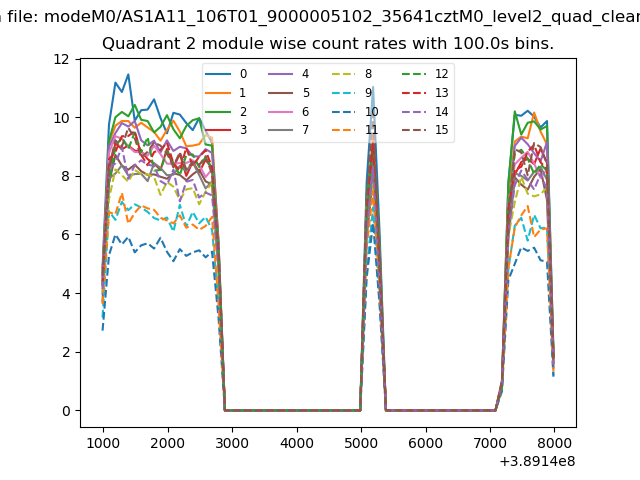
| Module-wise count rates for Quadrant B Data is divided into 100 sec bins |
 |
 |
| Module-wise count rates for Quadrant C Data is divided into 100 sec bins |
 |
 |
| Module-wise count rates for Quadrant D Data is divided into 100 sec bins |
 |
 |
| Parameter | Plot |
|---|---|
| CZT HV Monitor | 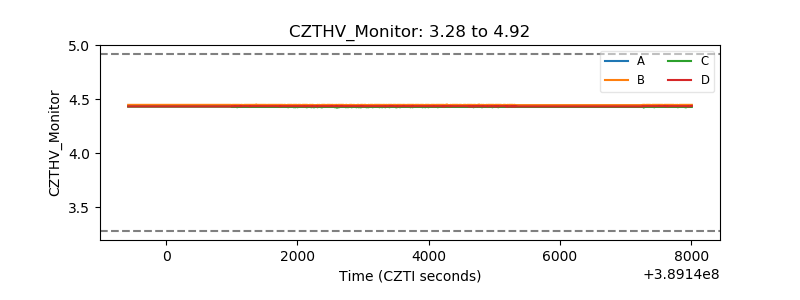 |
| D_VDD | 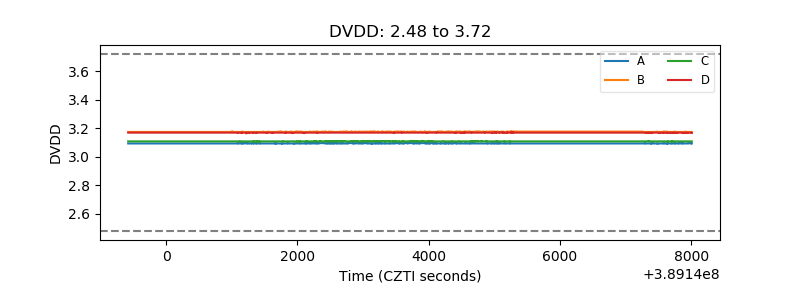 |
| Temperature 1 | 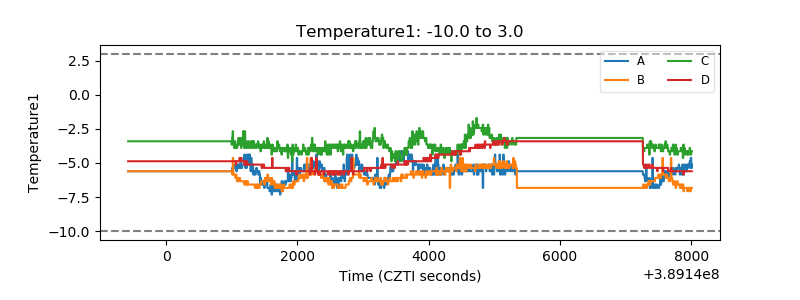 |
| Veto HV Monitor | 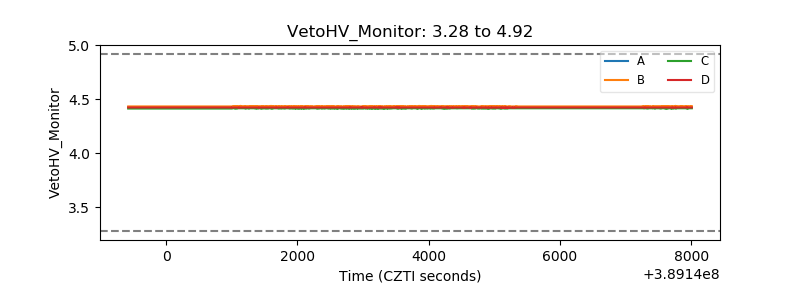 |
| Veto LLD | 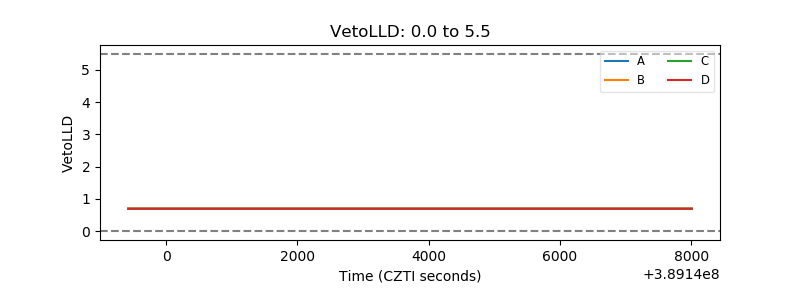 |
| Alpha Counter | 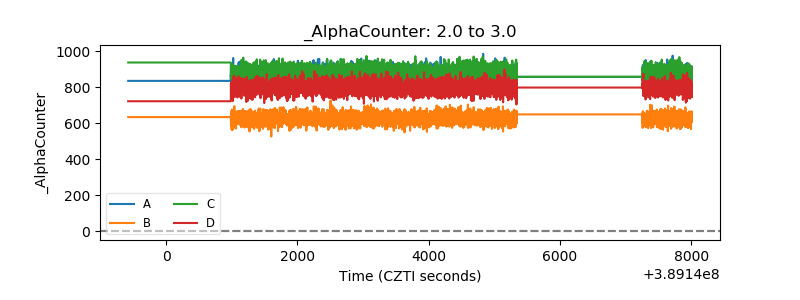 |
| _CPM_Rate | 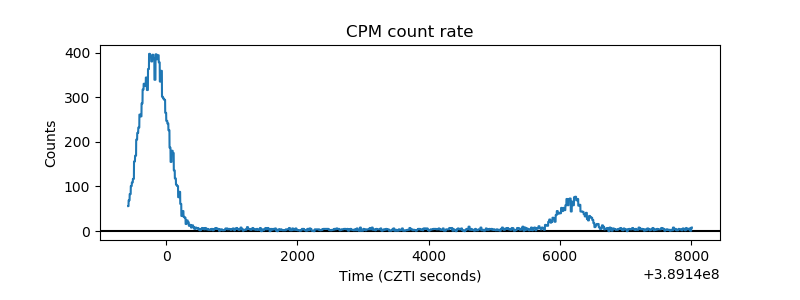 |
| CZT Counter | 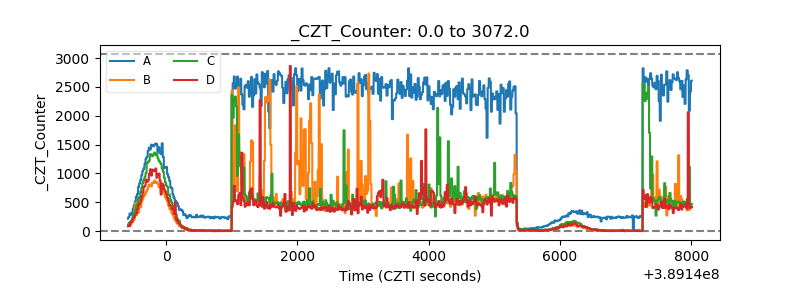 |
| +2.5 Volts monitor | 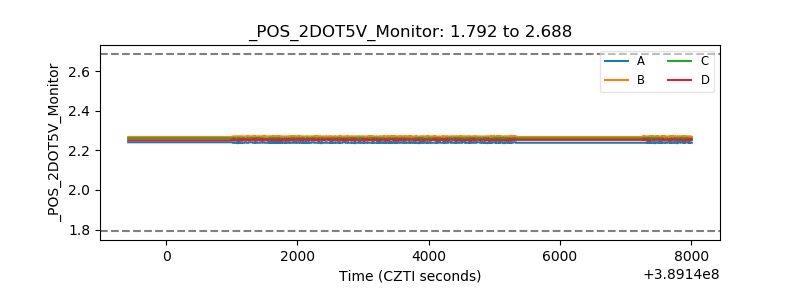 |
| +5 Volts monitor | 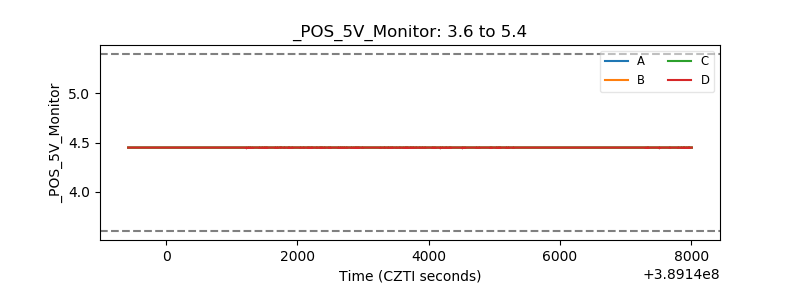 |
| _ROLL_ROT | 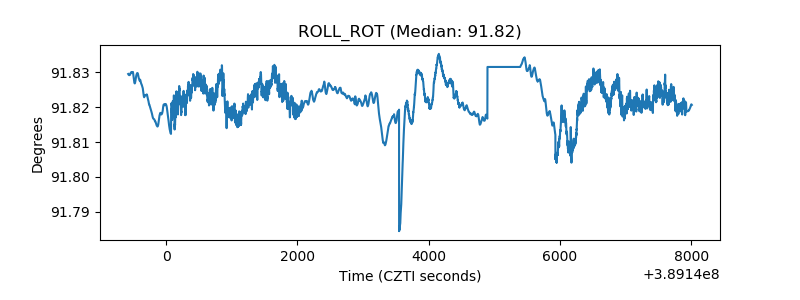 |
| _Roll_DEC | 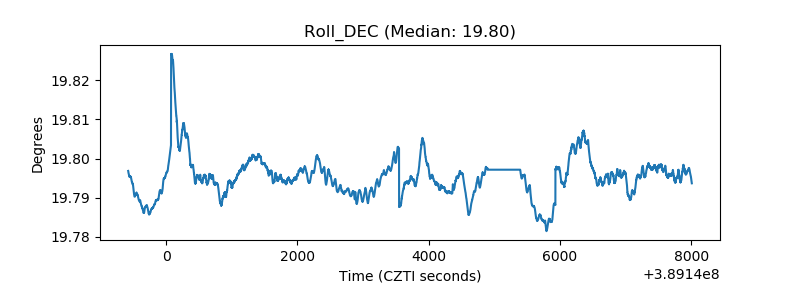 |
| _Roll_RA | 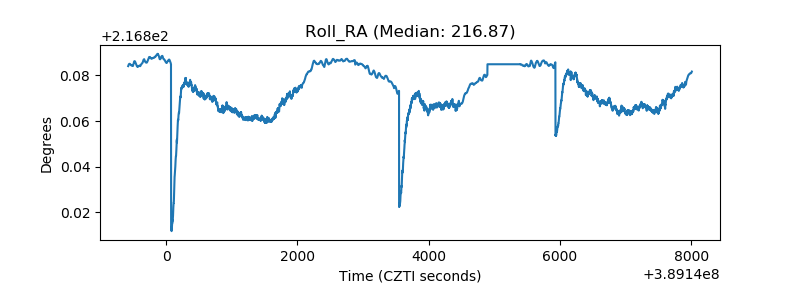 |
| Veto Counter | 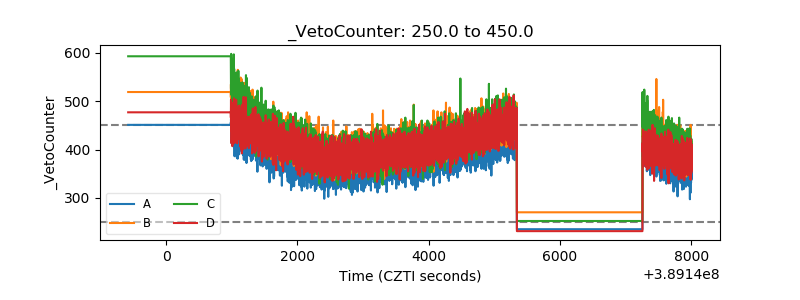 |