| Param | Original file | Final file |
|---|---|---|
| Filename | modeM0/AS1A11_106T01_9000005102_35640cztM0_level2.evt | modeM0/AS1A11_106T01_9000005102_35640cztM0_level2_quad_clean.evt |
| Size (bytes) | 1,334,407,680 | 118,837,440 |
| Size | 1.2 GB | 113.3 MB |
| Events in quadrant A | 21,578,210 | 527,619 |
| Events in quadrant B | 6,531,247 | 816,925 |
| Events in quadrant C | 6,792,376 | 817,362 |
| Events in quadrant D | 4,896,193 | 801,402 |
| Mode SS | |||
|---|---|---|---|
| Quadrant | BADHDUFLAG | Total packets | Discarded packets |
| A | 0 | 186 | 0 |
| B | 0 | 186 | 0 |
| C | 0 | 186 | 0 |
| D | 0 | 186 | 0 |
| Mode M0 | |||
|---|---|---|---|
| Quadrant | BADHDUFLAG | Total packets | Discarded packets |
| A | 0 | 70164 | 4 |
| B | 0 | 25239 | 3 |
| C | 0 | 25888 | 3 |
| D | 0 | 20461 | 3 |
| Mode M9 | |||
|---|---|---|---|
| Quadrant | BADHDUFLAG | Total packets | Discarded packets |
| A | 0 | 46 | 0 |
| B | 0 | 46 | 0 |
| C | 0 | 46 | 0 |
| D | 0 | 47 | 0 |
| Quadrant | Total seconds | Saturated seconds | Saturation percentage |
|---|---|---|---|
| A | 9124 | 8691 | 95.254274% |
| B | 9124 | 458 | 5.019728% |
| C | 9124 | 542 | 5.940377% |
| D | 9124 | 84 | 0.920649% |
Noise dominated data is calculated using 1-second bins in cleaned event files. If a bin has >2000 counts, and if more than 50% of those come from <1% of pixels, then it is considered to be noise-dominated and hence unusable.
| Quadrant | # 1 sec bins | Bins with >0 counts | Bins with >2000 counts | High rate bins dominated by noise | Noise dominated (total time) | Noise dominated (detector-on time) | Marked lightcurve |
|---|---|---|---|---|---|---|---|
| A | 13341 | 9126 | 8359 | 8359 | 62.66% | 91.60% | 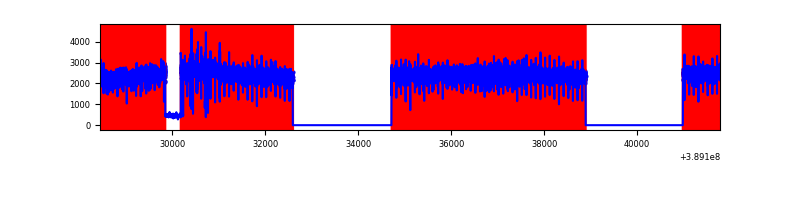 |
| B | 13341 | 9126 | 334 | 334 | 2.50% | 3.66% | 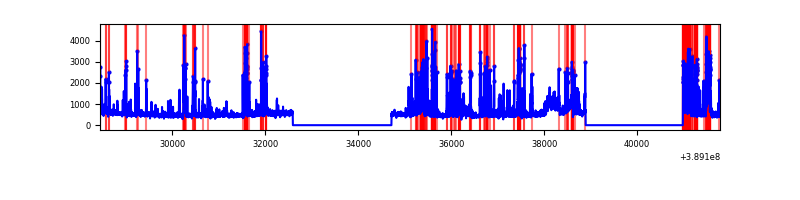 |
| C | 13341 | 9126 | 466 | 466 | 3.49% | 5.11% | 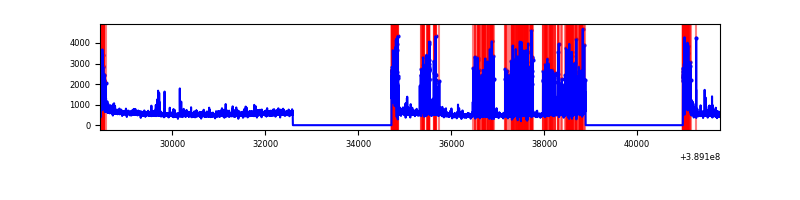 |
| D | 13341 | 9126 | 81 | 81 | 0.61% | 0.89% | 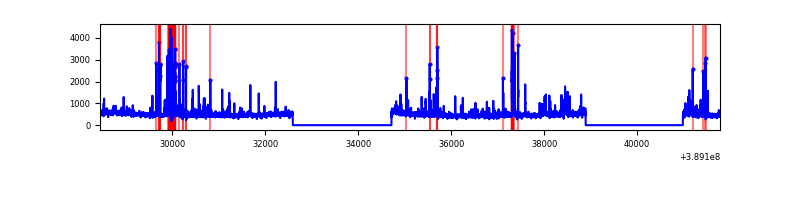 |
Top three noisy pixels from each quadrant. If the there are fewer than three noisy pixels in the level2.evt file, extra rows are filled as -1
| Pixel properties | Quadrant properties | ||||||
|---|---|---|---|---|---|---|---|
| Quadrant | DetID | PixID | Counts | Sigma | Mean | Median | Sigma |
| A | 15 | 169 | 18445508 | 120813.6 | 763 | 750 | 152.7 |
| A | 10 | 83 | 152908 | 996.64 | 763 | 750 | 152.7 |
| A | 12 | 189 | 23301 | 147.71 | 763 | 750 | 152.7 |
| B | 5 | 172 | 2178902 | 10710.53 | 1078 | 1049 | 203.3 |
| B | 0 | 197 | 71900 | 348.44 | 1078 | 1049 | 203.3 |
| B | 0 | 189 | 34507 | 164.54 | 1078 | 1049 | 203.3 |
| C | 0 | 10 | 2201601 | 9010.73 | 1065 | 1076 | 244.2 |
| C | 15 | 214 | 372533 | 1521.05 | 1065 | 1076 | 244.2 |
| C | 7 | 220 | 57131 | 229.53 | 1065 | 1076 | 244.2 |
| D | 13 | 249 | 190825 | 733.72 | 1078 | 1056 | 258.6 |
| D | 12 | 217 | 189263 | 727.68 | 1078 | 1056 | 258.6 |
| D | 7 | 80 | 177081 | 680.58 | 1078 | 1056 | 258.6 |
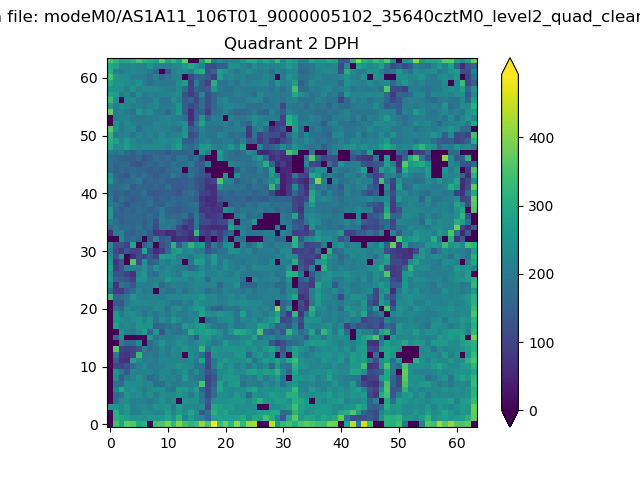
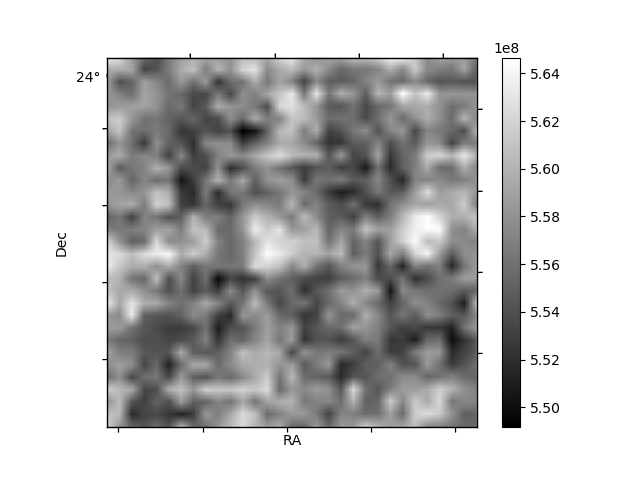
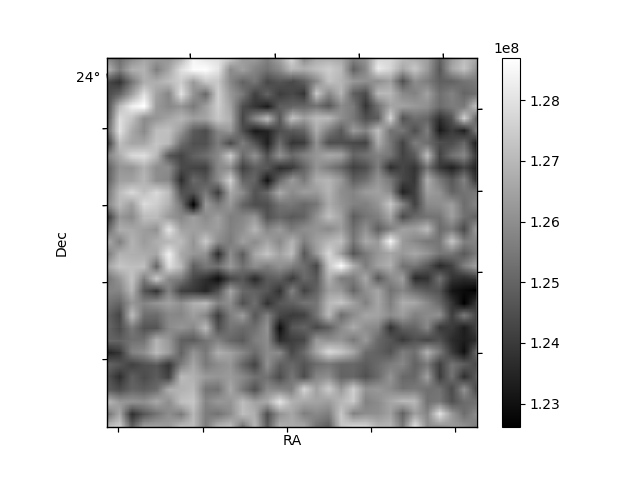
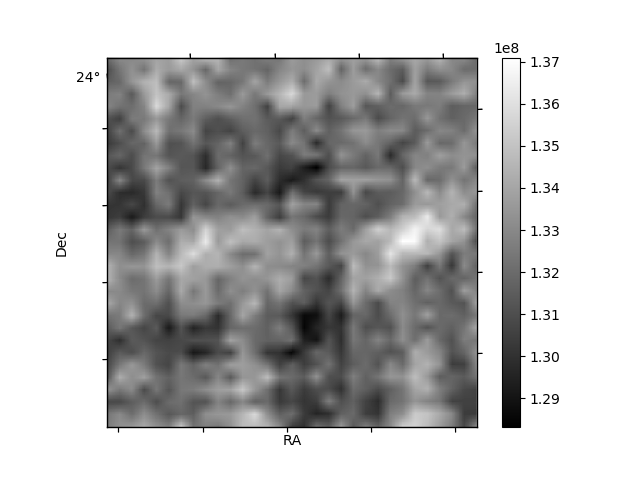
Histogram calculated using DETX and DETY for each event in the final _common_clean file
| Quadrant A | 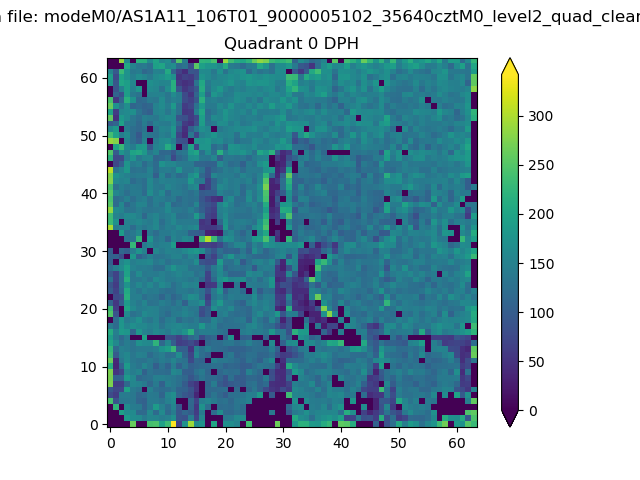 |
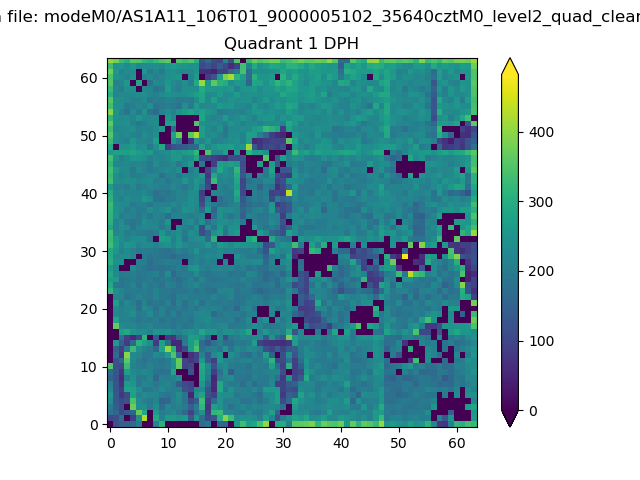 |
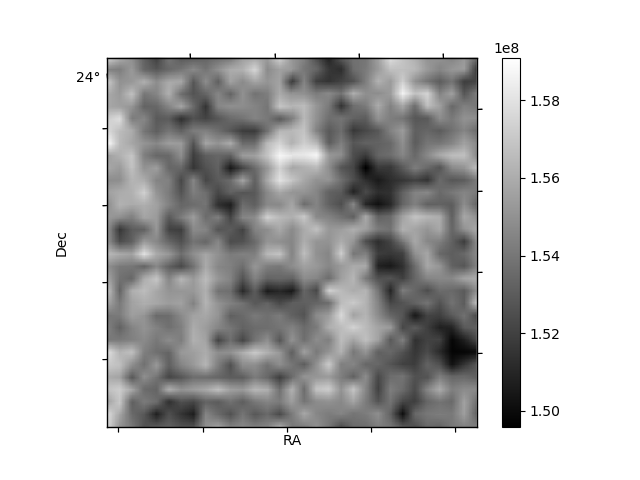
Quadrant B |
|---|---|---|---|
| Quadrant D | 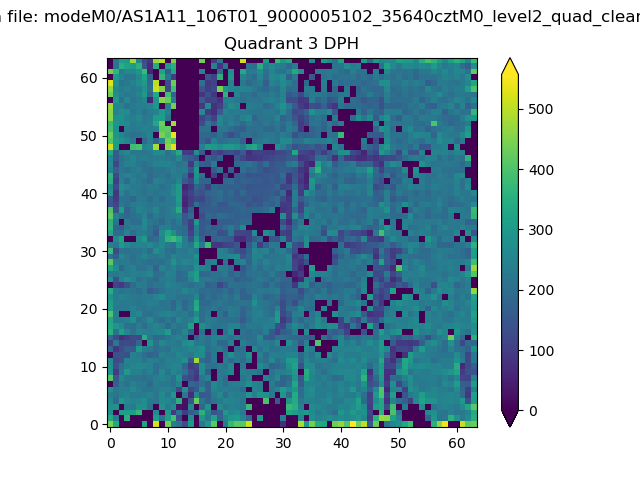 |
 |
Quadrant C |
| Plot type | Count rate plots | Images |
|---|---|---|
| Comparison with Poisson distribution Blue bars denote a histogram of data divided into 1 sec bins. Red curve is a Poisson curve with rate = median count rate of data. |
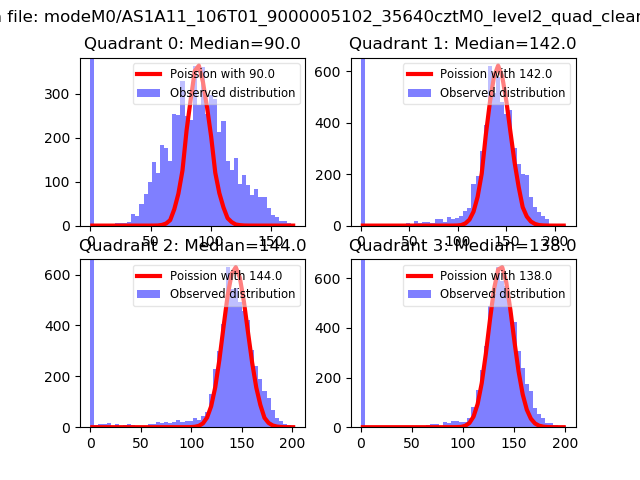 |
 |
| Quadrant-wise count rates Data is divided into 100 sec bins |
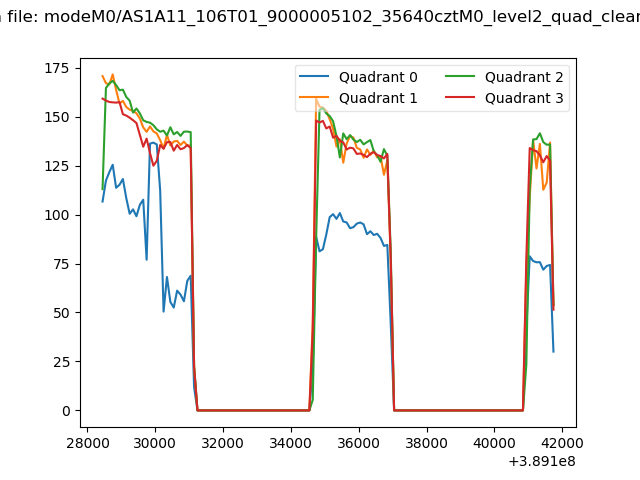 |
|
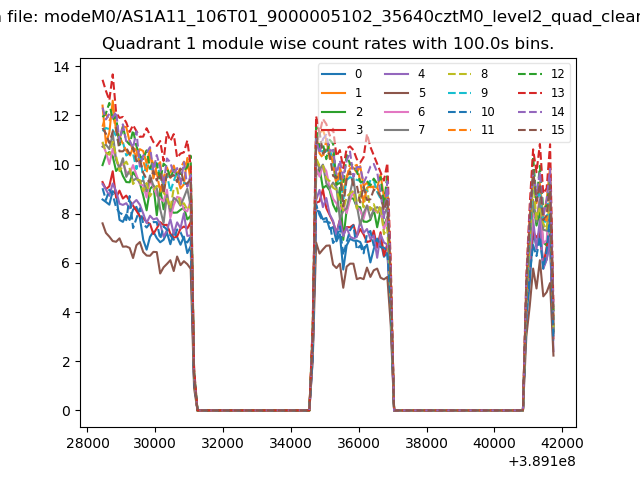
| Module-wise count rates for Quadrant A Data is divided into 100 sec bins |
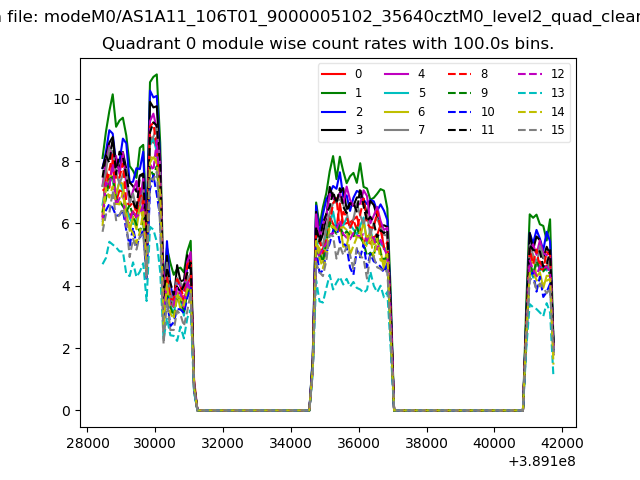 |
 |
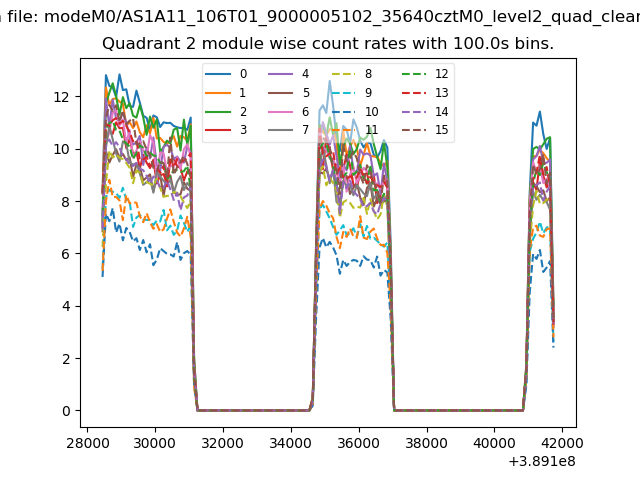
| Module-wise count rates for Quadrant B Data is divided into 100 sec bins |
 |
 |
| Module-wise count rates for Quadrant C Data is divided into 100 sec bins |
 |
 |
| Module-wise count rates for Quadrant D Data is divided into 100 sec bins |
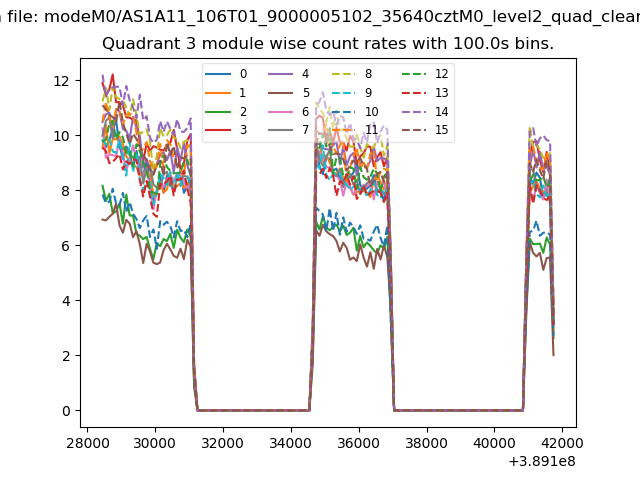 |
 |
| Parameter | Plot |
|---|---|
| CZT HV Monitor | 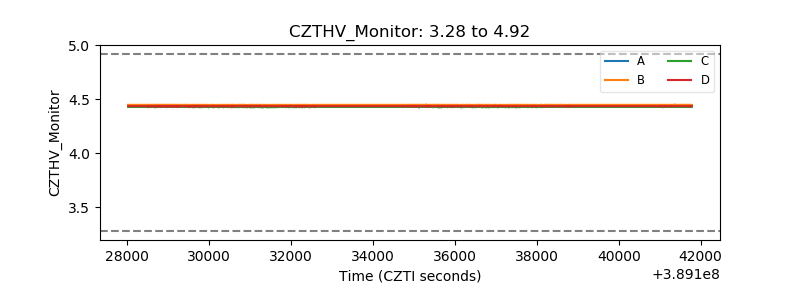 |
| D_VDD | 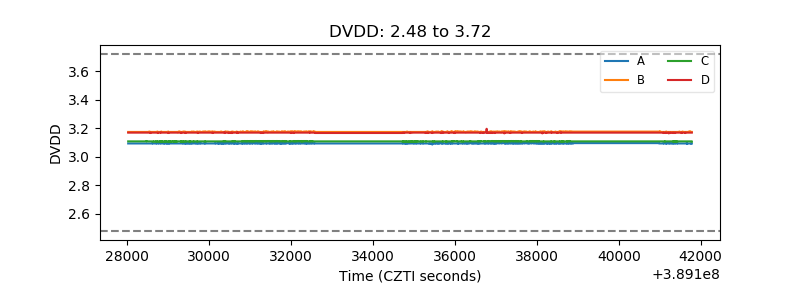 |
| Temperature 1 | 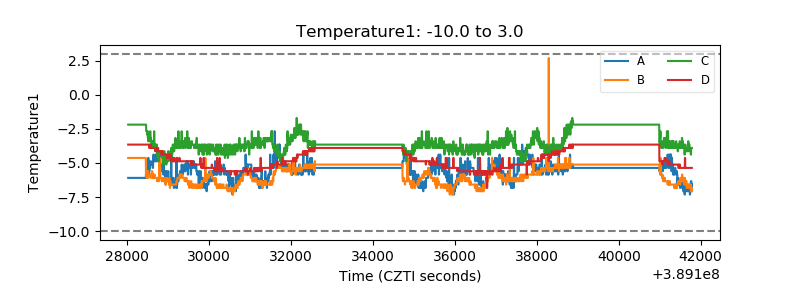 |
| Veto HV Monitor | 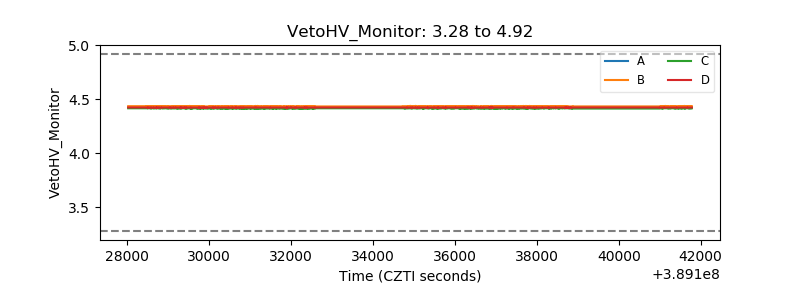 |
| Veto LLD | 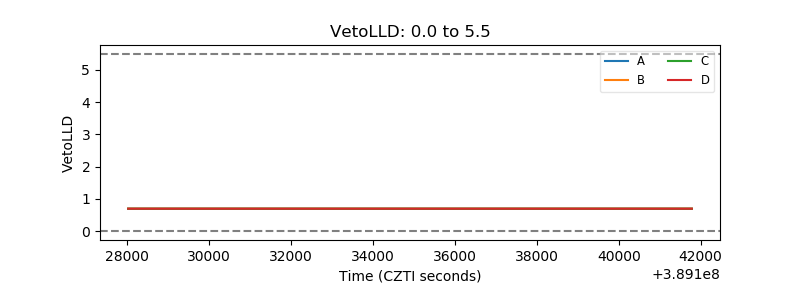 |
| Alpha Counter | 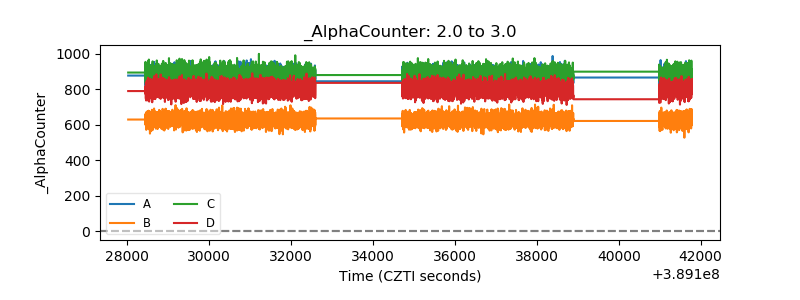 |
| _CPM_Rate | 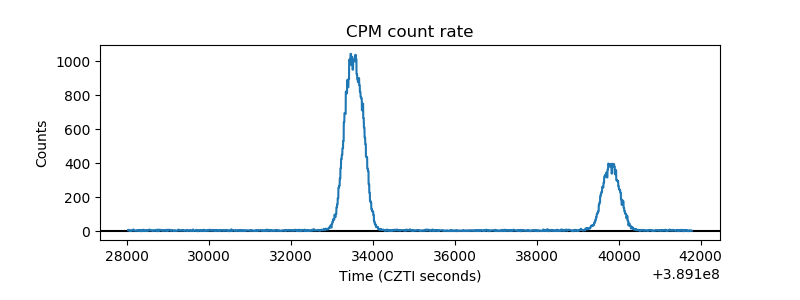 |
| CZT Counter | 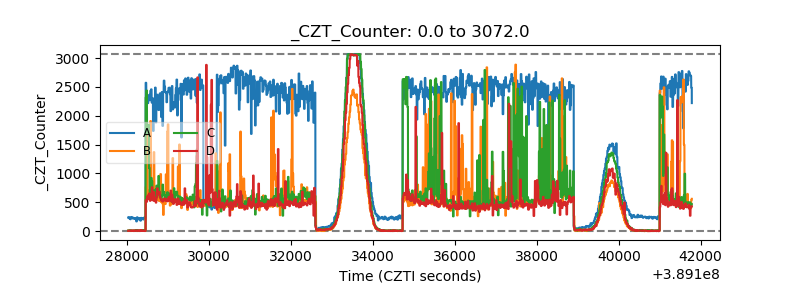 |
| +2.5 Volts monitor | 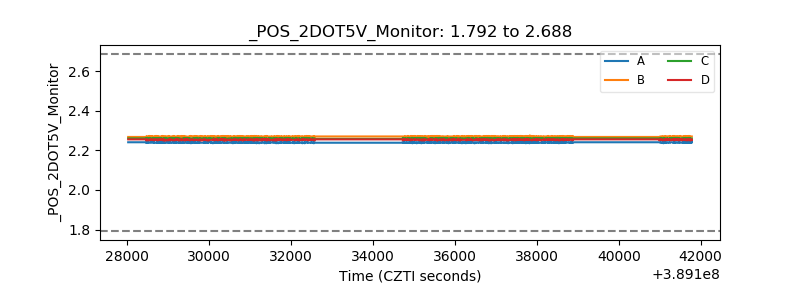 |
| +5 Volts monitor | 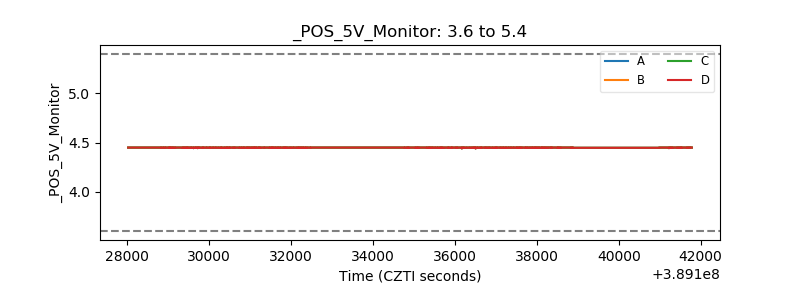 |
| _ROLL_ROT | 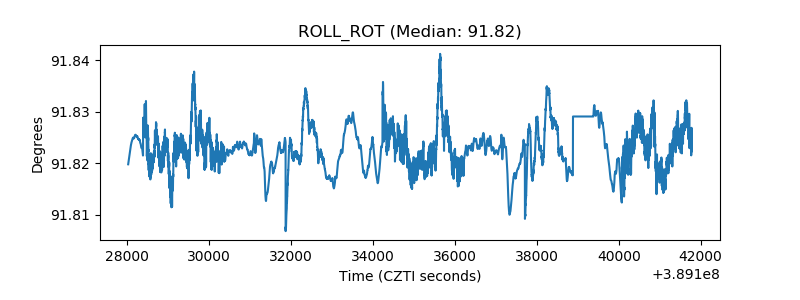 |
| _Roll_DEC | 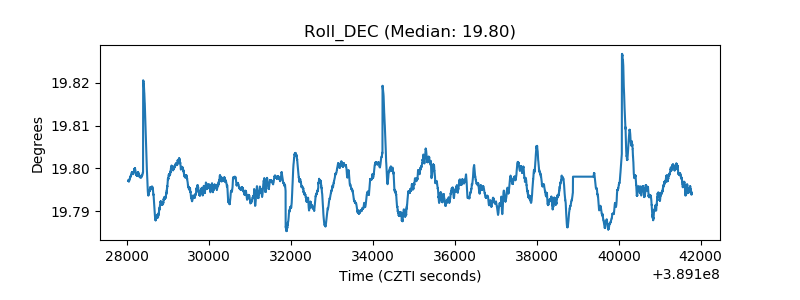 |
| _Roll_RA | 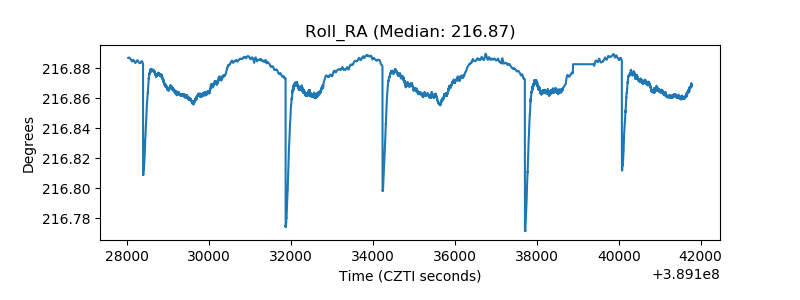 |
| Veto Counter |  |