| Param | Original file | Final file |
|---|---|---|
| Filename | modeM0/AS1T05_028T01_9000005100_35625cztM0_level2.evt | modeM0/AS1T05_028T01_9000005100_35625cztM0_level2_quad_clean.evt |
| Size (bytes) | 423,218,880 | 83,229,120 |
| Size | 403.6 MB | 79.4 MB |
| Events in quadrant A | 2,403,260 | 559,206 |
| Events in quadrant B | 4,208,611 | 545,905 |
| Events in quadrant C | 2,982,692 | 547,475 |
| Events in quadrant D | 2,892,463 | 526,613 |
| Mode M9 | |||
|---|---|---|---|
| Quadrant | BADHDUFLAG | Total packets | Discarded packets |
| A | 0 | 32 | 0 |
| B | 0 | 32 | 0 |
| C | 0 | 32 | 0 |
| D | 0 | 33 | 0 |
| Mode M0 | |||
|---|---|---|---|
| Quadrant | BADHDUFLAG | Total packets | Discarded packets |
| A | 0 | 10142 | 3 |
| B | 0 | 15646 | 2 |
| C | 0 | 11615 | 2 |
| D | 0 | 11720 | 2 |
| Mode SS | |||
|---|---|---|---|
| Quadrant | BADHDUFLAG | Total packets | Discarded packets |
| A | 0 | 98 | 0 |
| B | 0 | 98 | 0 |
| C | 0 | 98 | 0 |
| D | 0 | 98 | 0 |
| Quadrant | Total seconds | Saturated seconds | Saturation percentage |
|---|---|---|---|
| A | 4863 | 6 | 0.123381% |
| B | 4863 | 501 | 10.302283% |
| C | 4863 | 196 | 4.030434% |
| D | 4863 | 110 | 2.261978% |
Noise dominated data is calculated using 1-second bins in cleaned event files. If a bin has >2000 counts, and if more than 50% of those come from <1% of pixels, then it is considered to be noise-dominated and hence unusable.
| Quadrant | # 1 sec bins | Bins with >0 counts | Bins with >2000 counts | High rate bins dominated by noise | Noise dominated (total time) | Noise dominated (detector-on time) | Marked lightcurve |
|---|---|---|---|---|---|---|---|
| A | 7015 | 4864 | 0 | 0 | 0.00% | 0.00% | 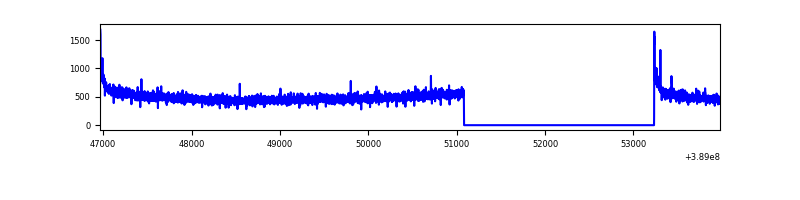 |
| B | 7015 | 4864 | 353 | 353 | 5.03% | 7.26% | 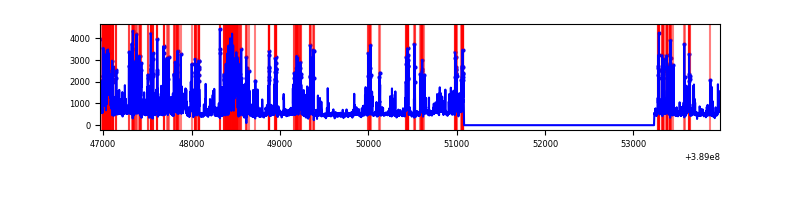 |
| C | 7015 | 4864 | 155 | 155 | 2.21% | 3.19% | 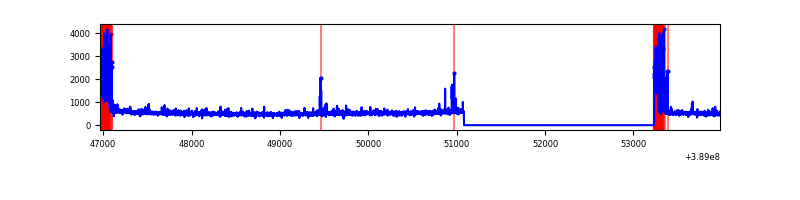 |
| D | 7015 | 4864 | 97 | 97 | 1.38% | 1.99% | 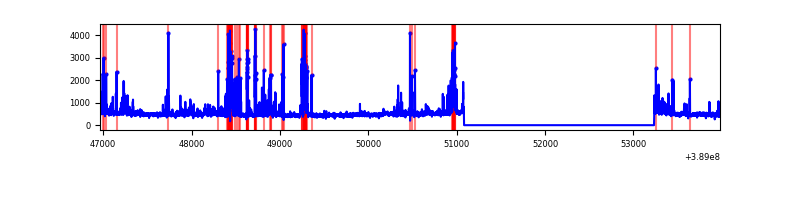 |
Top three noisy pixels from each quadrant. If the there are fewer than three noisy pixels in the level2.evt file, extra rows are filled as -1
| Pixel properties | Quadrant properties | ||||||
|---|---|---|---|---|---|---|---|
| Quadrant | DetID | PixID | Counts | Sigma | Mean | Median | Sigma |
| A | 10 | 83 | 131448 | 1125.77 | 581 | 572 | 116.3 |
| A | 15 | 169 | 17971 | 149.66 | 581 | 572 | 116.3 |
| A | 13 | 6 | 8244 | 65.99 | 581 | 572 | 116.3 |
| B | 5 | 172 | 1860349 | 17439.59 | 562 | 549 | 106.6 |
| B | 0 | 189 | 42525 | 393.61 | 562 | 549 | 106.6 |
| B | 0 | 245 | 37978 | 350.98 | 562 | 549 | 106.6 |
| C | 0 | 10 | 571784 | 4354.16 | 564 | 571 | 131.2 |
| C | 15 | 214 | 197228 | 1499.05 | 564 | 571 | 131.2 |
| C | 12 | 249 | 6281 | 43.53 | 564 | 571 | 131.2 |
| D | 7 | 80 | 407170 | 2955.6 | 566 | 551 | 137.6 |
| D | 13 | 249 | 65745 | 473.87 | 566 | 551 | 137.6 |
| D | 12 | 233 | 65379 | 471.21 | 566 | 551 | 137.6 |
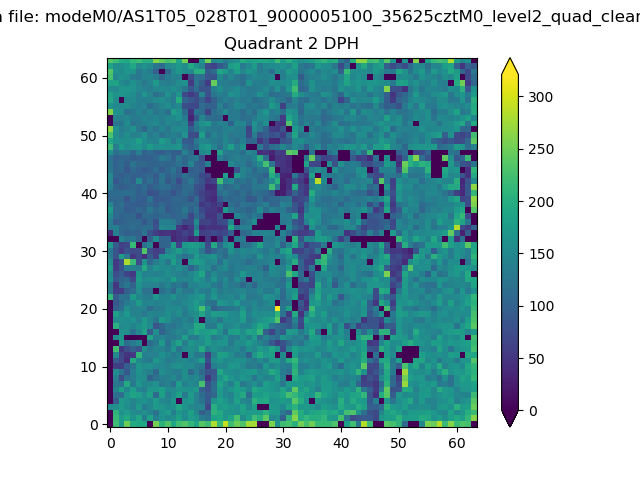
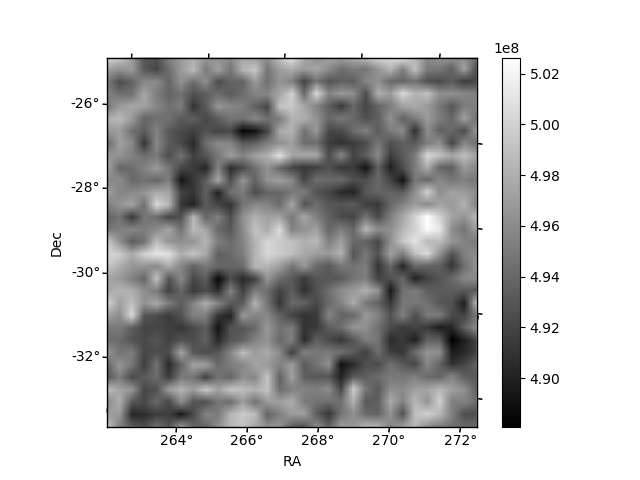
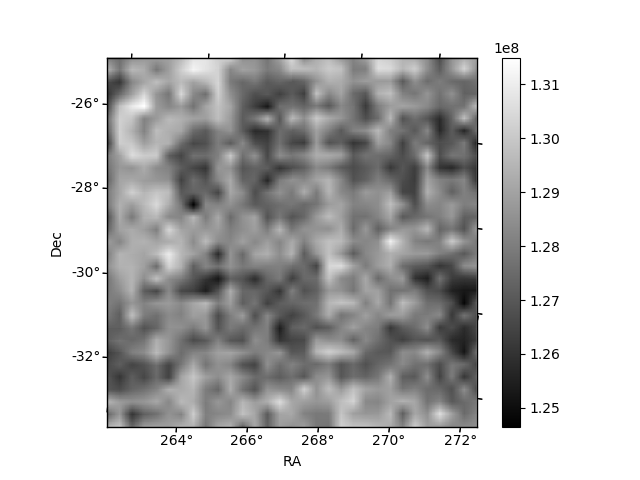
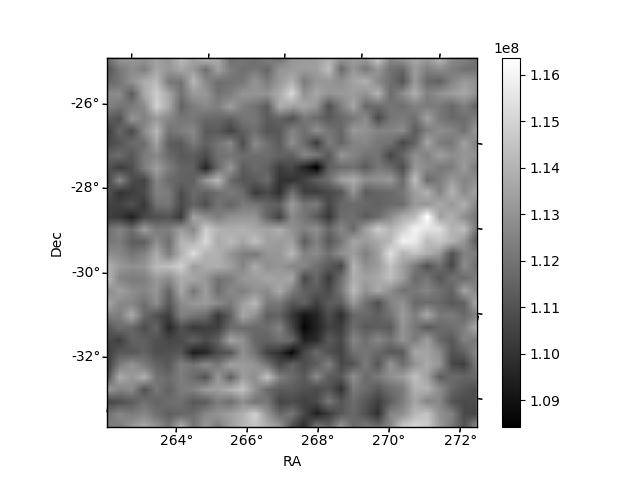
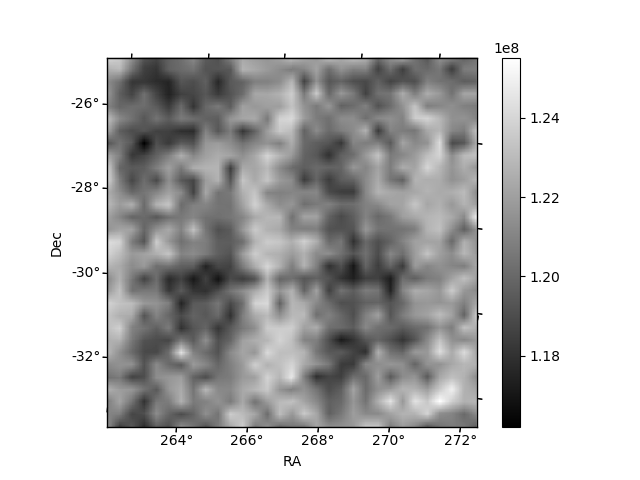
Histogram calculated using DETX and DETY for each event in the final _common_clean file
| Quadrant A | 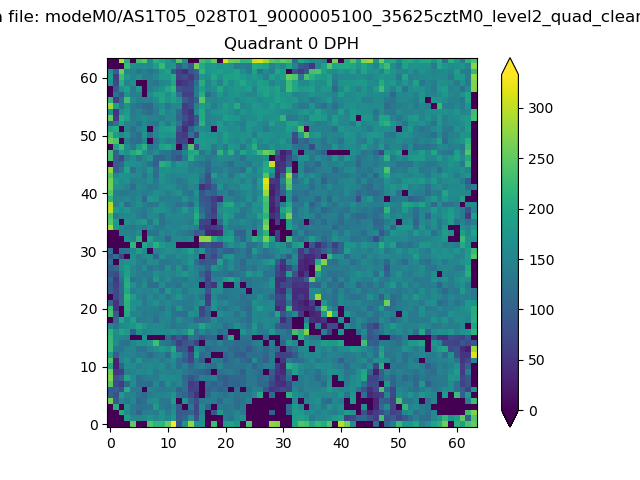 |
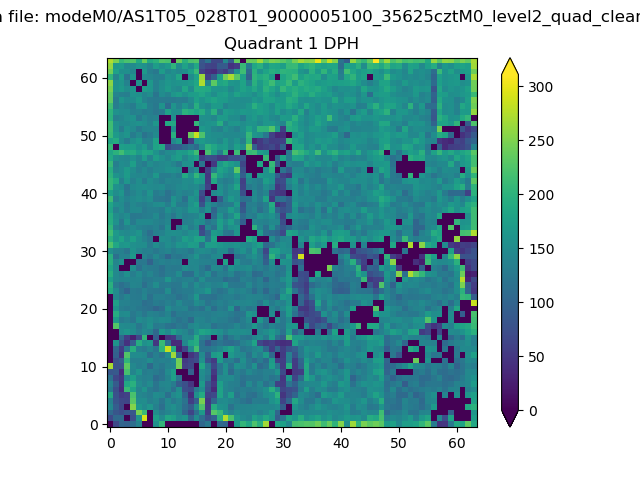 |
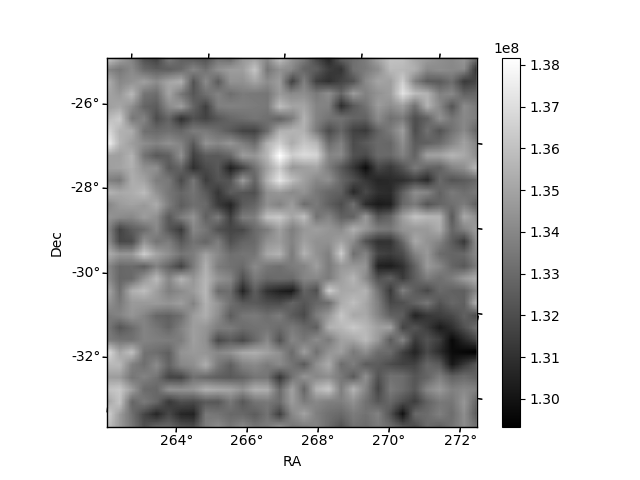
Quadrant B |
|---|---|---|---|
| Quadrant D | 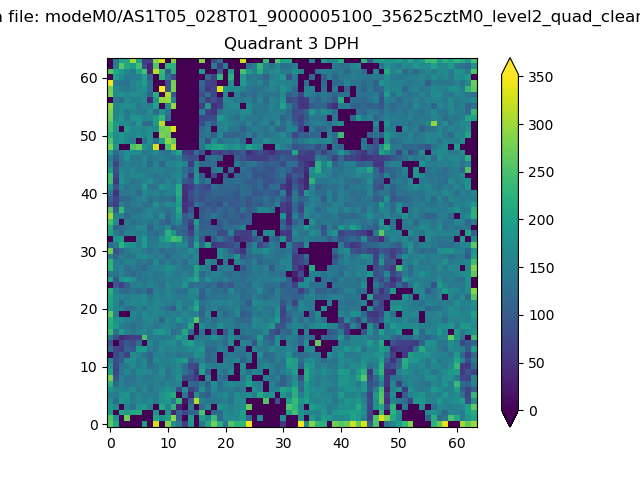 |
 |
Quadrant C |
| Plot type | Count rate plots | Images |
|---|---|---|
| Comparison with Poisson distribution Blue bars denote a histogram of data divided into 1 sec bins. Red curve is a Poisson curve with rate = median count rate of data. |
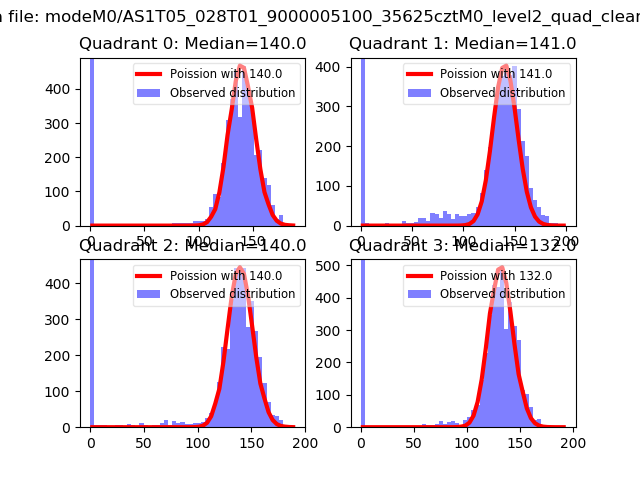 |
 |
| Quadrant-wise count rates Data is divided into 100 sec bins |
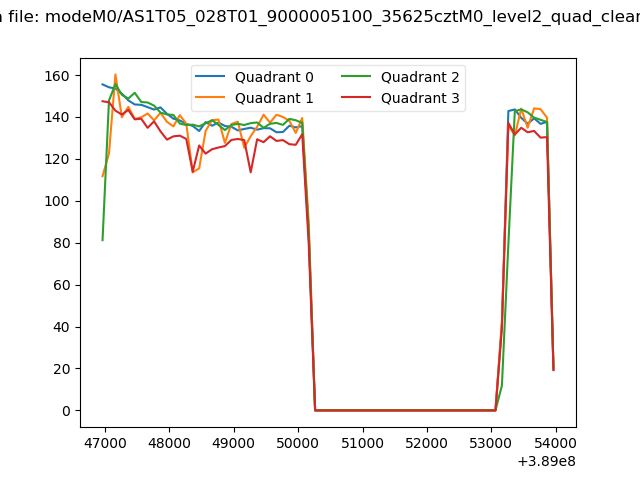 |
|
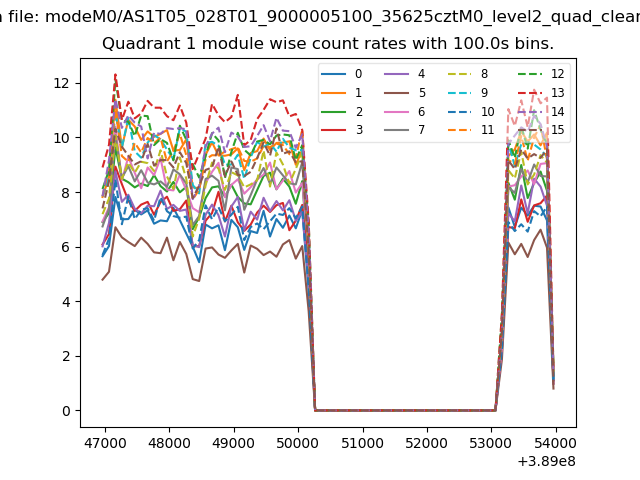
| Module-wise count rates for Quadrant A Data is divided into 100 sec bins |
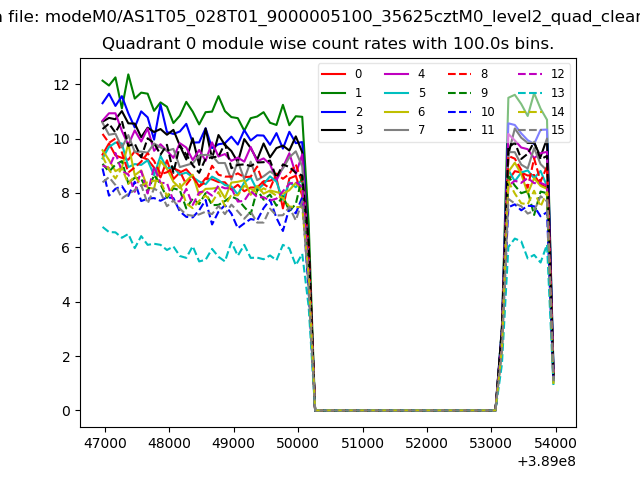 |
 |
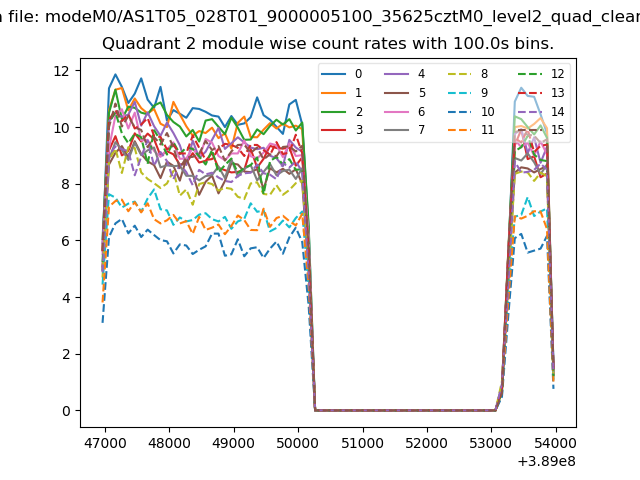
| Module-wise count rates for Quadrant B Data is divided into 100 sec bins |
 |
 |
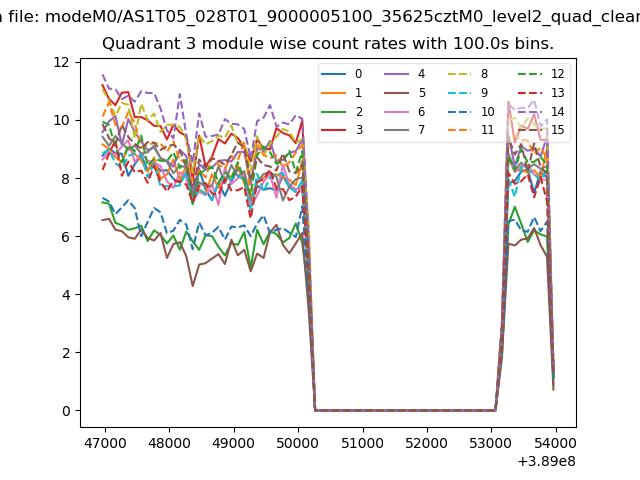
| Module-wise count rates for Quadrant C Data is divided into 100 sec bins |
 |
 |
| Module-wise count rates for Quadrant D Data is divided into 100 sec bins |
 |
 |
| Parameter | Plot |
|---|---|
| CZT HV Monitor | 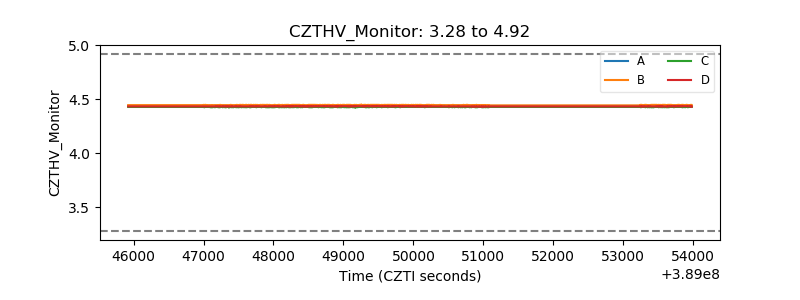 |
| D_VDD | 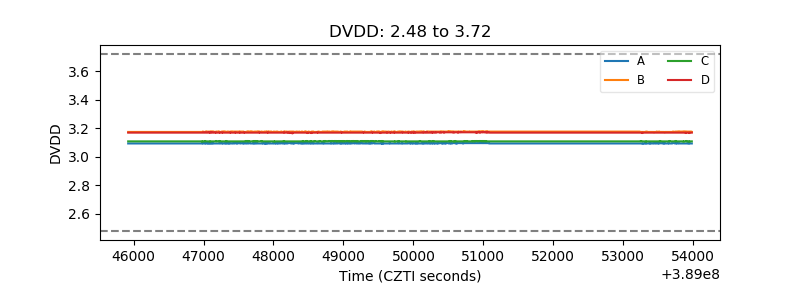 |
| Temperature 1 | 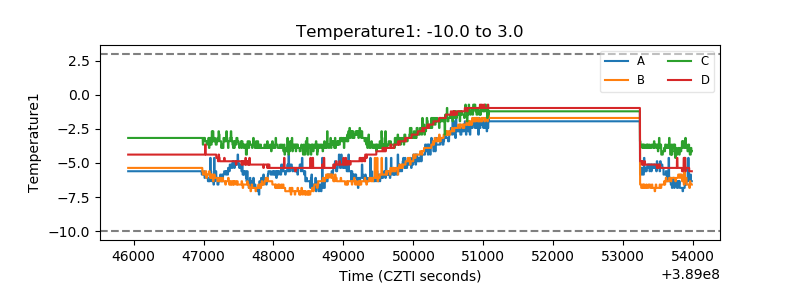 |
| Veto HV Monitor | 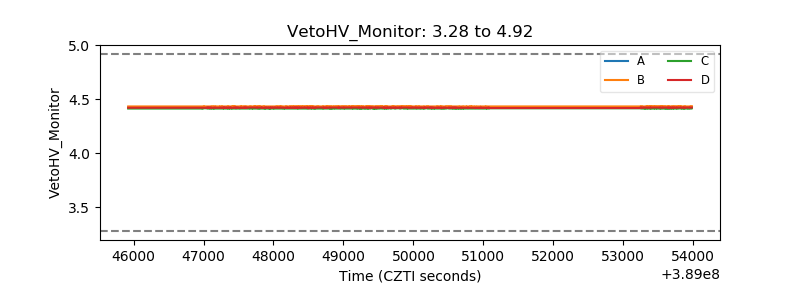 |
| Veto LLD | 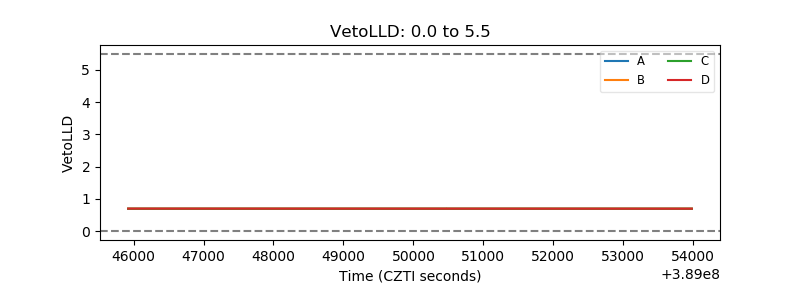 |
| Alpha Counter | 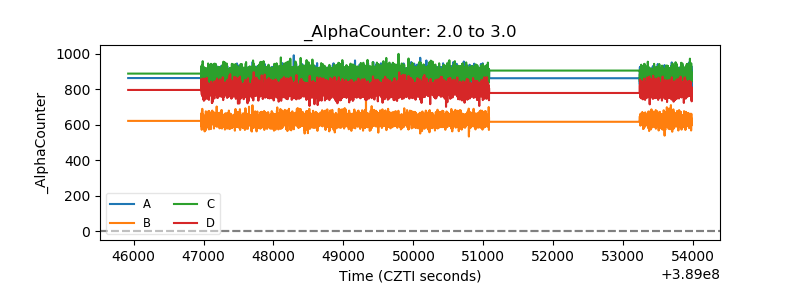 |
| _CPM_Rate | 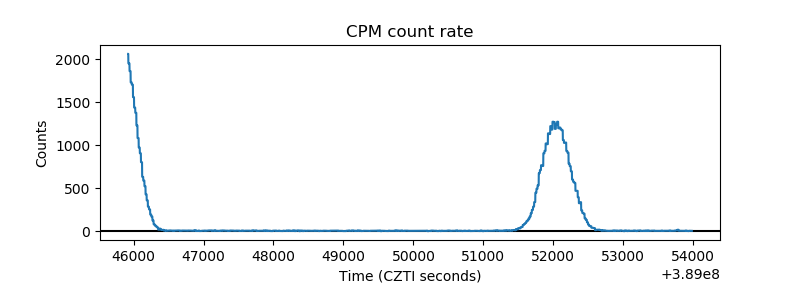 |
| CZT Counter | 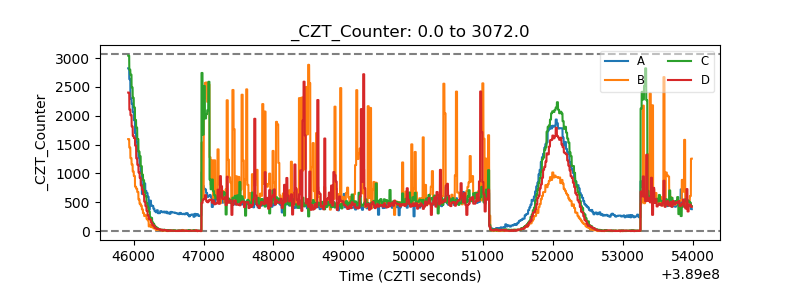 |
| +2.5 Volts monitor | 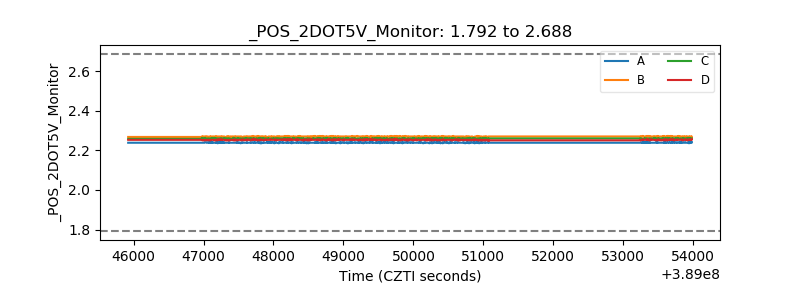 |
| +5 Volts monitor | 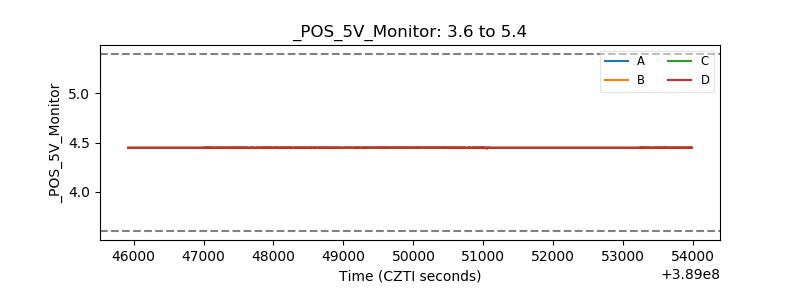 |
| _ROLL_ROT | 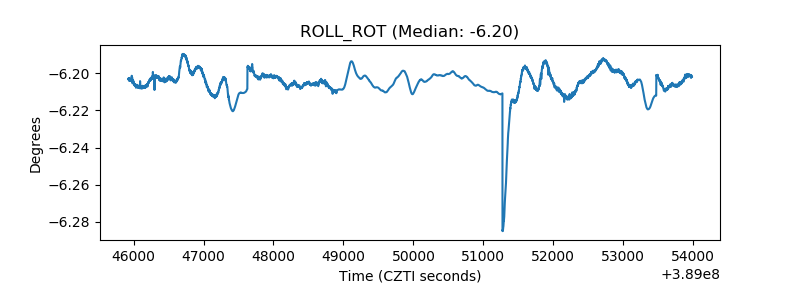 |
| _Roll_DEC | 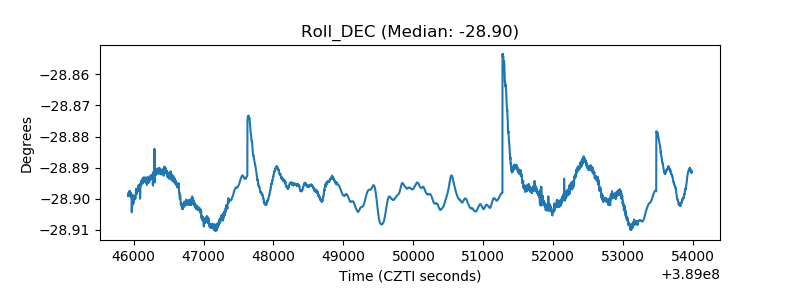 |
| _Roll_RA | 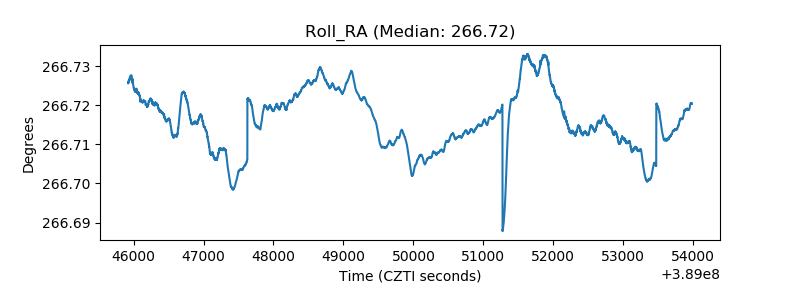 |
| Veto Counter | 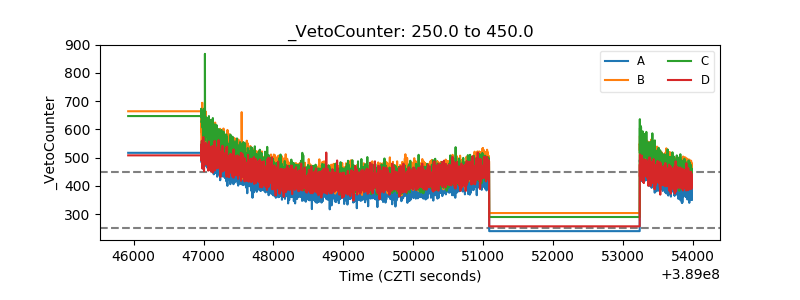 |