| Param | Original file | Final file |
|---|---|---|
| Filename | modeM0/AS1T05_028T01_9000005100_35622cztM0_level2.evt | modeM0/AS1T05_028T01_9000005100_35622cztM0_level2_quad_clean.evt |
| Size (bytes) | 442,889,280 | 79,940,160 |
| Size | 422.4 MB | 76.2 MB |
| Events in quadrant A | 2,599,136 | 528,103 |
| Events in quadrant B | 3,636,933 | 529,730 |
| Events in quadrant C | 3,267,605 | 522,717 |
| Events in quadrant D | 3,564,241 | 484,125 |
| Mode M9 | |||
|---|---|---|---|
| Quadrant | BADHDUFLAG | Total packets | Discarded packets |
| A | 0 | 31 | 0 |
| B | 0 | 31 | 0 |
| C | 0 | 31 | 0 |
| D | 0 | 32 | 0 |
| Mode M0 | |||
|---|---|---|---|
| Quadrant | BADHDUFLAG | Total packets | Discarded packets |
| A | 0 | 10899 | 3 |
| B | 0 | 14083 | 2 |
| C | 0 | 12700 | 2 |
| D | 0 | 14020 | 2 |
| Mode SS | |||
|---|---|---|---|
| Quadrant | BADHDUFLAG | Total packets | Discarded packets |
| A | 0 | 102 | 0 |
| B | 0 | 102 | 0 |
| C | 0 | 102 | 0 |
| D | 0 | 102 | 0 |
| Quadrant | Total seconds | Saturated seconds | Saturation percentage |
|---|---|---|---|
| A | 5084 | 8 | 0.157356% |
| B | 5084 | 320 | 6.294256% |
| C | 5084 | 184 | 3.619197% |
| D | 5084 | 276 | 5.428796% |
Noise dominated data is calculated using 1-second bins in cleaned event files. If a bin has >2000 counts, and if more than 50% of those come from <1% of pixels, then it is considered to be noise-dominated and hence unusable.
| Quadrant | # 1 sec bins | Bins with >0 counts | Bins with >2000 counts | High rate bins dominated by noise | Noise dominated (total time) | Noise dominated (detector-on time) | Marked lightcurve |
|---|---|---|---|---|---|---|---|
| A | 6997 | 5085 | 1 | 1 | 0.01% | 0.02% | 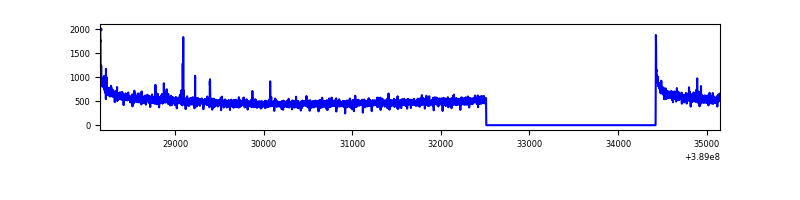 |
| B | 6997 | 5085 | 210 | 210 | 3.00% | 4.13% | 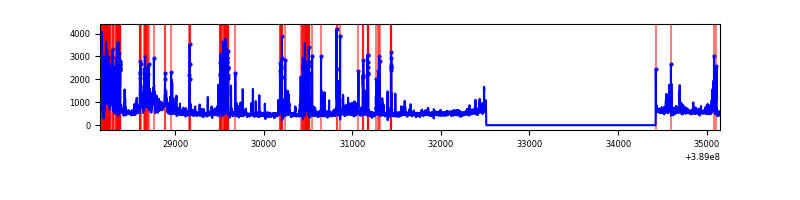 |
| C | 6997 | 5085 | 138 | 138 | 1.97% | 2.71% | 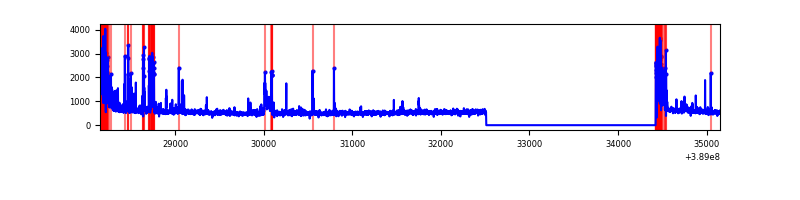 |
| D | 6997 | 5085 | 207 | 207 | 2.96% | 4.07% | 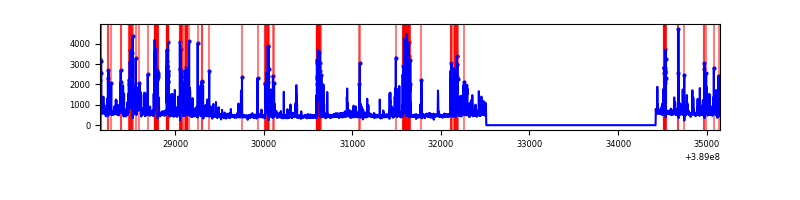 |
Top three noisy pixels from each quadrant. If the there are fewer than three noisy pixels in the level2.evt file, extra rows are filled as -1
| Pixel properties | Quadrant properties | ||||||
|---|---|---|---|---|---|---|---|
| Quadrant | DetID | PixID | Counts | Sigma | Mean | Median | Sigma |
| A | 10 | 83 | 142648 | 1124.96 | 627 | 615 | 126.3 |
| A | 15 | 169 | 18454 | 141.29 | 627 | 615 | 126.3 |
| A | 7 | 3 | 9843 | 73.09 | 627 | 615 | 126.3 |
| B | 5 | 172 | 933030 | 8088.74 | 610 | 595 | 115.3 |
| B | 0 | 190 | 116413 | 1004.7 | 610 | 595 | 115.3 |
| B | 0 | 155 | 70845 | 609.41 | 610 | 595 | 115.3 |
| C | 0 | 10 | 420633 | 3027.26 | 600 | 606 | 138.7 |
| C | 15 | 214 | 208975 | 1501.78 | 600 | 606 | 138.7 |
| C | 1 | 23 | 165257 | 1186.69 | 600 | 606 | 138.7 |
| D | 7 | 80 | 432441 | 3017.9 | 590 | 576 | 143.1 |
| D | 10 | 118 | 375395 | 2619.26 | 590 | 576 | 143.1 |
| D | 12 | 17 | 159464 | 1110.32 | 590 | 576 | 143.1 |
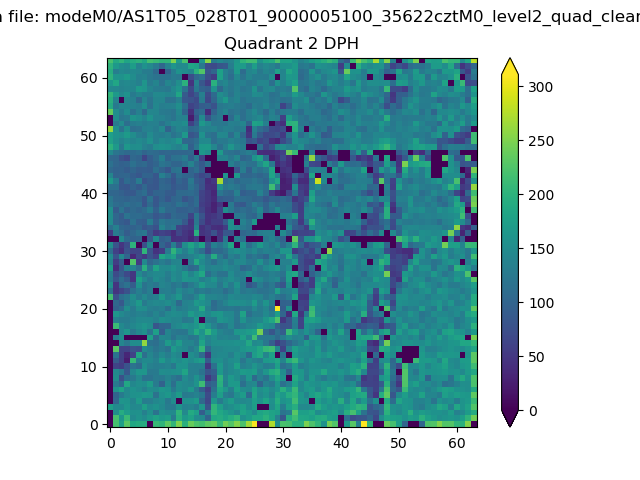
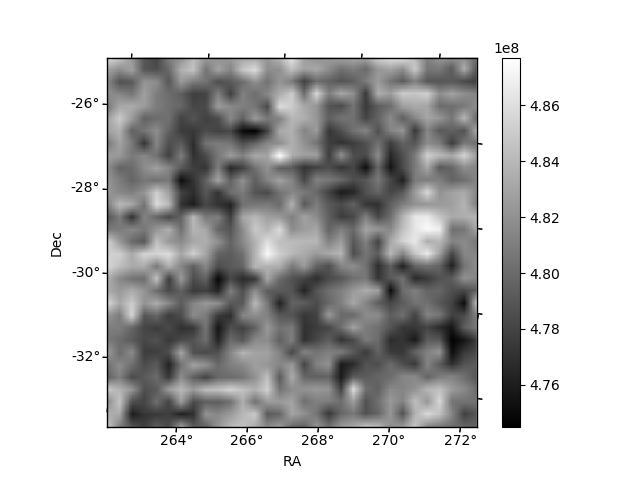
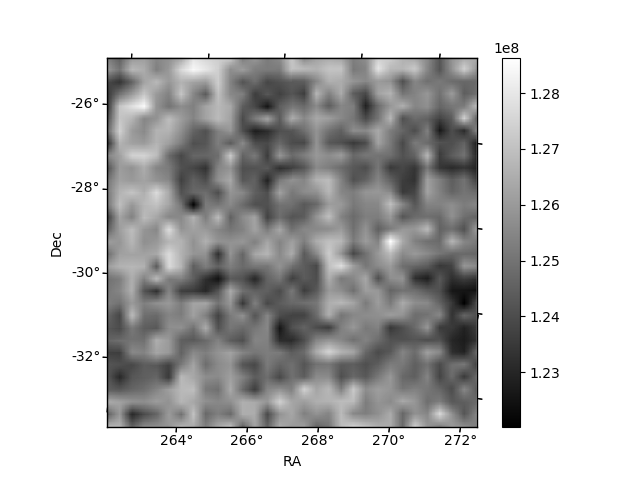
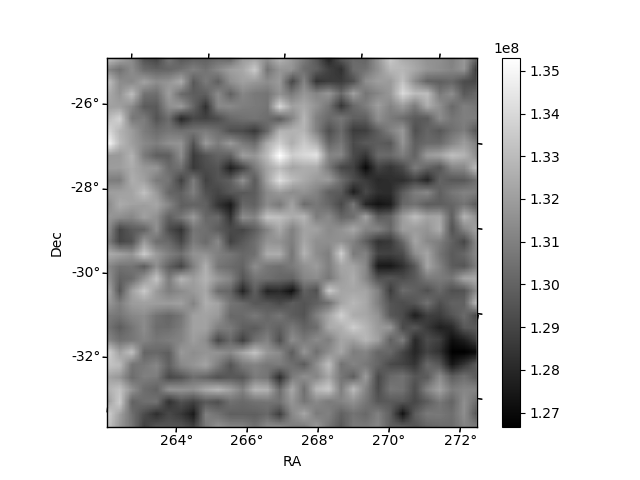
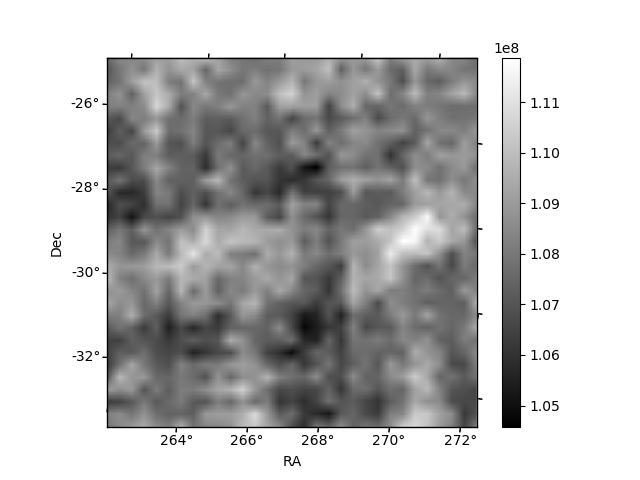
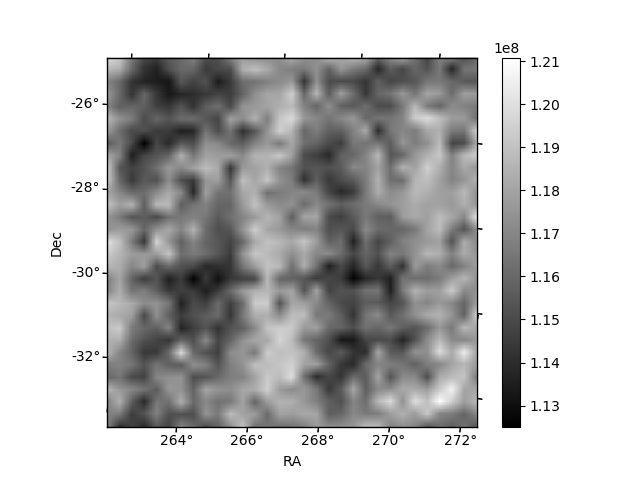
Histogram calculated using DETX and DETY for each event in the final _common_clean file
| Quadrant A | 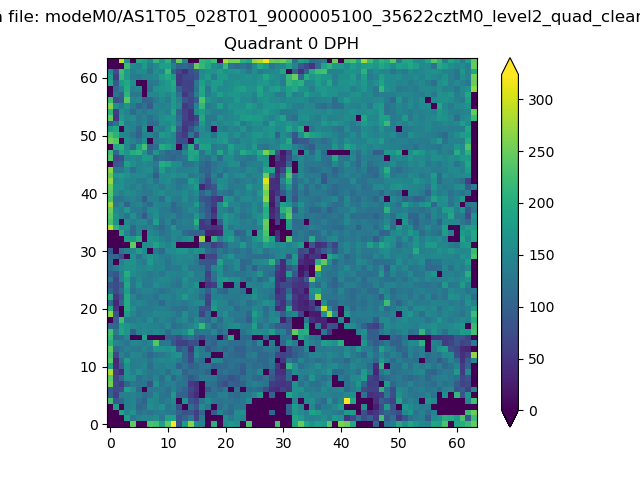 |
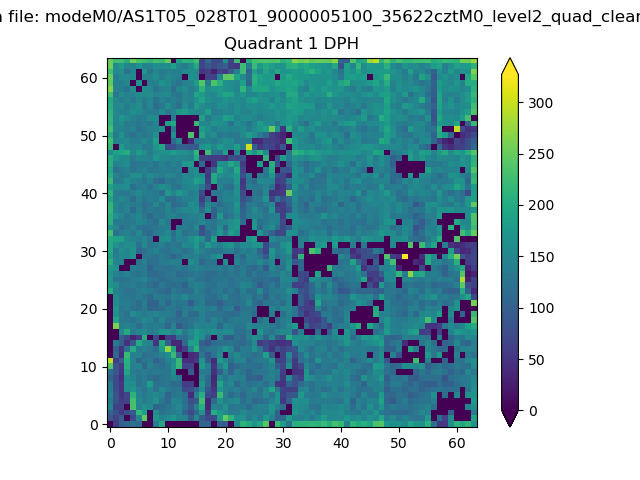 |
Quadrant B |
|---|---|---|---|
| Quadrant D | 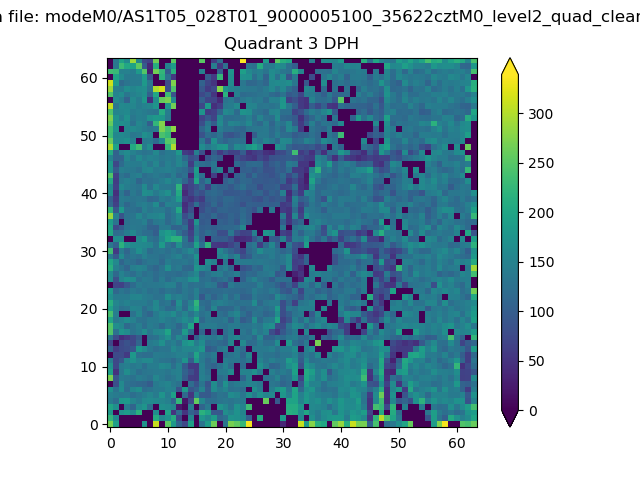 |
 |
Quadrant C |
| Plot type | Count rate plots | Images |
|---|---|---|
| Comparison with Poisson distribution Blue bars denote a histogram of data divided into 1 sec bins. Red curve is a Poisson curve with rate = median count rate of data. |
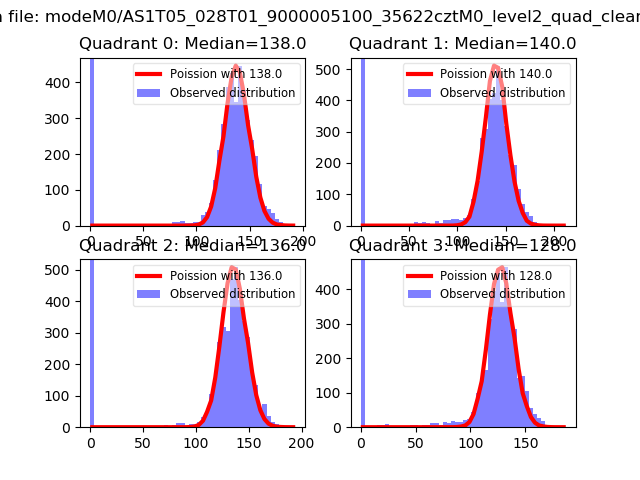 |
 |
| Quadrant-wise count rates Data is divided into 100 sec bins |
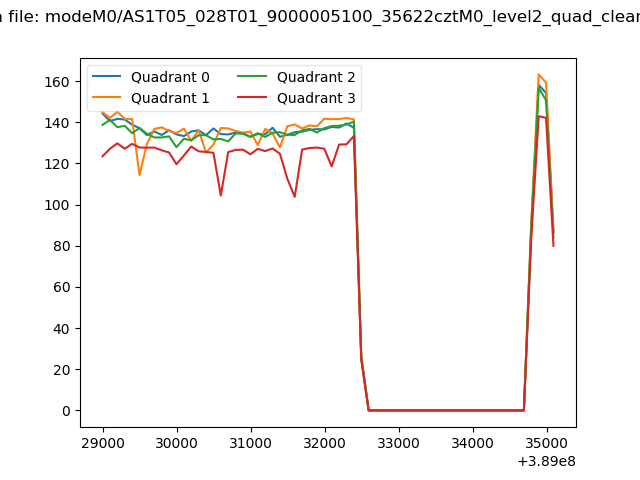 |
|
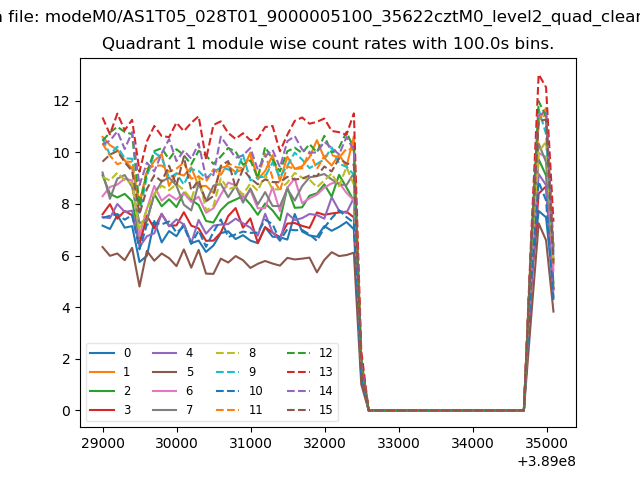
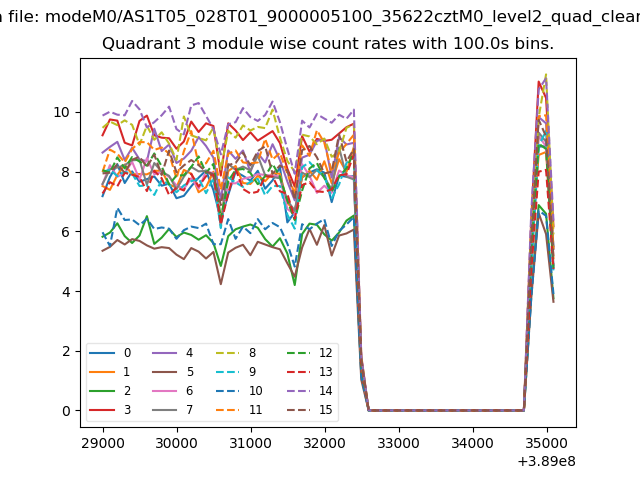
| Module-wise count rates for Quadrant A Data is divided into 100 sec bins |
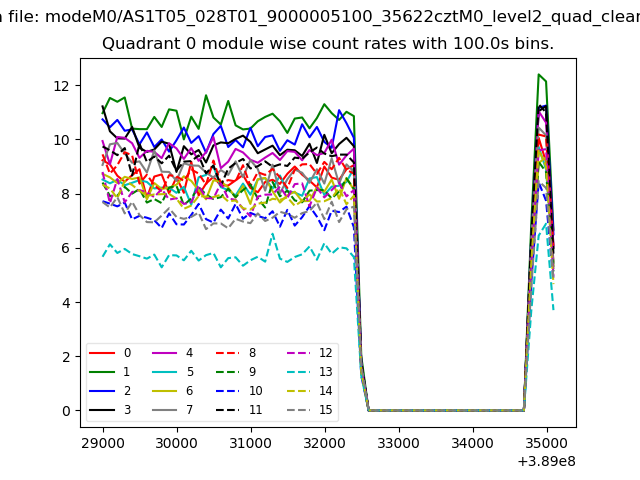 |
 |
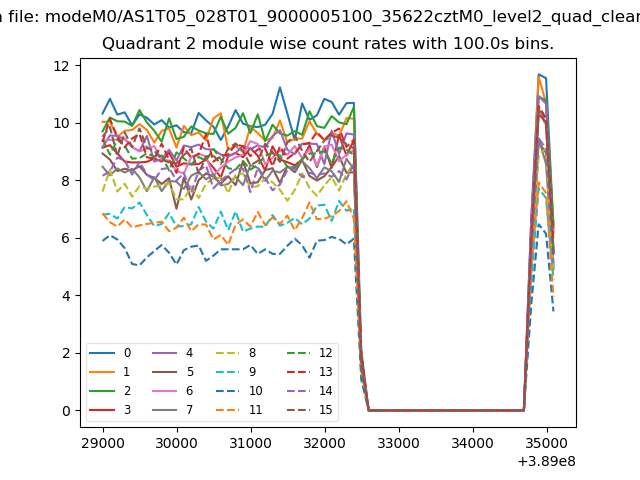
| Module-wise count rates for Quadrant B Data is divided into 100 sec bins |
 |
 |
| Module-wise count rates for Quadrant C Data is divided into 100 sec bins |
 |
 |
| Module-wise count rates for Quadrant D Data is divided into 100 sec bins |
 |
 |
| Parameter | Plot |
|---|---|
| CZT HV Monitor | 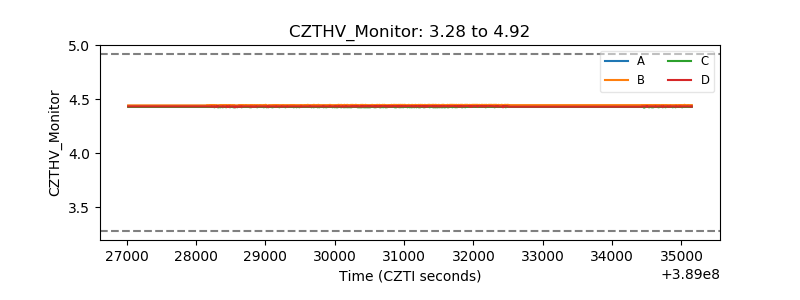 |
| D_VDD | 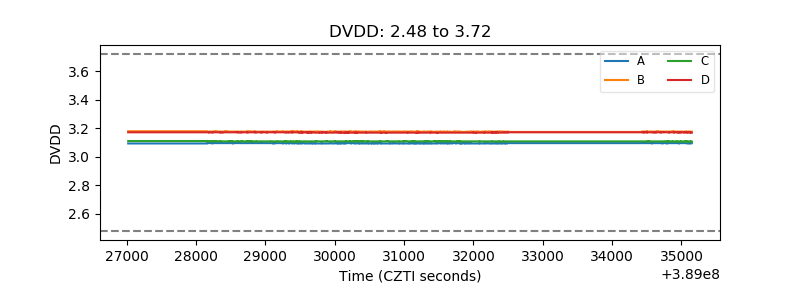 |
| Temperature 1 | 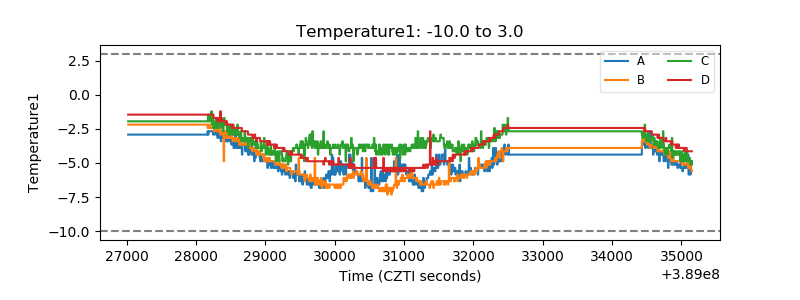 |
| Veto HV Monitor | 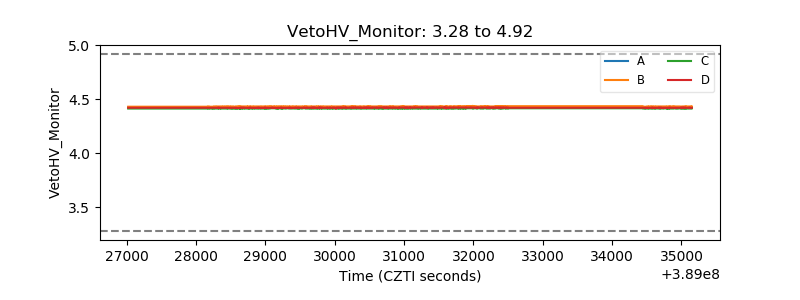 |
| Veto LLD | 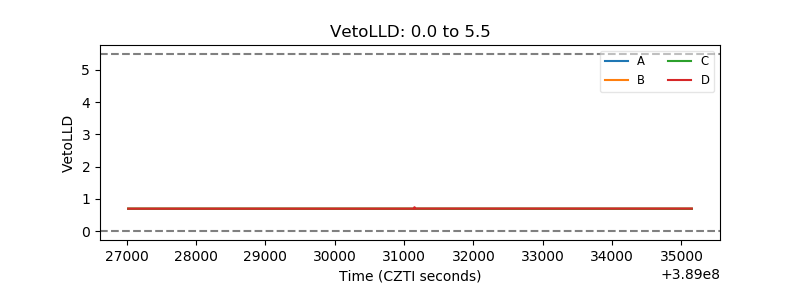 |
| Alpha Counter | 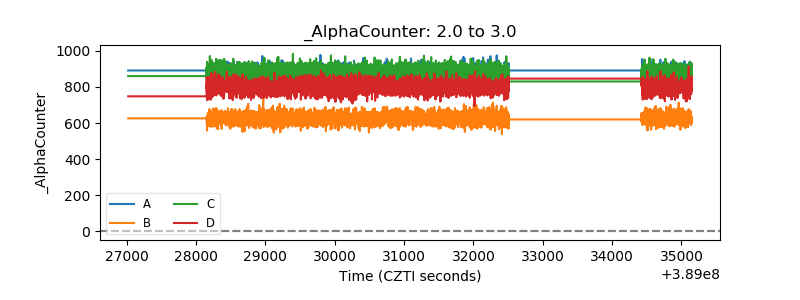 |
| _CPM_Rate | 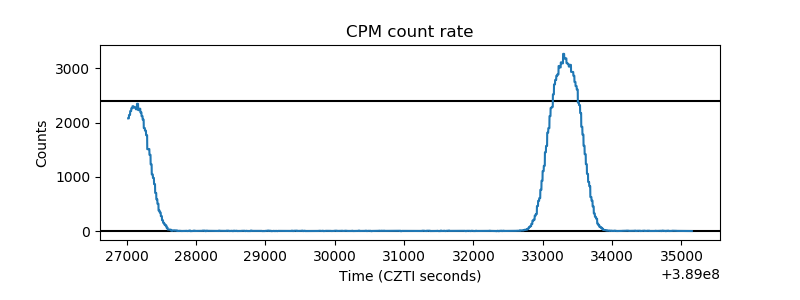 |
| CZT Counter | 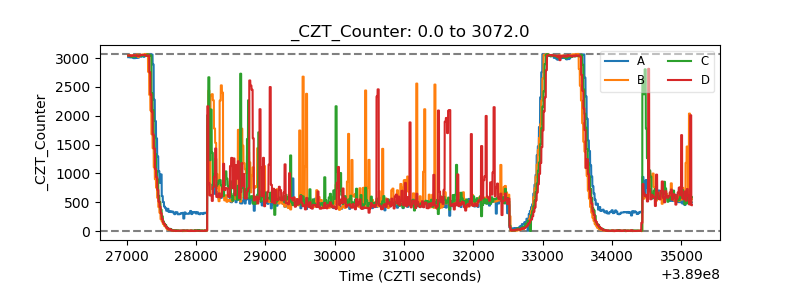 |
| +2.5 Volts monitor | 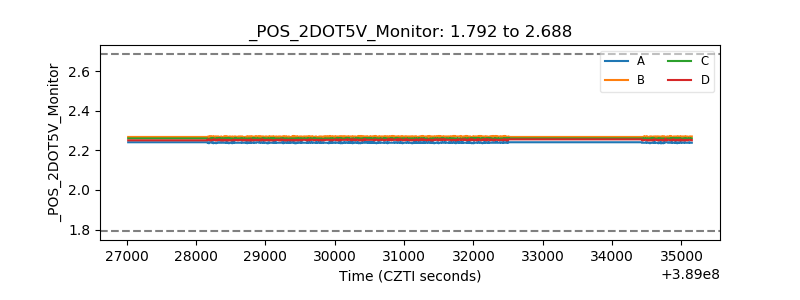 |
| +5 Volts monitor | 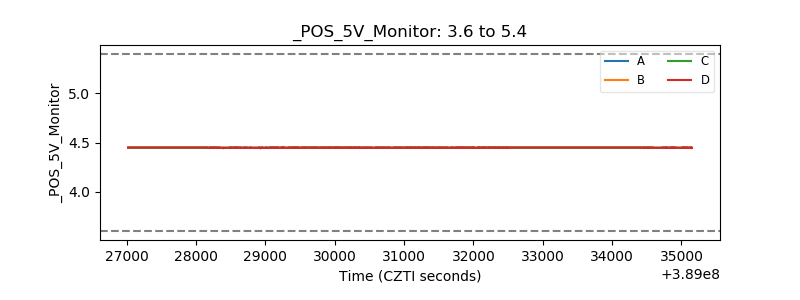 |
| _ROLL_ROT | 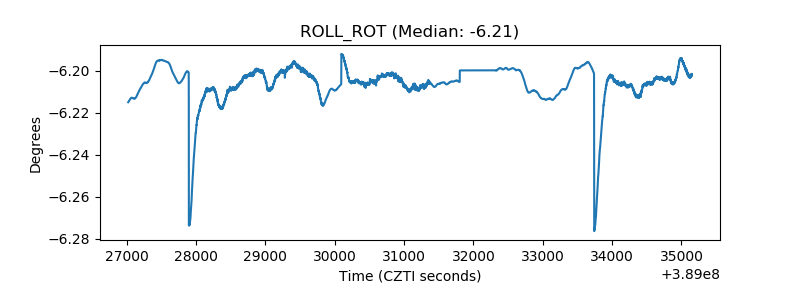 |
| _Roll_DEC | 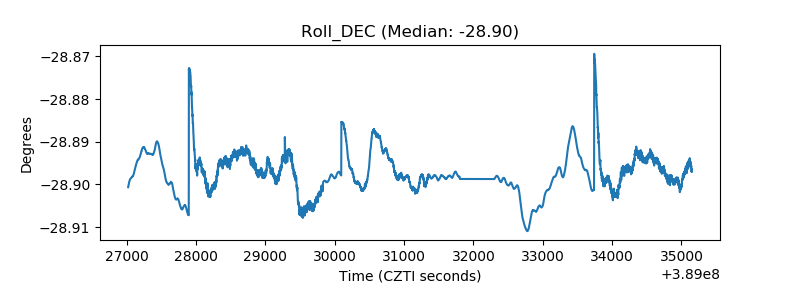 |
| _Roll_RA | 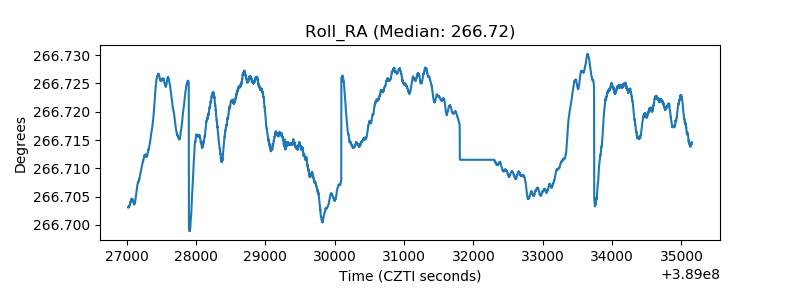 |
| Veto Counter | 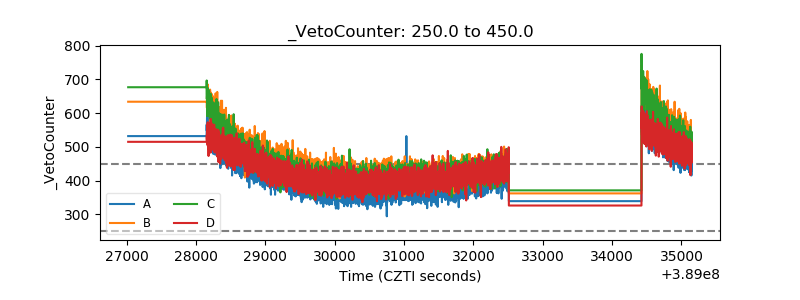 |