| Param | Original file | Final file |
|---|---|---|
| Filename | modeM0/AS1T05_028T01_9000005100cztM0_level2_bc.evt | modeM0/AS1T05_028T01_9000005100cztM0_level2_quad_clean.evt |
| Size (bytes) | 3,588,137,280 | 835,032,960 |
| Size | 3.3 GB | 796.3 MB |
| Events in quadrant A | 32,863,226 | 5,161,970 |
| Events in quadrant B | 26,712,630 | 5,340,393 |
| Events in quadrant C | 21,378,421 | 5,362,391 |
| Events in quadrant D | 23,419,235 | 5,093,649 |
| Mode M9 | |||
|---|---|---|---|
| Quadrant | BADHDUFLAG | Total packets | Discarded packets |
| A | 0 | 228 | 0 |
| B | 0 | 228 | 0 |
| C | 0 | 228 | 0 |
| D | 0 | 228 | 0 |
| Mode M0 | |||
|---|---|---|---|
| Quadrant | BADHDUFLAG | Total packets | Discarded packets |
| A | 0 | 188361 | 0 |
| B | 0 | 185218 | 0 |
| C | 0 | 152573 | 0 |
| D | 0 | 162905 | 0 |
| Mode SS | |||
|---|---|---|---|
| Quadrant | BADHDUFLAG | Total packets | Discarded packets |
| A | 0 | 1290 | 0 |
| B | 0 | 1290 | 0 |
| C | 0 | 1289 | 0 |
| D | 0 | 1290 | 0 |
| Quadrant | Total seconds | Saturated seconds | Saturation percentage |
|---|---|---|---|
| A | 63082 | 9289 | 14.725278% |
| B | 63161 | 5737 | 9.083137% |
| C | 63163 | 1570 | 2.485632% |
| D | 63171 | 2095 | 3.316395% |
Noise dominated data is calculated using 1-second bins in cleaned event files. If a bin has >2000 counts, and if more than 50% of those come from <1% of pixels, then it is considered to be noise-dominated and hence unusable.
| Quadrant | # 1 sec bins | Bins with >0 counts | Bins with >2000 counts | High rate bins dominated by noise | Noise dominated (total time) | Noise dominated (detector-on time) | Marked lightcurve |
|---|---|---|---|---|---|---|---|
| A | 85793 | 63208 | 6399 | 6399 | 7.46% | 10.12% | 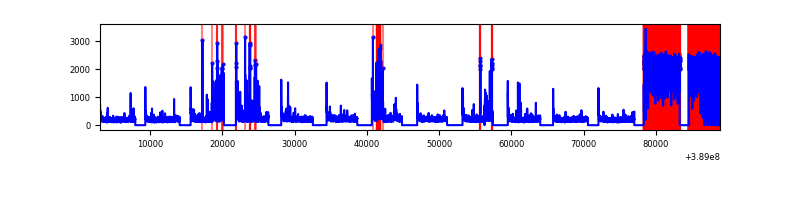 |
| B | 85792 | 63206 | 508 | 508 | 0.59% | 0.80% | 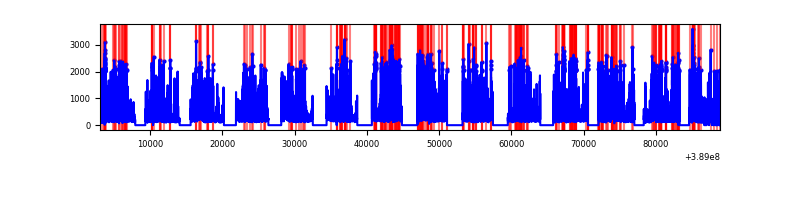 |
| C | 85792 | 63217 | 261 | 261 | 0.30% | 0.41% | 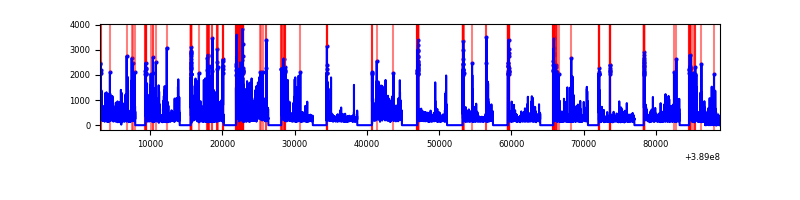 |
| D | 85792 | 63226 | 473 | 473 | 0.55% | 0.75% | 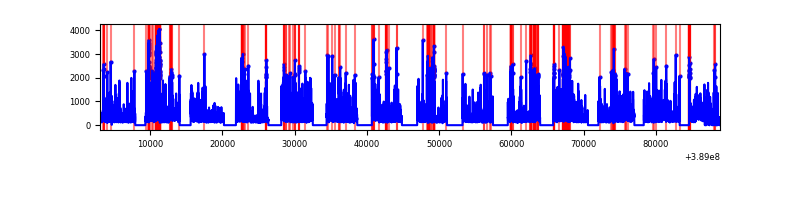 |
Top three noisy pixels from each quadrant. If the there are fewer than three noisy pixels in the level2.evt file, extra rows are filled as -1
| Pixel properties | Quadrant properties | ||||||
|---|---|---|---|---|---|---|---|
| Quadrant | DetID | PixID | Counts | Sigma | Mean | Median | Sigma |
| A | 15 | 169 | 18703701 | 27481.67 | 3084 | 3038 | 680.5 |
| A | 10 | 83 | 1211899 | 1776.49 | 3084 | 3038 | 680.5 |
| A | 7 | 16 | 871431 | 1276.15 | 3084 | 3038 | 680.5 |
| B | 5 | 172 | 12567088 | 20170.47 | 3171 | 3106 | 622.9 |
| B | 5 | 200 | 600450 | 958.99 | 3171 | 3106 | 622.9 |
| B | 0 | 189 | 431368 | 687.54 | 3171 | 3106 | 622.9 |
| C | 0 | 10 | 4797091 | 6563.12 | 3182 | 3172 | 730.4 |
| C | 15 | 214 | 2430843 | 3323.61 | 3182 | 3172 | 730.4 |
| C | 9 | 187 | 1179751 | 1610.8 | 3182 | 3172 | 730.4 |
| D | 7 | 80 | 2603495 | 3471.31 | 3171 | 3089 | 749.1 |
| D | 1 | 52 | 1837239 | 2448.43 | 3171 | 3089 | 749.1 |
| D | 14 | 52 | 1338832 | 1783.1 | 3171 | 3089 | 749.1 |
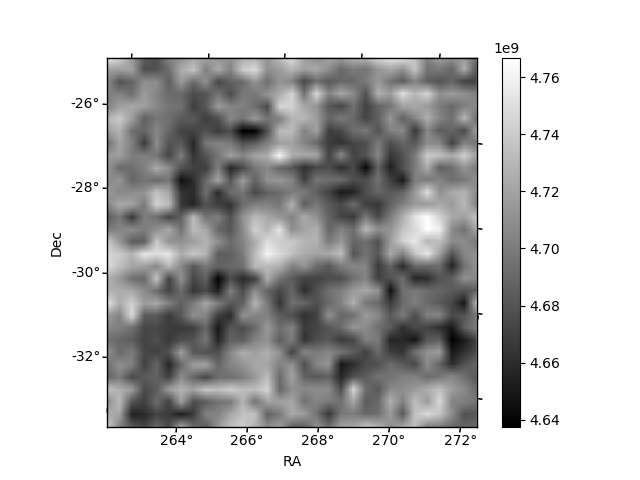
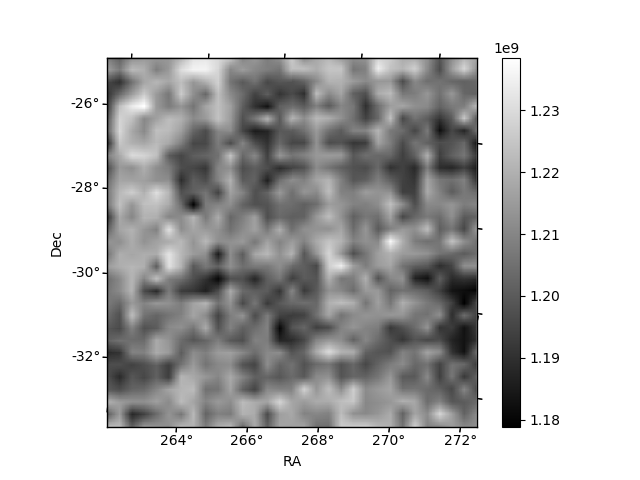
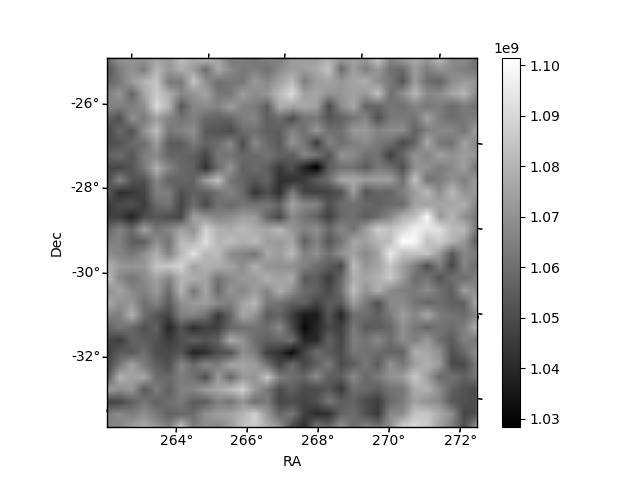
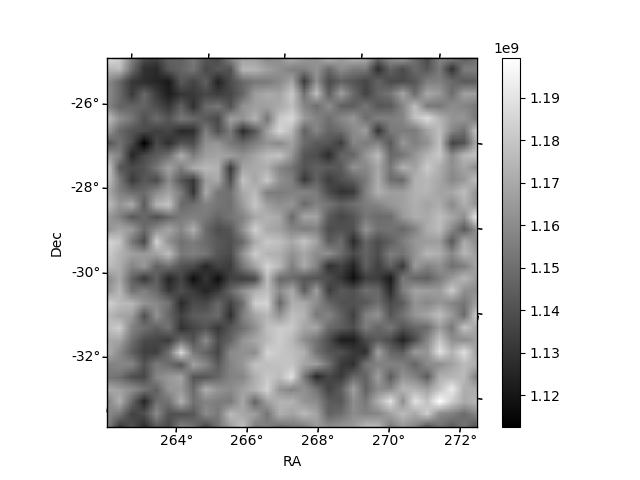
Histogram calculated using DETX and DETY for each event in the final _common_clean file
| Quadrant A | 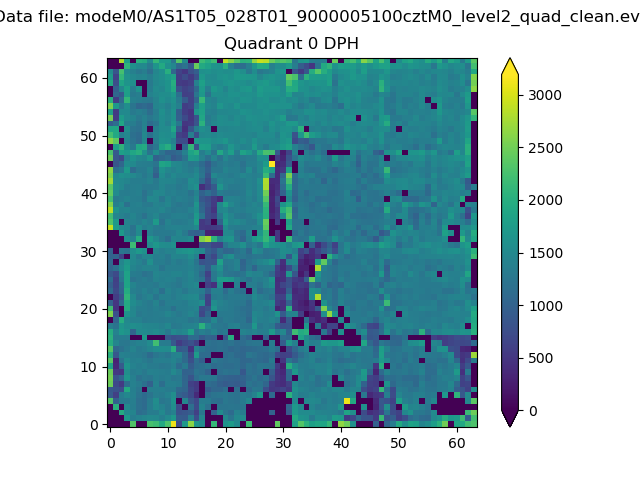 |
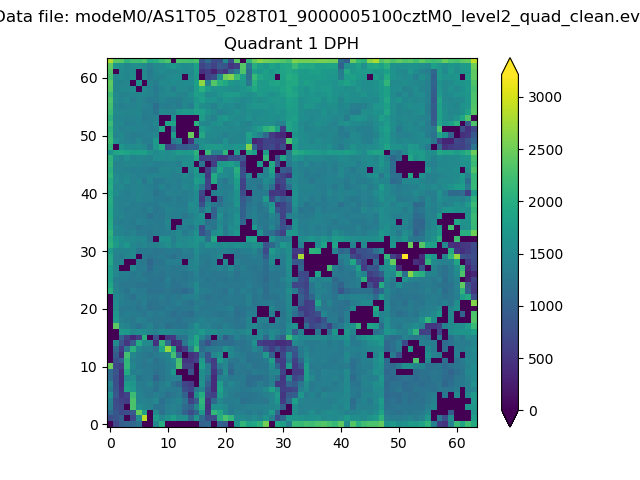 |
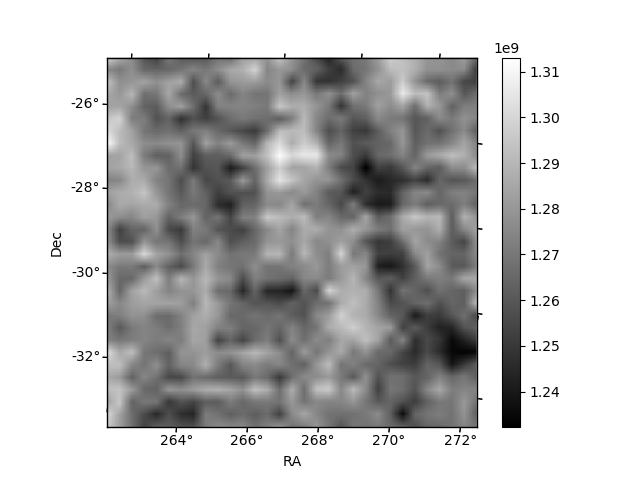
Quadrant B |
|---|---|---|---|
| Quadrant D | 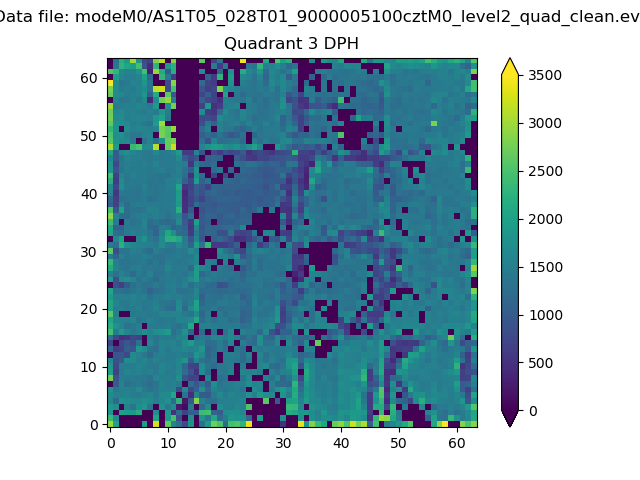 |
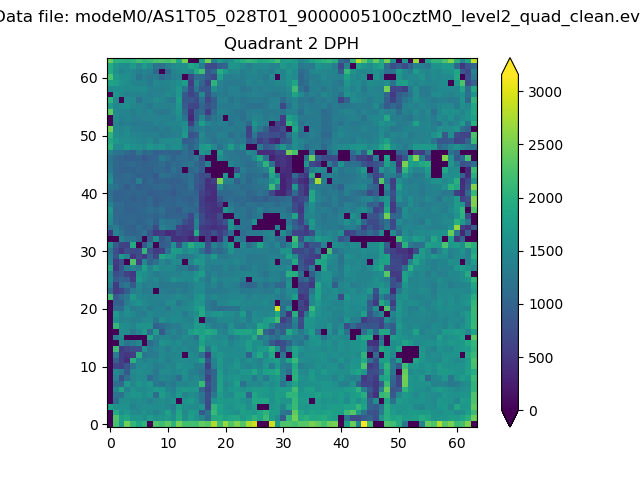 |
Quadrant C |
| Plot type | Count rate plots | Images |
|---|---|---|
| Comparison with Poisson distribution Blue bars denote a histogram of data divided into 1 sec bins. Red curve is a Poisson curve with rate = median count rate of data. |
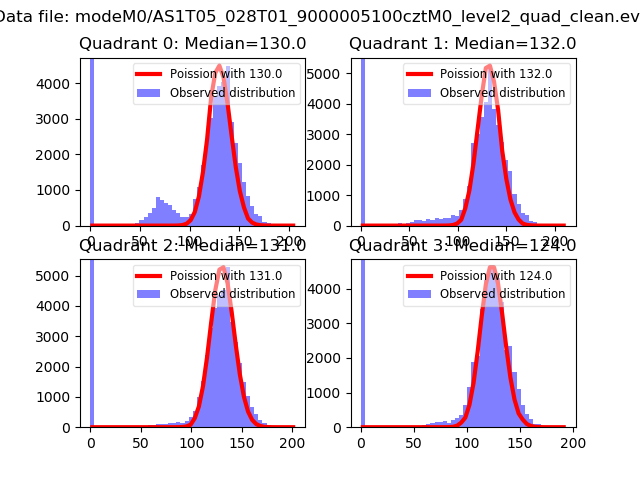 |
 |
| Quadrant-wise count rates Data is divided into 100 sec bins |
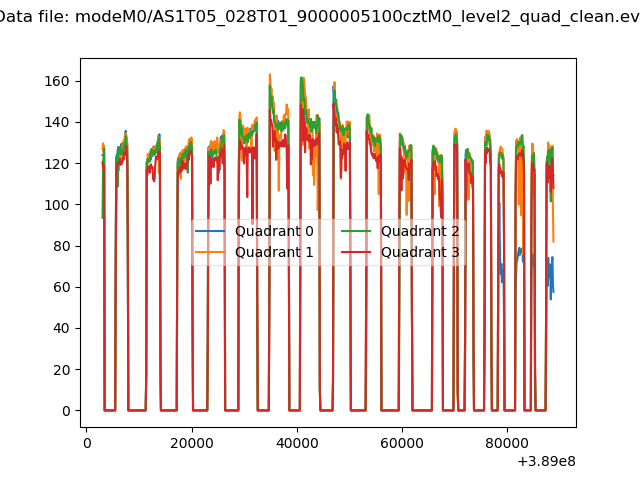 |
|
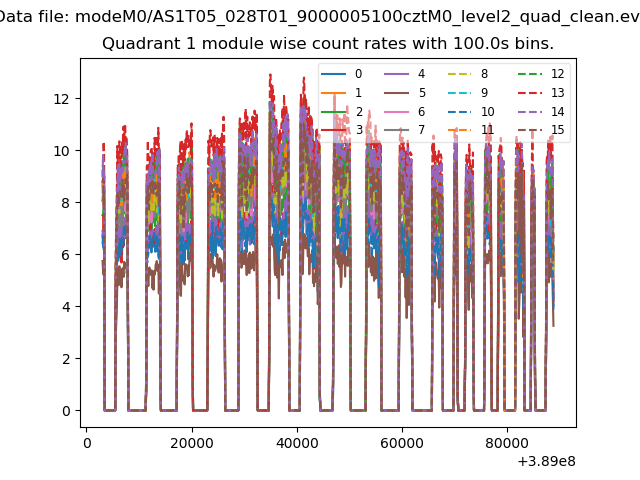
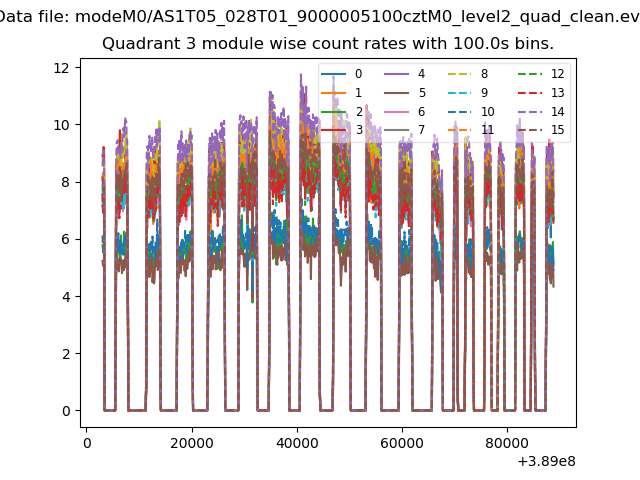
| Module-wise count rates for Quadrant A Data is divided into 100 sec bins |
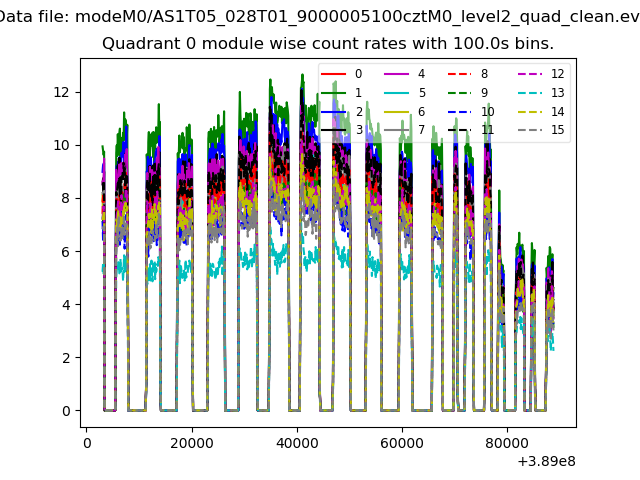 |
 |
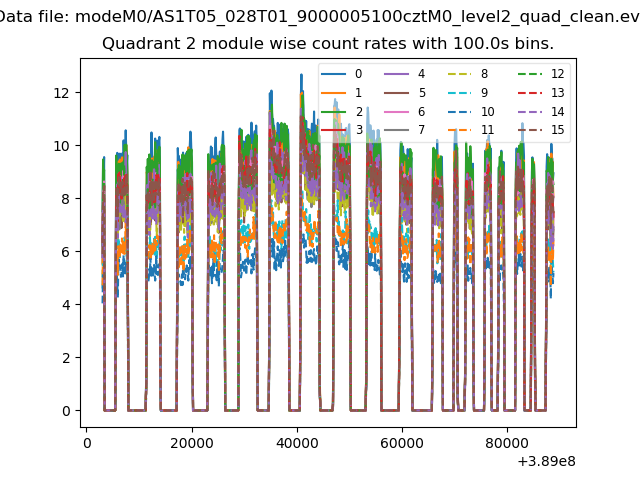
| Module-wise count rates for Quadrant B Data is divided into 100 sec bins |
 |
 |
| Module-wise count rates for Quadrant C Data is divided into 100 sec bins |
 |
 |
| Module-wise count rates for Quadrant D Data is divided into 100 sec bins |
 |
 |
| Parameter | Plot |
|---|---|
| CZT HV Monitor | 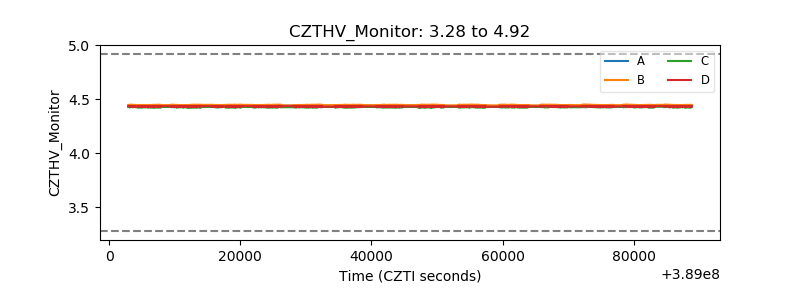 |
| D_VDD | 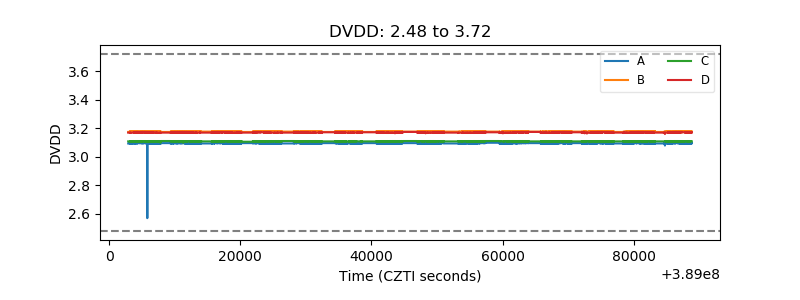 |
| Temperature 1 | 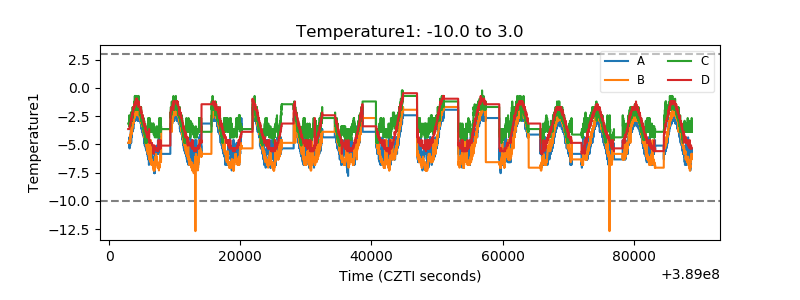 |
| Veto HV Monitor | 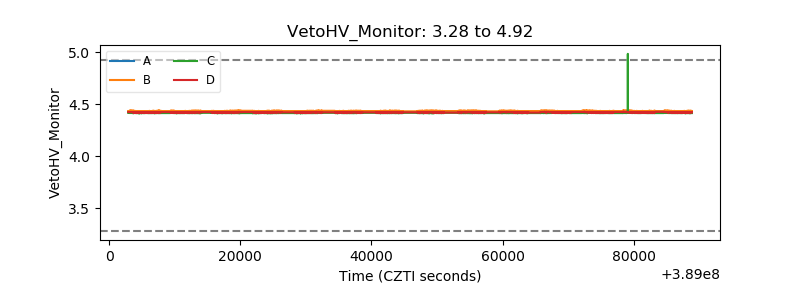 |
| Veto LLD | 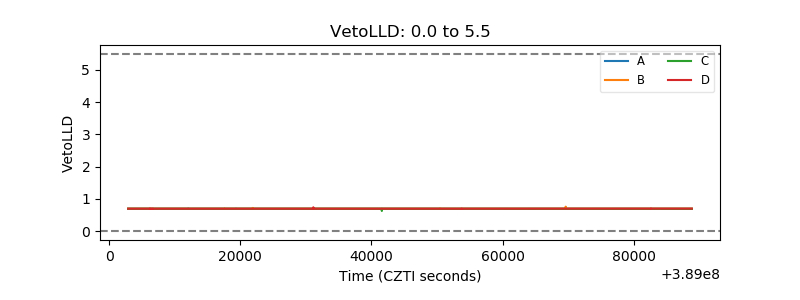 |
| Alpha Counter | 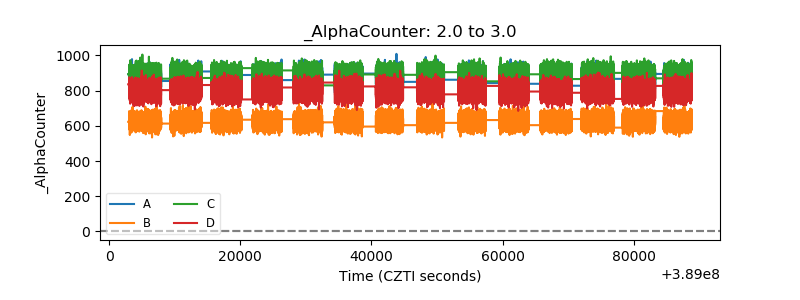 |
| _CPM_Rate | 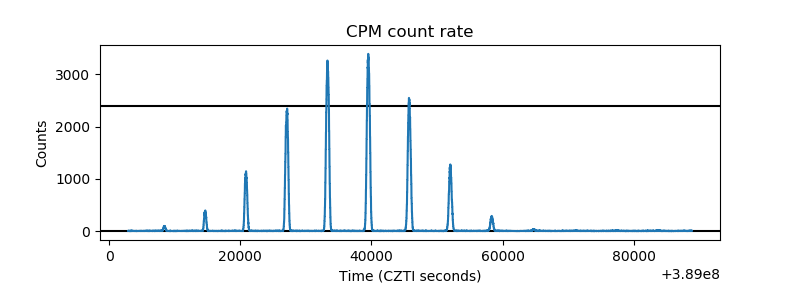 |
| CZT Counter | 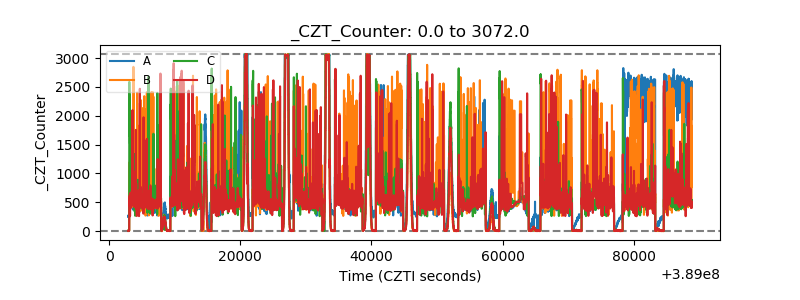 |
| +2.5 Volts monitor | 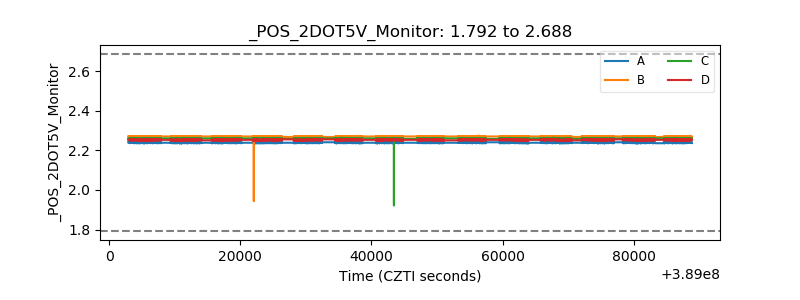 |
| +5 Volts monitor | 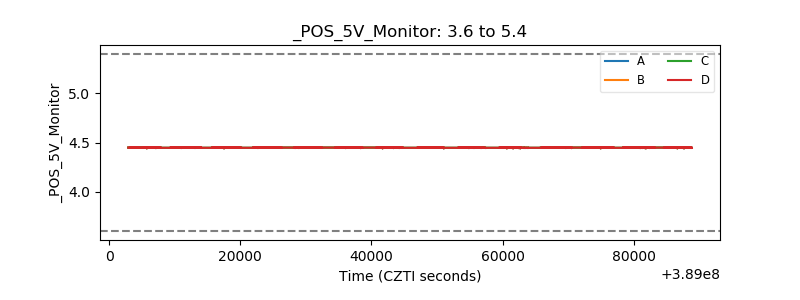 |
| _ROLL_ROT | 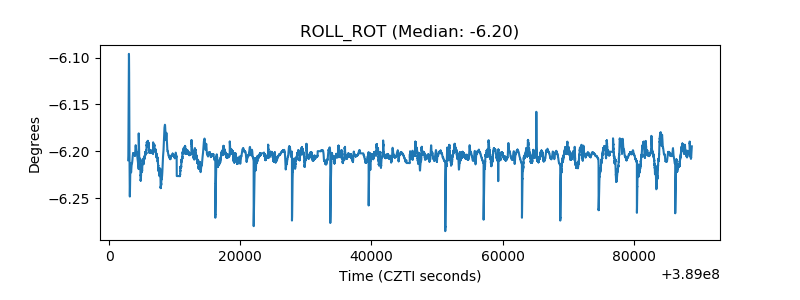 |
| _Roll_DEC | 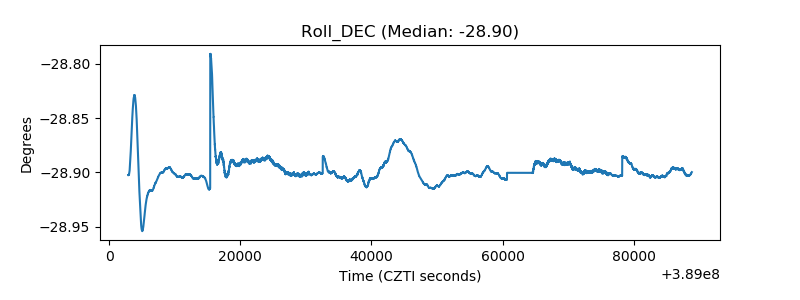 |
| _Roll_RA | 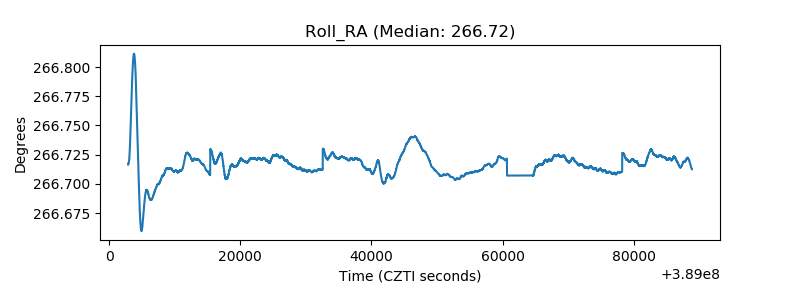 |
| Veto Counter | 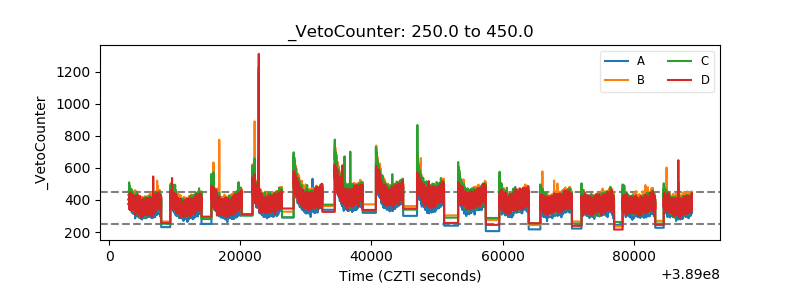 |