| Param | Original file | Final file |
|---|---|---|
| Filename | modeM0/AS1A10_065T04_9000005098_35603cztM0_level2.evt | modeM0/AS1A10_065T04_9000005098_35603cztM0_level2_quad_clean.evt |
| Size (bytes) | 1,365,356,160 | 230,394,240 |
| Size | 1.3 GB | 219.7 MB |
| Events in quadrant A | 7,708,420 | 1,515,618 |
| Events in quadrant B | 10,768,552 | 1,480,529 |
| Events in quadrant C | 9,478,809 | 1,495,014 |
| Events in quadrant D | 12,303,240 | 1,371,018 |
| Mode M9 | |||
|---|---|---|---|
| Quadrant | BADHDUFLAG | Total packets | Discarded packets |
| A | 0 | 55 | 0 |
| B | 0 | 55 | 0 |
| C | 0 | 55 | 0 |
| D | 0 | 55 | 0 |
| Mode M0 | |||
|---|---|---|---|
| Quadrant | BADHDUFLAG | Total packets | Discarded packets |
| A | 0 | 33049 | 5 |
| B | 0 | 42393 | 4 |
| C | 0 | 37775 | 4 |
| D | 0 | 47375 | 4 |
| Mode SS | |||
|---|---|---|---|
| Quadrant | BADHDUFLAG | Total packets | Discarded packets |
| A | 0 | 332 | 0 |
| B | 0 | 332 | 0 |
| C | 0 | 332 | 0 |
| D | 0 | 332 | 0 |
| Quadrant | Total seconds | Saturated seconds | Saturation percentage |
|---|---|---|---|
| A | 16170 | 26 | 0.160792% |
| B | 16170 | 841 | 5.200989% |
| C | 16170 | 239 | 1.478046% |
| D | 16170 | 1162 | 7.186147% |
Noise dominated data is calculated using 1-second bins in cleaned event files. If a bin has >2000 counts, and if more than 50% of those come from <1% of pixels, then it is considered to be noise-dominated and hence unusable.
| Quadrant | # 1 sec bins | Bins with >0 counts | Bins with >2000 counts | High rate bins dominated by noise | Noise dominated (total time) | Noise dominated (detector-on time) | Marked lightcurve |
|---|---|---|---|---|---|---|---|
| A | 21662 | 16174 | 1 | 1 | 0.00% | 0.01% | 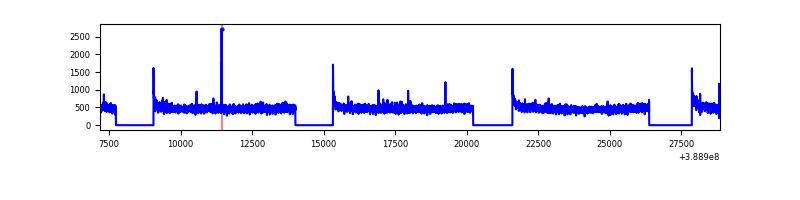 |
| B | 21662 | 16174 | 605 | 605 | 2.79% | 3.74% | 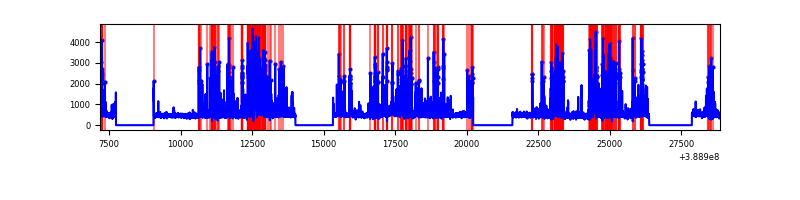 |
| C | 21662 | 16174 | 152 | 152 | 0.70% | 0.94% | 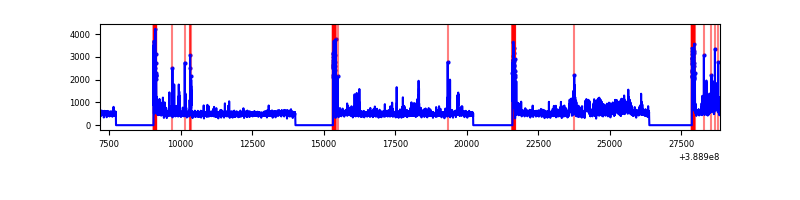 |
| D | 21662 | 16174 | 1007 | 1007 | 4.65% | 6.23% | 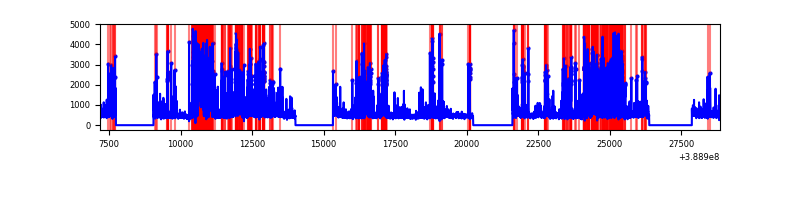 |
Top three noisy pixels from each quadrant. If the there are fewer than three noisy pixels in the level2.evt file, extra rows are filled as -1
| Pixel properties | Quadrant properties | ||||||
|---|---|---|---|---|---|---|---|
| Quadrant | DetID | PixID | Counts | Sigma | Mean | Median | Sigma |
| A | 10 | 83 | 344562 | 912.09 | 1870 | 1831 | 375.8 |
| A | 13 | 6 | 39591 | 100.49 | 1870 | 1831 | 375.8 |
| A | 15 | 169 | 33317 | 83.79 | 1870 | 1831 | 375.8 |
| B | 5 | 172 | 3376371 | 9649.53 | 1817 | 1766 | 349.7 |
| B | 15 | 85 | 72087 | 201.08 | 1817 | 1766 | 349.7 |
| B | 12 | 111 | 44378 | 121.85 | 1817 | 1766 | 349.7 |
| C | 0 | 10 | 951155 | 2248.76 | 1810 | 1820 | 422.2 |
| C | 0 | 207 | 740089 | 1748.79 | 1810 | 1820 | 422.2 |
| C | 15 | 214 | 661425 | 1562.45 | 1810 | 1820 | 422.2 |
| D | 7 | 80 | 2303591 | 5247.62 | 1773 | 1724 | 438.7 |
| D | 12 | 227 | 988442 | 2249.44 | 1773 | 1724 | 438.7 |
| D | 10 | 118 | 534074 | 1213.61 | 1773 | 1724 | 438.7 |
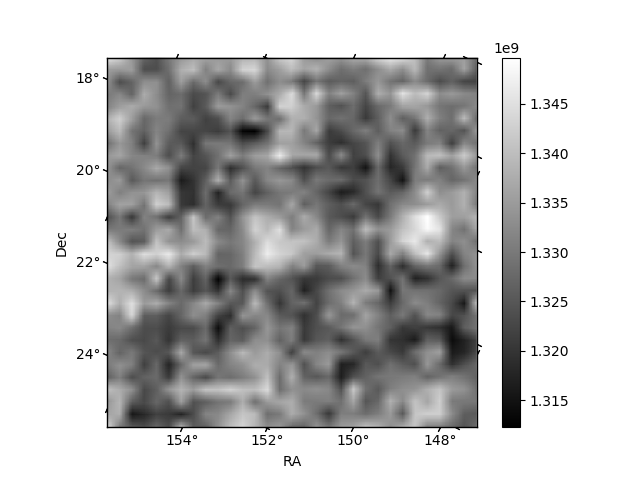
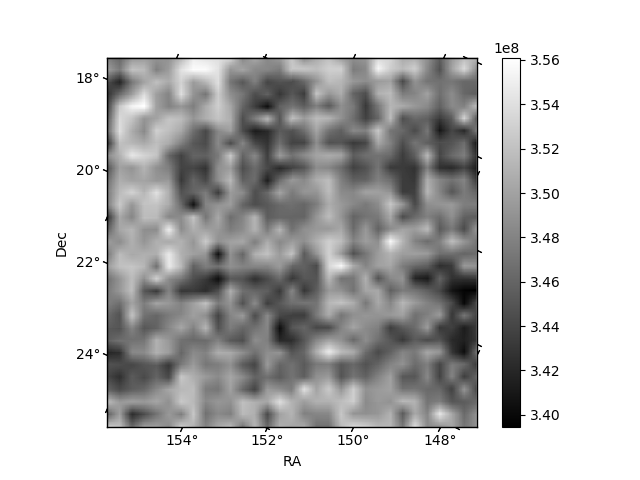
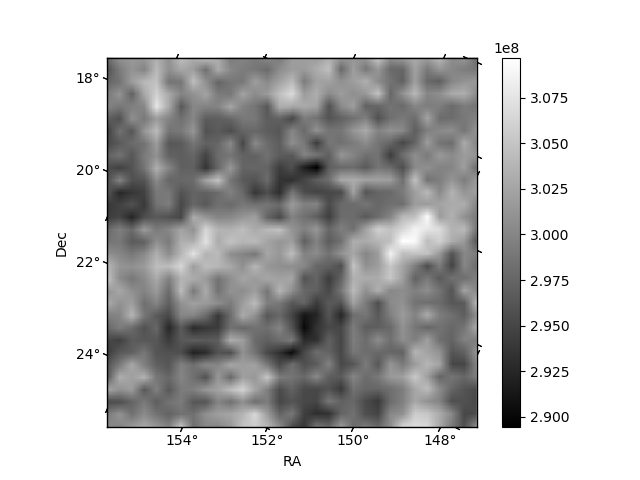
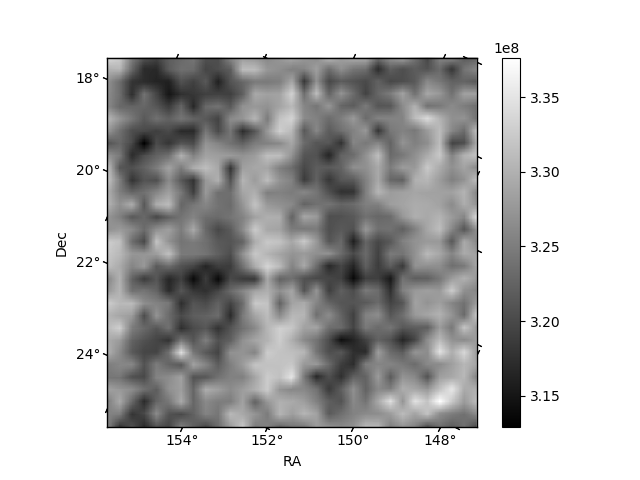
Histogram calculated using DETX and DETY for each event in the final _common_clean file
| Quadrant A | 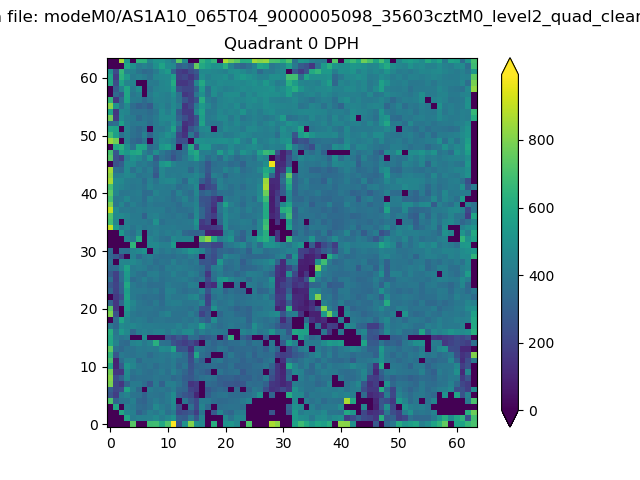 |
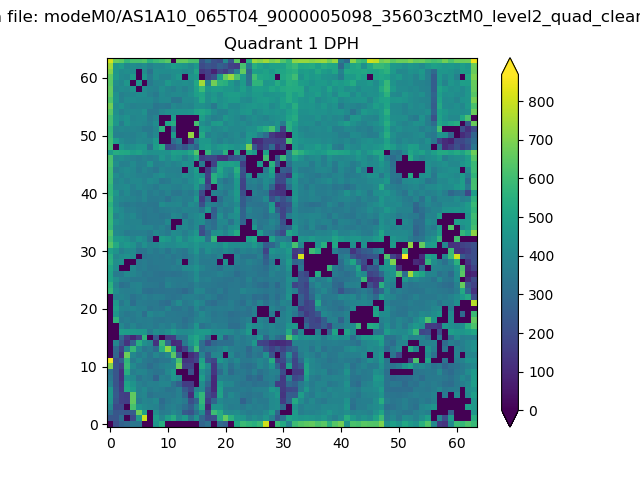 |
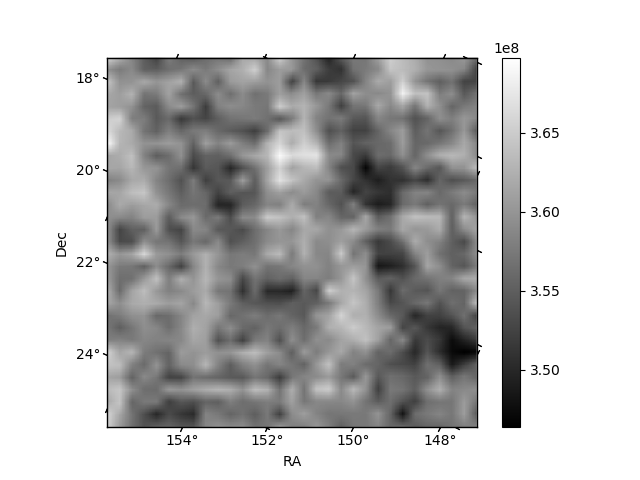
Quadrant B |
|---|---|---|---|
| Quadrant D | 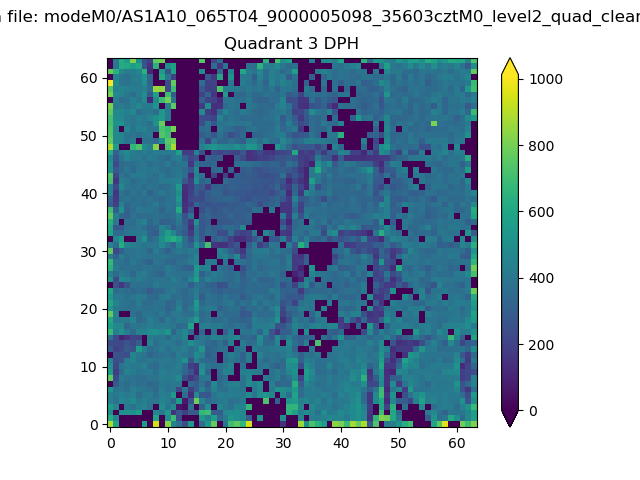 |
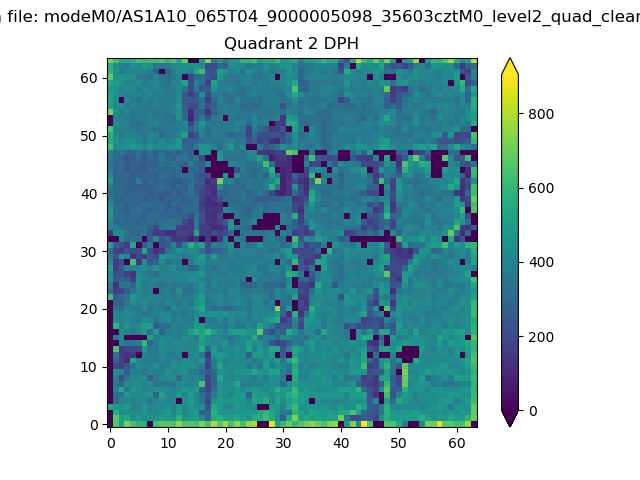 |
Quadrant C |
| Plot type | Count rate plots | Images |
|---|---|---|
| Comparison with Poisson distribution Blue bars denote a histogram of data divided into 1 sec bins. Red curve is a Poisson curve with rate = median count rate of data. |
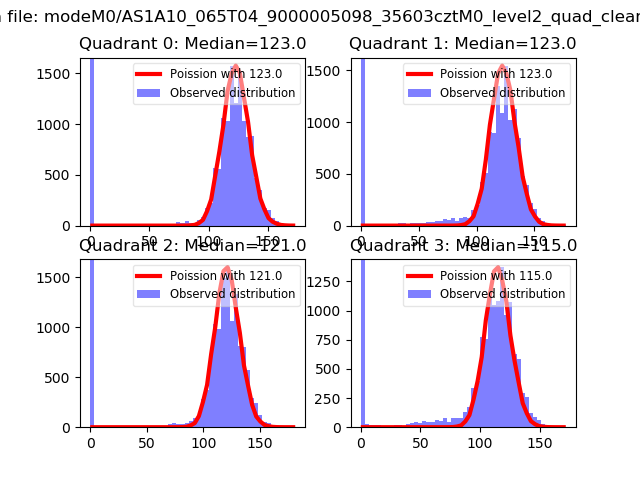 |
 |
| Quadrant-wise count rates Data is divided into 100 sec bins |
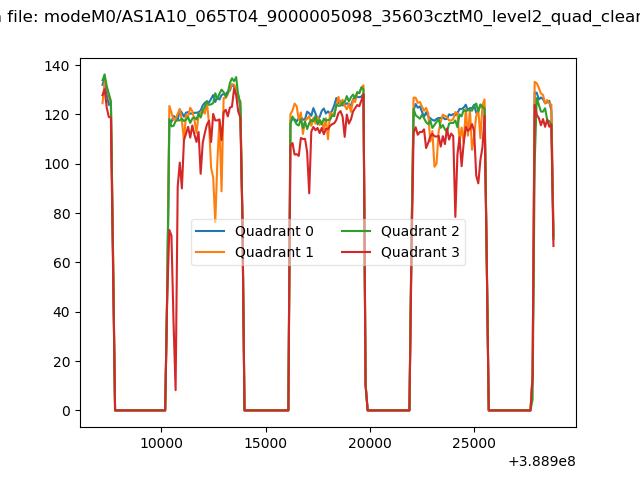 |
|
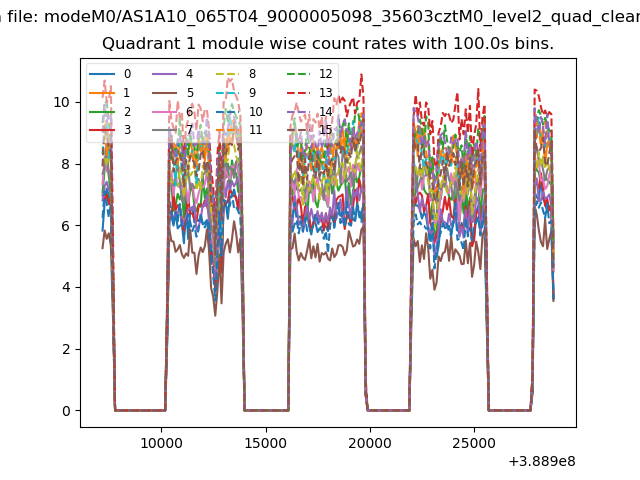
| Module-wise count rates for Quadrant A Data is divided into 100 sec bins |
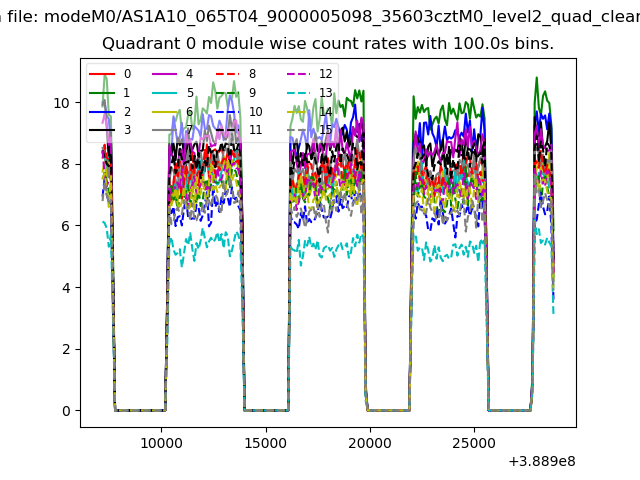 |
 |
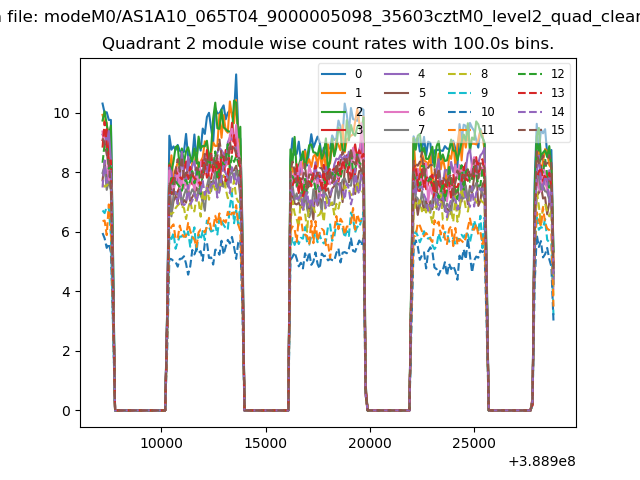
| Module-wise count rates for Quadrant B Data is divided into 100 sec bins |
 |
 |
| Module-wise count rates for Quadrant C Data is divided into 100 sec bins |
 |
 |
| Module-wise count rates for Quadrant D Data is divided into 100 sec bins |
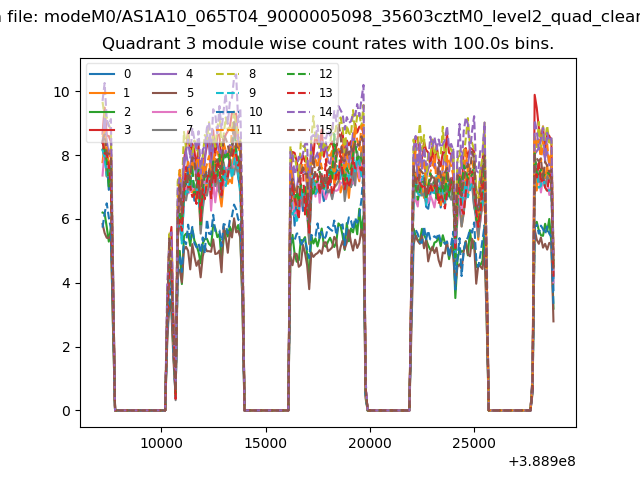 |
 |
| Parameter | Plot |
|---|---|
| CZT HV Monitor | 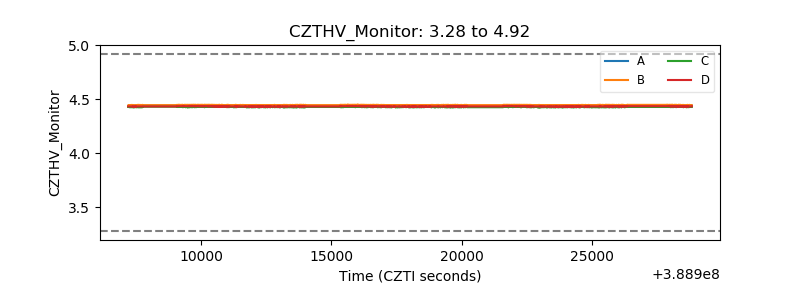 |
| D_VDD | 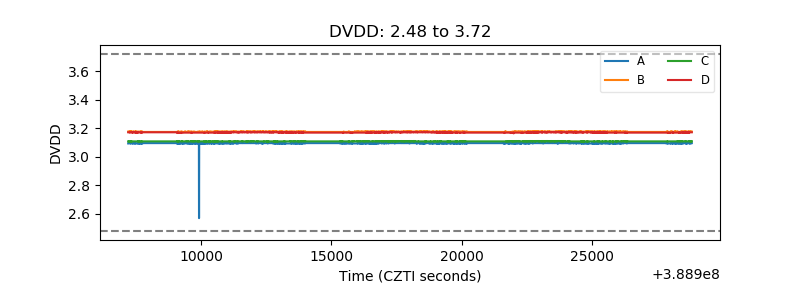 |
| Temperature 1 | 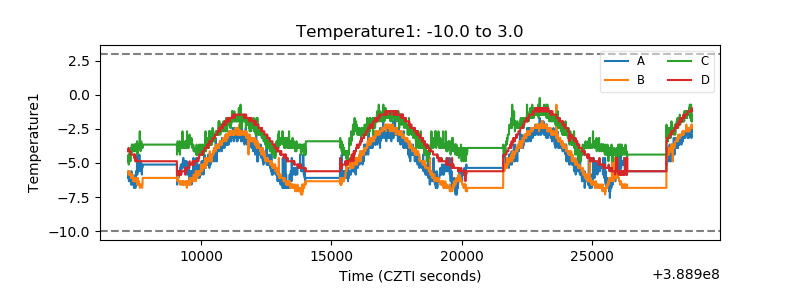 |
| Veto HV Monitor | 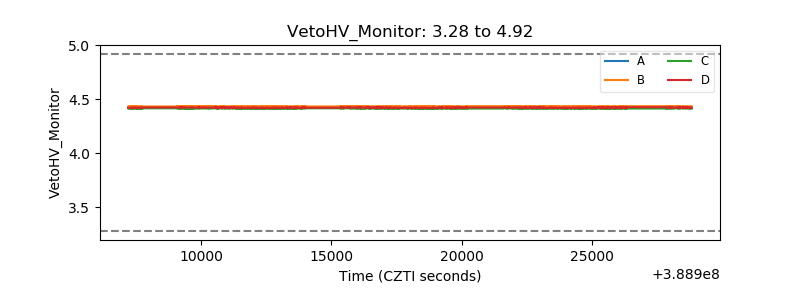 |
| Veto LLD | 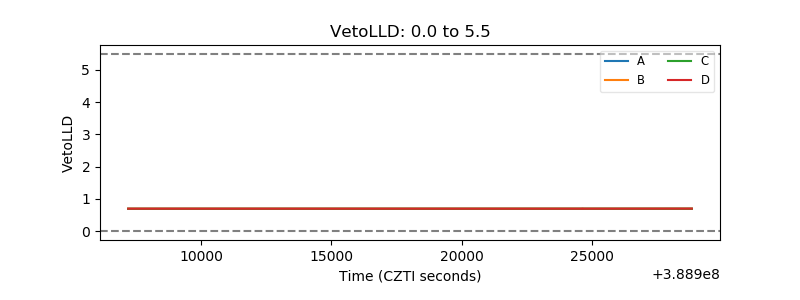 |
| Alpha Counter |  |
| _CPM_Rate | 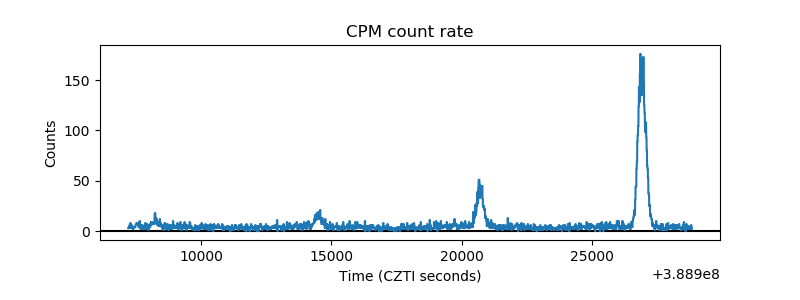 |
| CZT Counter | 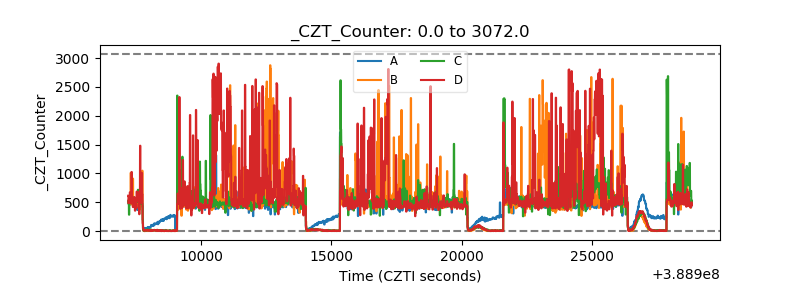 |
| +2.5 Volts monitor | 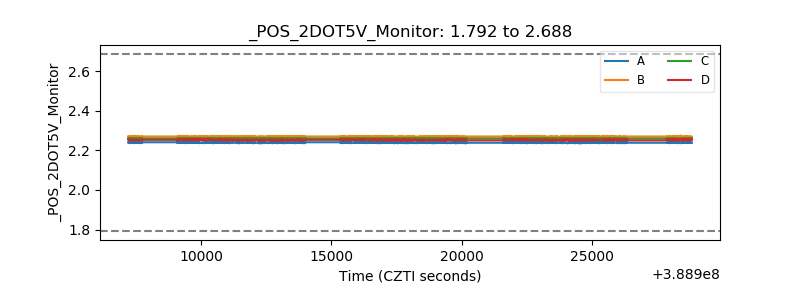 |
| +5 Volts monitor | 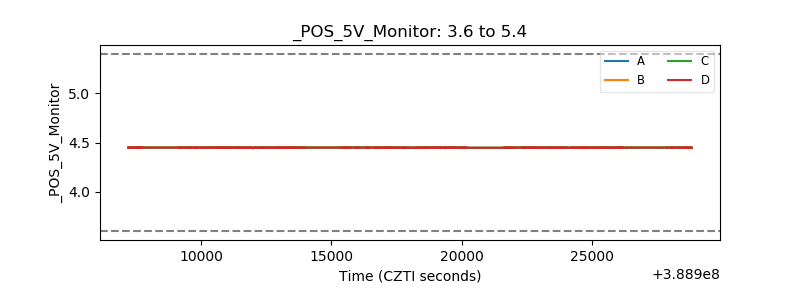 |
| _ROLL_ROT | 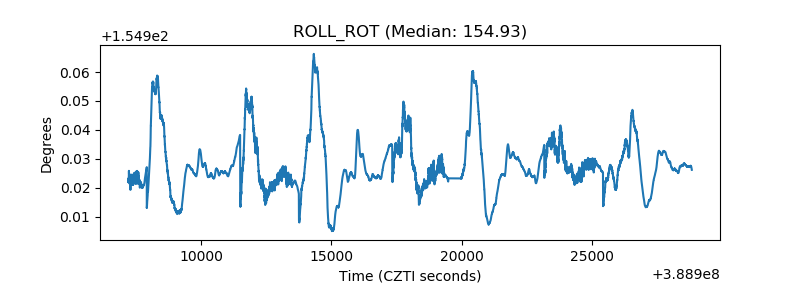 |
| _Roll_DEC | 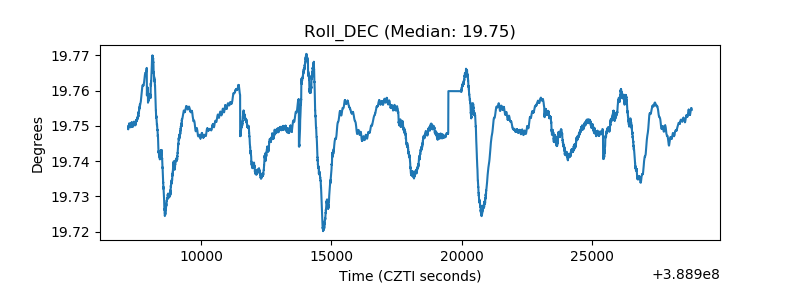 |
| _Roll_RA | 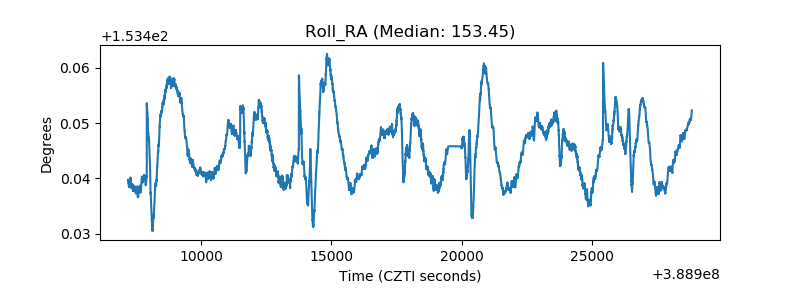 |
| Veto Counter | 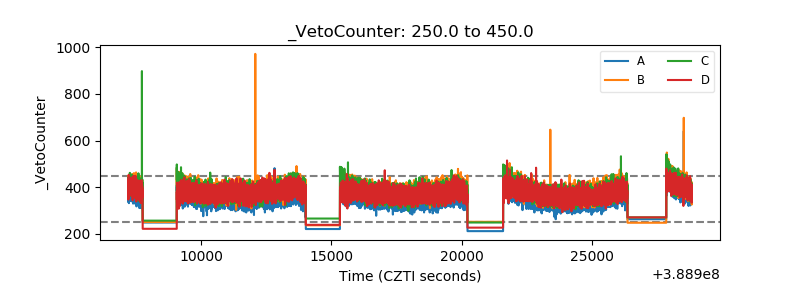 |