| Param | Original file | Final file |
|---|---|---|
| Filename | modeM0/AS1A10_065T04_9000005098_35596cztM0_level2.evt | modeM0/AS1A10_065T04_9000005098_35596cztM0_level2_quad_clean.evt |
| Size (bytes) | 418,766,400 | 55,846,080 |
| Size | 399.4 MB | 53.3 MB |
| Events in quadrant A | 2,596,363 | 354,627 |
| Events in quadrant B | 2,618,567 | 363,932 |
| Events in quadrant C | 3,132,292 | 334,391 |
| Events in quadrant D | 4,011,150 | 302,806 |
| Mode M9 | |||
|---|---|---|---|
| Quadrant | BADHDUFLAG | Total packets | Discarded packets |
| A | 0 | 32 | 0 |
| B | 0 | 32 | 0 |
| C | 0 | 32 | 0 |
| D | 0 | 33 | 0 |
| Mode M0 | |||
|---|---|---|---|
| Quadrant | BADHDUFLAG | Total packets | Discarded packets |
| A | 0 | 10672 | 3 |
| B | 0 | 10702 | 2 |
| C | 0 | 12178 | 2 |
| D | 0 | 15101 | 2 |
| Mode SS | |||
|---|---|---|---|
| Quadrant | BADHDUFLAG | Total packets | Discarded packets |
| A | 0 | 98 | 0 |
| B | 0 | 98 | 0 |
| C | 0 | 98 | 0 |
| D | 0 | 98 | 0 |
| Quadrant | Total seconds | Saturated seconds | Saturation percentage |
|---|---|---|---|
| A | 4764 | 67 | 1.406381% |
| B | 4764 | 92 | 1.931150% |
| C | 4764 | 217 | 4.554996% |
| D | 4764 | 538 | 11.293031% |
Noise dominated data is calculated using 1-second bins in cleaned event files. If a bin has >2000 counts, and if more than 50% of those come from <1% of pixels, then it is considered to be noise-dominated and hence unusable.
| Quadrant | # 1 sec bins | Bins with >0 counts | Bins with >2000 counts | High rate bins dominated by noise | Noise dominated (total time) | Noise dominated (detector-on time) | Marked lightcurve |
|---|---|---|---|---|---|---|---|
| A | 6916 | 4765 | 39 | 39 | 0.56% | 0.82% | 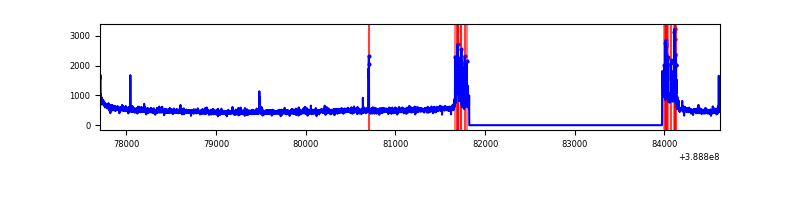 |
| B | 6916 | 4765 | 60 | 60 | 0.87% | 1.26% | 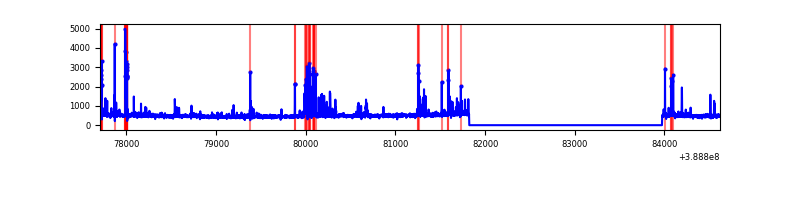 |
| C | 6916 | 4765 | 142 | 142 | 2.05% | 2.98% | 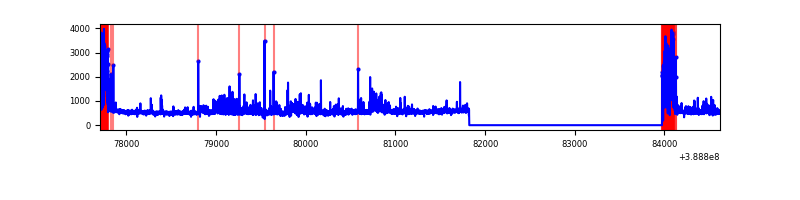 |
| D | 6916 | 4765 | 444 | 444 | 6.42% | 9.32% | 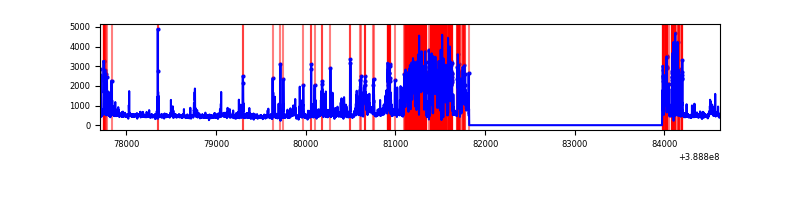 |
Top three noisy pixels from each quadrant. If the there are fewer than three noisy pixels in the level2.evt file, extra rows are filled as -1
| Pixel properties | Quadrant properties | ||||||
|---|---|---|---|---|---|---|---|
| Quadrant | DetID | PixID | Counts | Sigma | Mean | Median | Sigma |
| A | 15 | 169 | 246441 | 2136.46 | 572 | 561 | 115.1 |
| A | 10 | 83 | 125671 | 1087.08 | 572 | 561 | 115.1 |
| A | 7 | 16 | 5703 | 44.68 | 572 | 561 | 115.1 |
| B | 5 | 172 | 269550 | 2462.16 | 572 | 559 | 109.3 |
| B | 5 | 200 | 62760 | 569.35 | 572 | 559 | 109.3 |
| B | 4 | 81 | 18699 | 166.04 | 572 | 559 | 109.3 |
| C | 0 | 10 | 543967 | 4301.65 | 543 | 547 | 126.3 |
| C | 9 | 187 | 261760 | 2067.73 | 543 | 547 | 126.3 |
| C | 15 | 214 | 193073 | 1524.01 | 543 | 547 | 126.3 |
| D | 7 | 80 | 1672849 | 12918.22 | 523 | 509 | 129.5 |
| D | 2 | 250 | 60634 | 464.44 | 523 | 509 | 129.5 |
| D | 10 | 118 | 49967 | 382.05 | 523 | 509 | 129.5 |
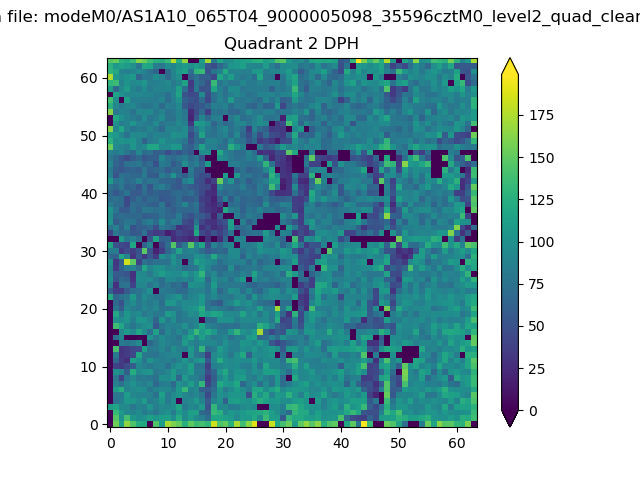
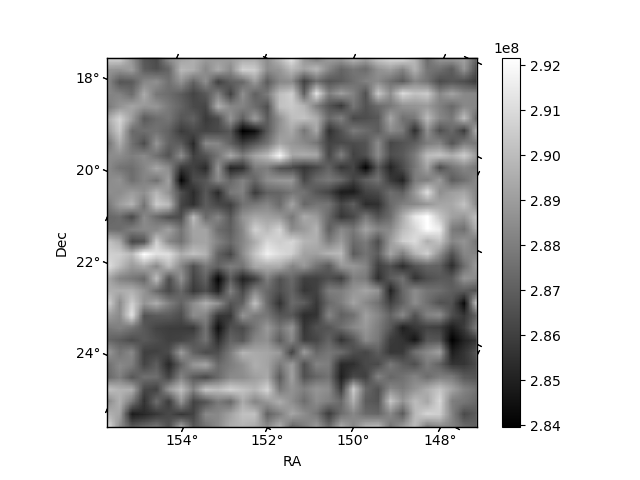
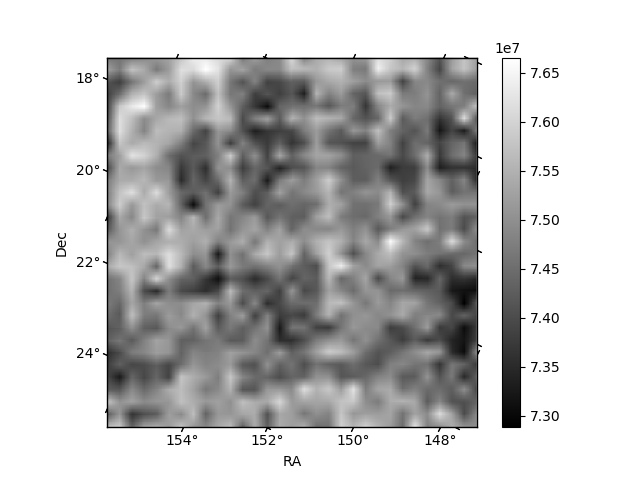
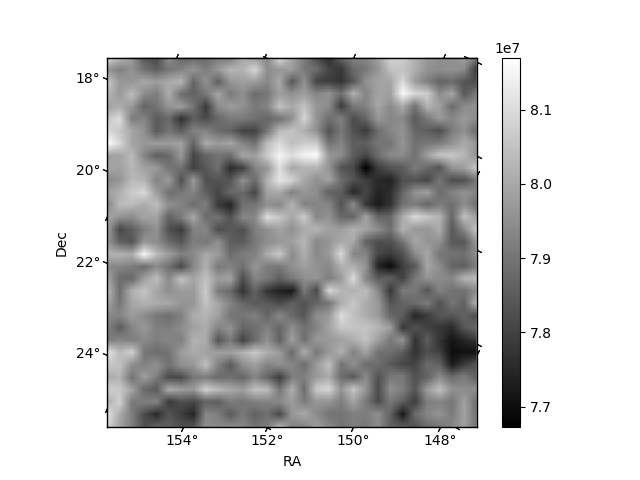
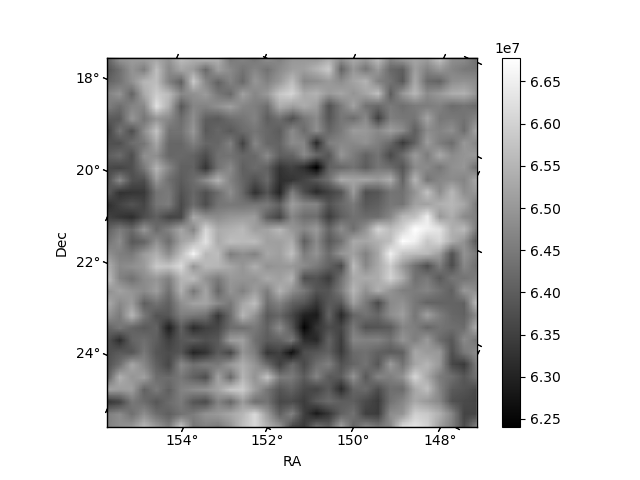
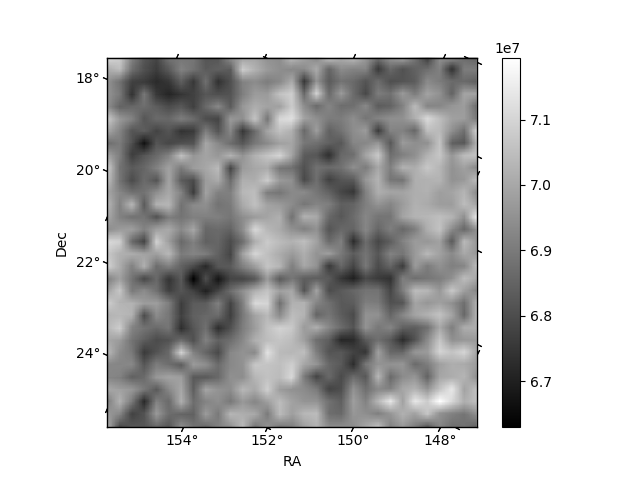
Histogram calculated using DETX and DETY for each event in the final _common_clean file
| Quadrant A | 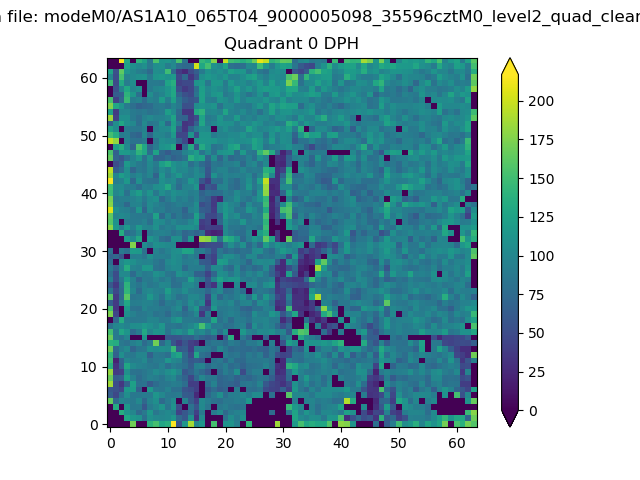 |
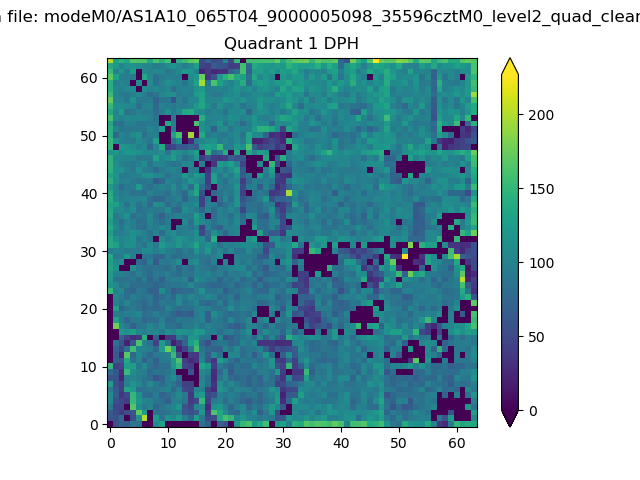 |
Quadrant B |
|---|---|---|---|
| Quadrant D | 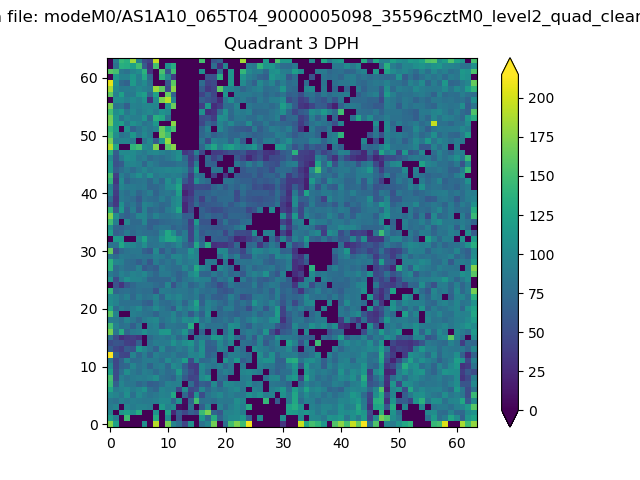 |
 |
Quadrant C |
| Plot type | Count rate plots | Images |
|---|---|---|
| Comparison with Poisson distribution Blue bars denote a histogram of data divided into 1 sec bins. Red curve is a Poisson curve with rate = median count rate of data. |
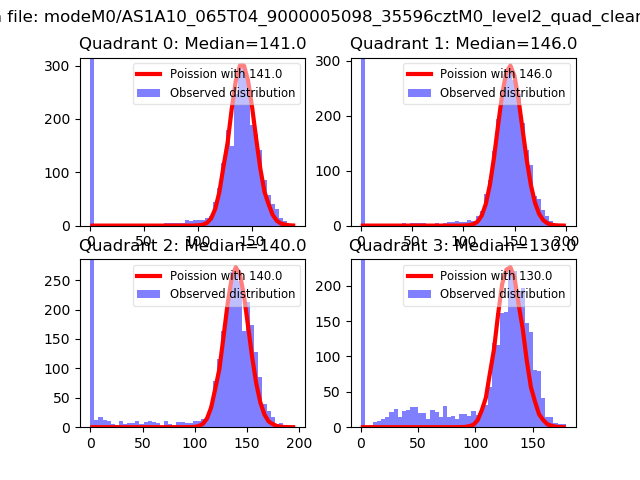 |
 |
| Quadrant-wise count rates Data is divided into 100 sec bins |
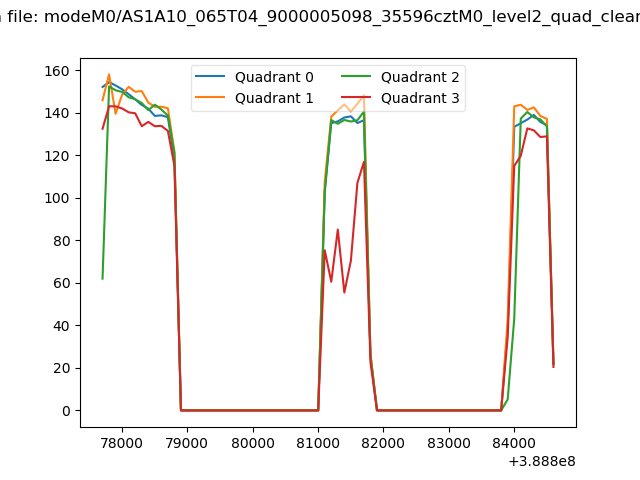 |
|
| Module-wise count rates for Quadrant A Data is divided into 100 sec bins |
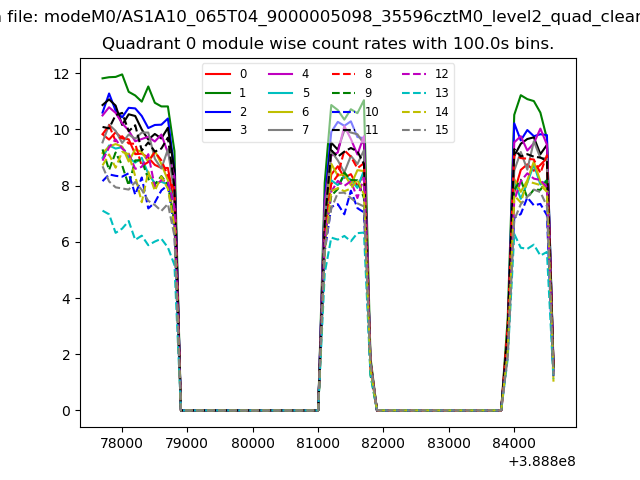 |
 |
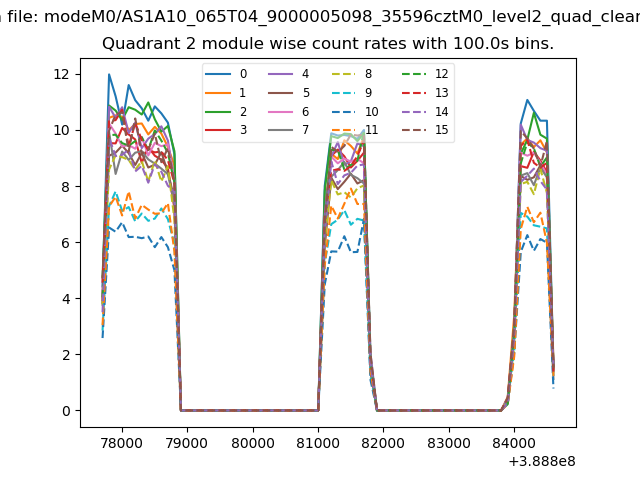
| Module-wise count rates for Quadrant B Data is divided into 100 sec bins |
 |
 |
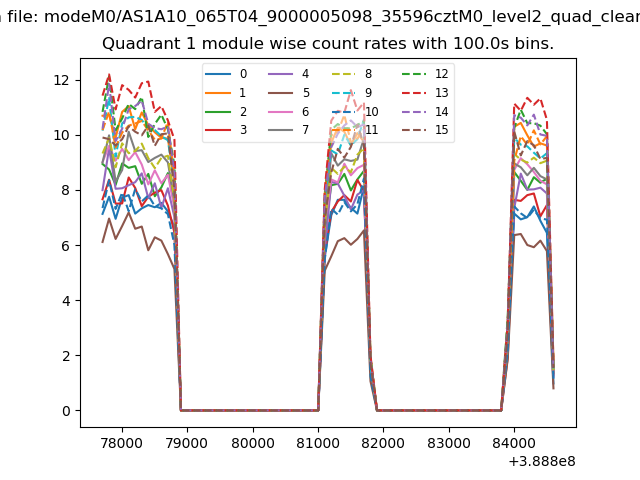
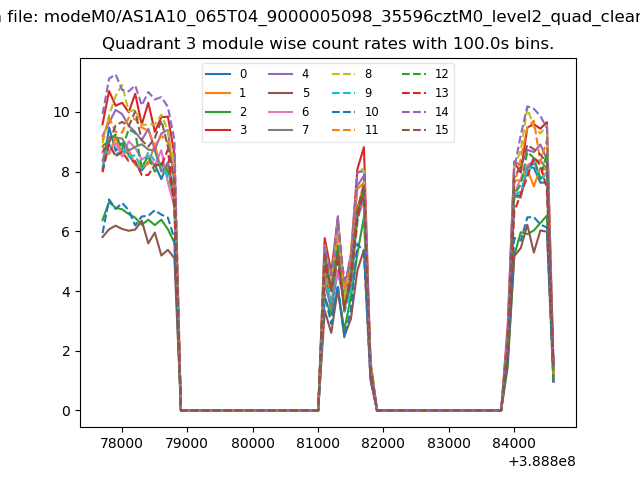
| Module-wise count rates for Quadrant C Data is divided into 100 sec bins |
 |
 |
| Module-wise count rates for Quadrant D Data is divided into 100 sec bins |
 |
 |
| Parameter | Plot |
|---|---|
| CZT HV Monitor | 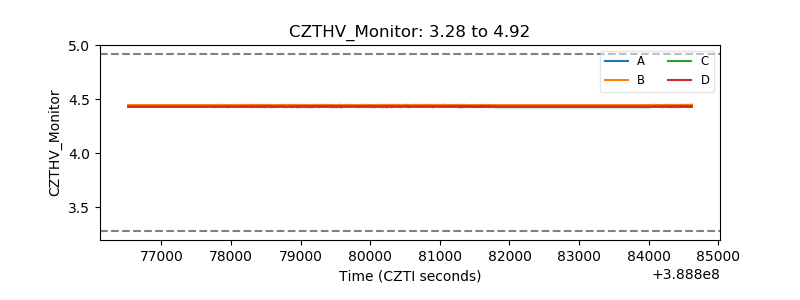 |
| D_VDD | 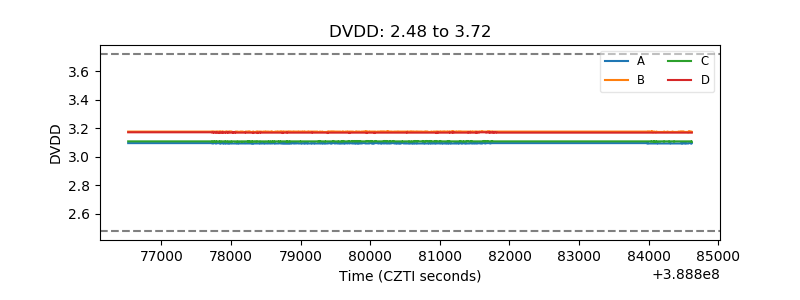 |
| Temperature 1 | 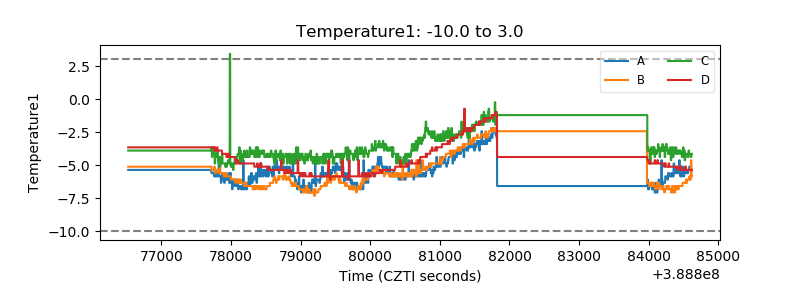 |
| Veto HV Monitor | 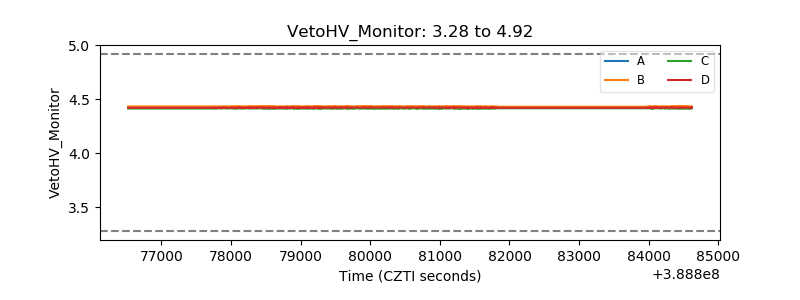 |
| Veto LLD | 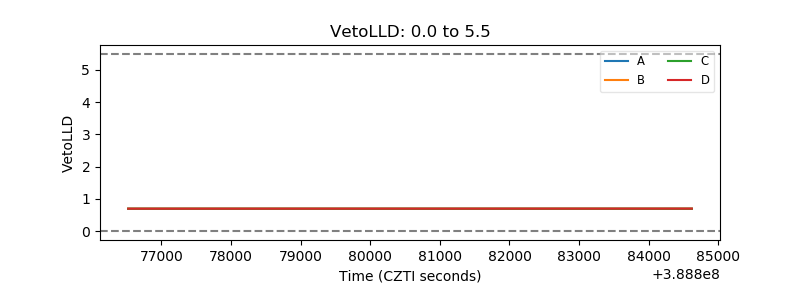 |
| Alpha Counter | 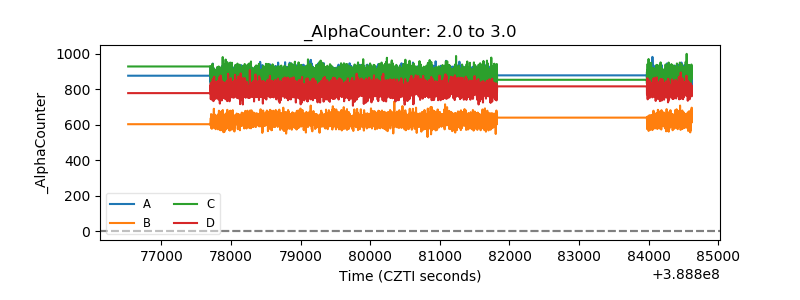 |
| _CPM_Rate | 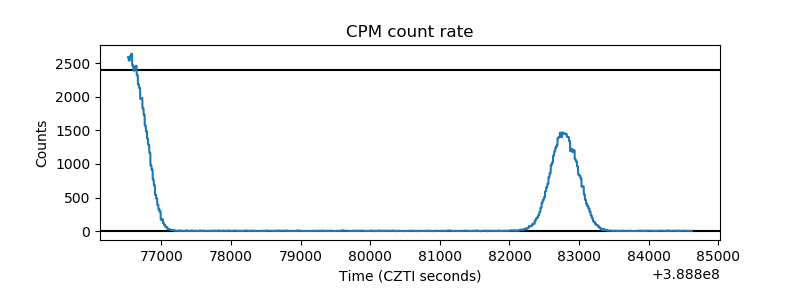 |
| CZT Counter | 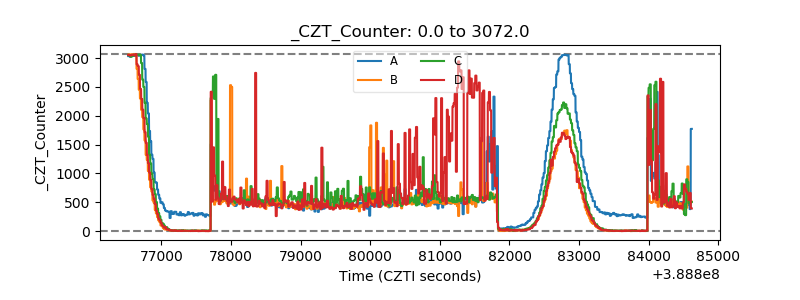 |
| +2.5 Volts monitor | 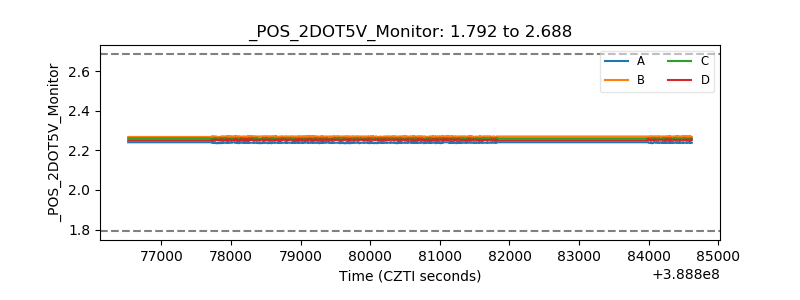 |
| +5 Volts monitor | 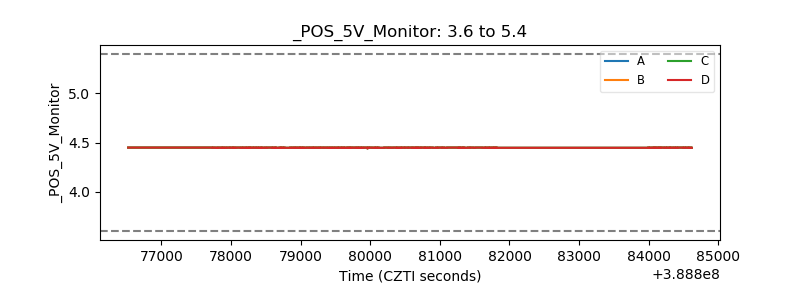 |
| _ROLL_ROT | 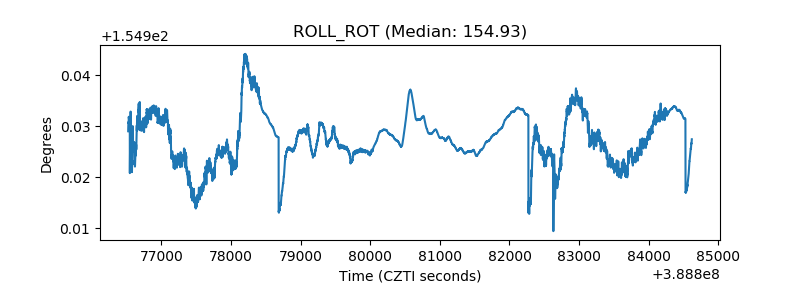 |
| _Roll_DEC | 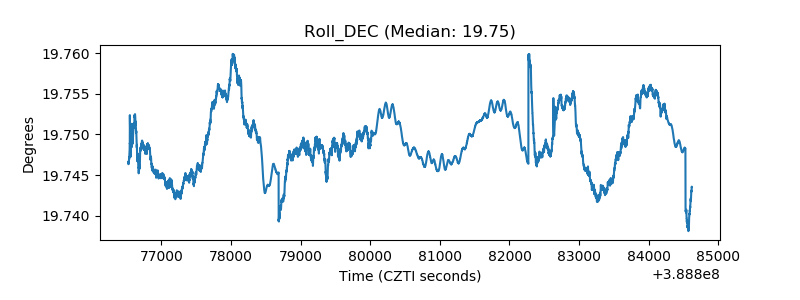 |
| _Roll_RA | 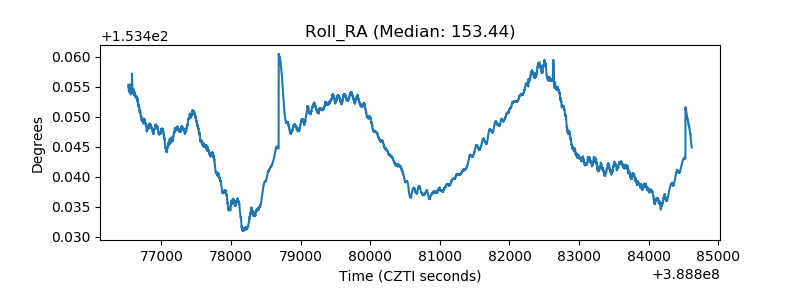 |
| Veto Counter | 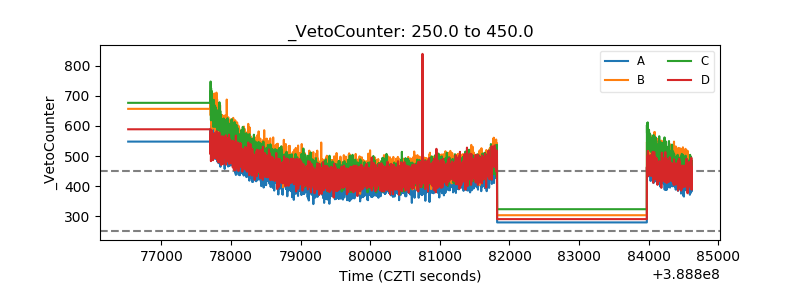 |