| Param | Original file | Final file |
|---|---|---|
| Filename | modeM0/AS1A10_065T04_9000005098_35594cztM0_level2.evt | modeM0/AS1A10_065T04_9000005098_35594cztM0_level2_quad_clean.evt |
| Size (bytes) | 513,760,320 | 58,207,680 |
| Size | 490.0 MB | 55.5 MB |
| Events in quadrant A | 4,455,106 | 331,890 |
| Events in quadrant B | 3,066,156 | 391,811 |
| Events in quadrant C | 3,302,076 | 368,405 |
| Events in quadrant D | 4,403,996 | 325,977 |
| Mode M9 | |||
|---|---|---|---|
| Quadrant | BADHDUFLAG | Total packets | Discarded packets |
| A | 0 | 24 | 0 |
| B | 0 | 24 | 0 |
| C | 0 | 24 | 0 |
| D | 0 | 25 | 0 |
| Mode M0 | |||
|---|---|---|---|
| Quadrant | BADHDUFLAG | Total packets | Discarded packets |
| A | 0 | 16414 | 3 |
| B | 0 | 12130 | 2 |
| C | 0 | 12790 | 2 |
| D | 0 | 16289 | 2 |
| Mode SS | |||
|---|---|---|---|
| Quadrant | BADHDUFLAG | Total packets | Discarded packets |
| A | 0 | 98 | 0 |
| B | 0 | 98 | 0 |
| C | 0 | 98 | 0 |
| D | 0 | 98 | 0 |
| Quadrant | Total seconds | Saturated seconds | Saturation percentage |
|---|---|---|---|
| A | 4902 | 731 | 14.912281% |
| B | 4902 | 203 | 4.141167% |
| C | 4902 | 236 | 4.814361% |
| D | 4902 | 579 | 11.811506% |
Noise dominated data is calculated using 1-second bins in cleaned event files. If a bin has >2000 counts, and if more than 50% of those come from <1% of pixels, then it is considered to be noise-dominated and hence unusable.
| Quadrant | # 1 sec bins | Bins with >0 counts | Bins with >2000 counts | High rate bins dominated by noise | Noise dominated (total time) | Noise dominated (detector-on time) | Marked lightcurve |
|---|---|---|---|---|---|---|---|
| A | 6934 | 4903 | 652 | 652 | 9.40% | 13.30% | 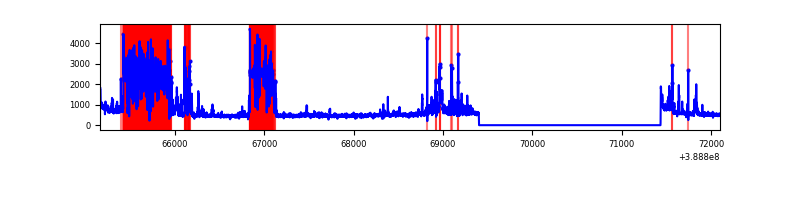 |
| B | 6934 | 4903 | 152 | 152 | 2.19% | 3.10% | 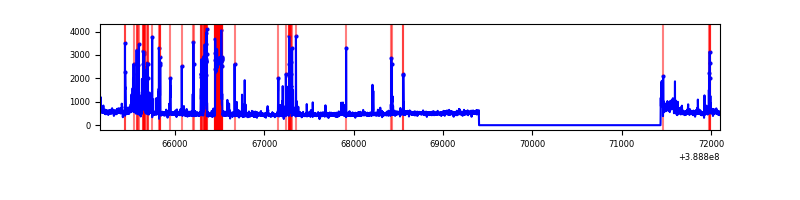 |
| C | 6934 | 4903 | 163 | 163 | 2.35% | 3.32% | 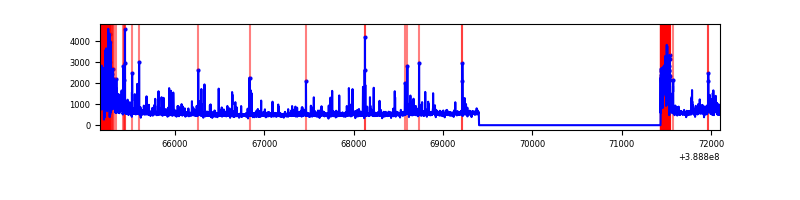 |
| D | 6934 | 4903 | 498 | 498 | 7.18% | 10.16% | 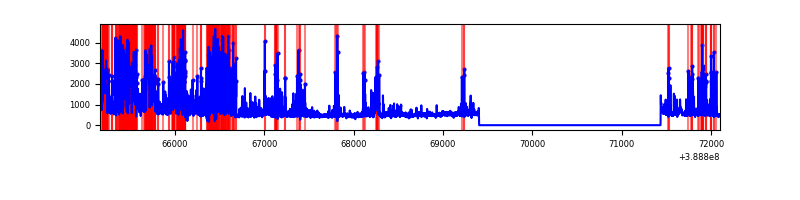 |
Top three noisy pixels from each quadrant. If the there are fewer than three noisy pixels in the level2.evt file, extra rows are filled as -1
| Pixel properties | Quadrant properties | ||||||
|---|---|---|---|---|---|---|---|
| Quadrant | DetID | PixID | Counts | Sigma | Mean | Median | Sigma |
| A | 15 | 169 | 2184320 | 19674.69 | 550 | 539 | 111.0 |
| A | 10 | 83 | 129713 | 1163.79 | 550 | 539 | 111.0 |
| A | 13 | 6 | 8760 | 74.07 | 550 | 539 | 111.0 |
| B | 5 | 172 | 428276 | 3828.78 | 588 | 572 | 111.7 |
| B | 0 | 182 | 221027 | 1973.5 | 588 | 572 | 111.7 |
| B | 0 | 190 | 32681 | 287.44 | 588 | 572 | 111.7 |
| C | 0 | 10 | 803935 | 6098.03 | 567 | 572 | 131.7 |
| C | 15 | 214 | 198991 | 1506.13 | 567 | 572 | 131.7 |
| C | 15 | 159 | 64676 | 486.59 | 567 | 572 | 131.7 |
| D | 7 | 80 | 1561059 | 11794.84 | 543 | 529 | 132.3 |
| D | 10 | 118 | 160566 | 1209.6 | 543 | 529 | 132.3 |
| D | 1 | 52 | 155089 | 1168.2 | 543 | 529 | 132.3 |
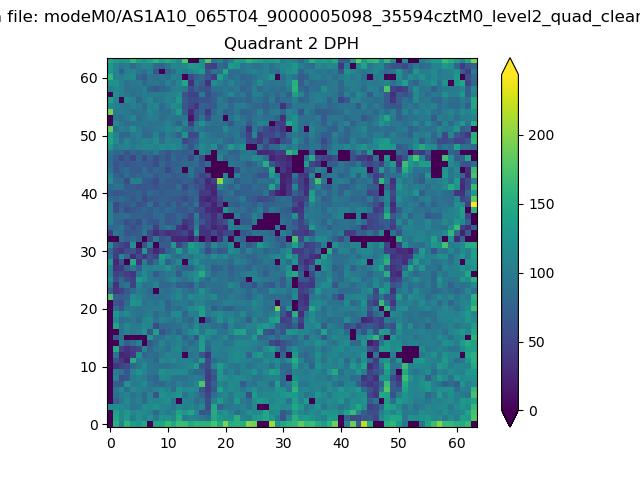
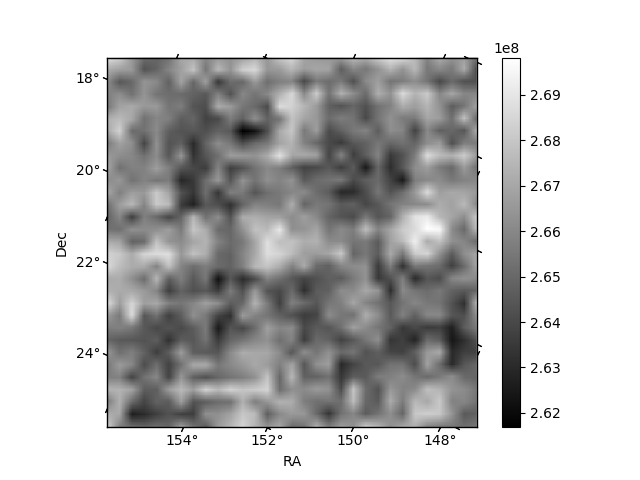
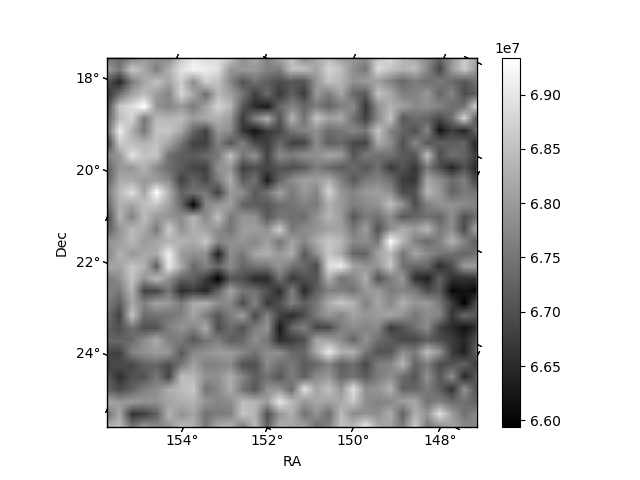
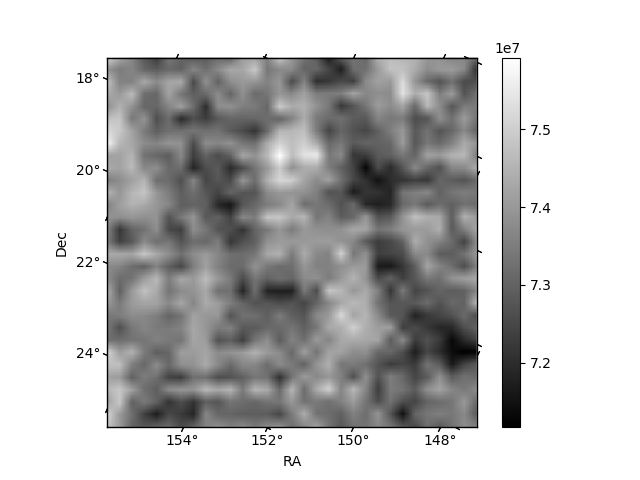
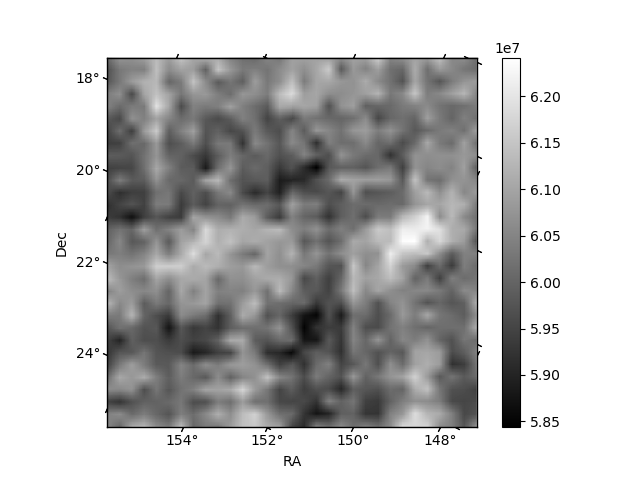
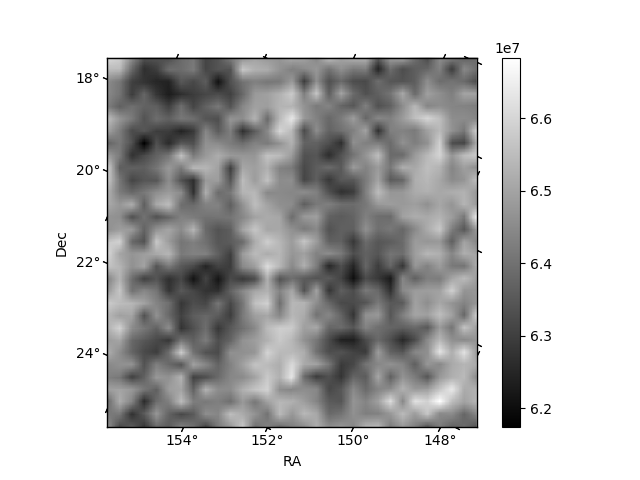
Histogram calculated using DETX and DETY for each event in the final _common_clean file
| Quadrant A | 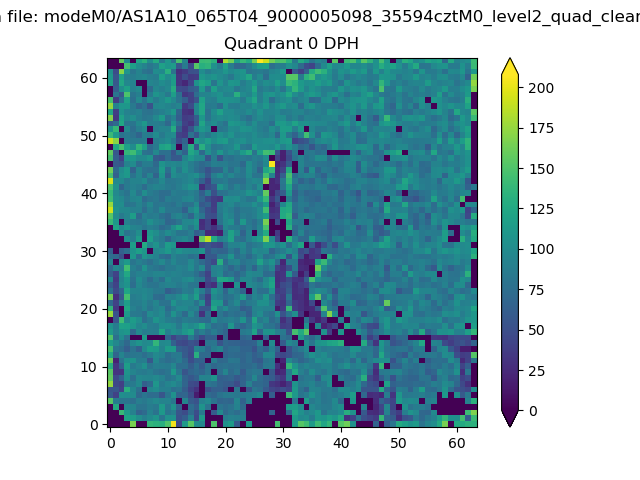 |
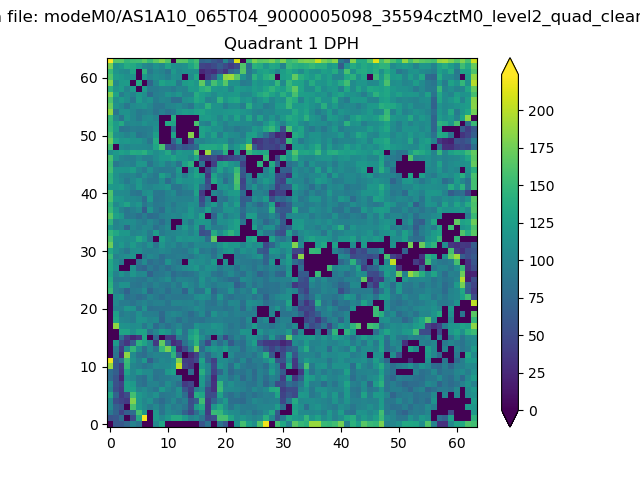 |
Quadrant B |
|---|---|---|---|
| Quadrant D | 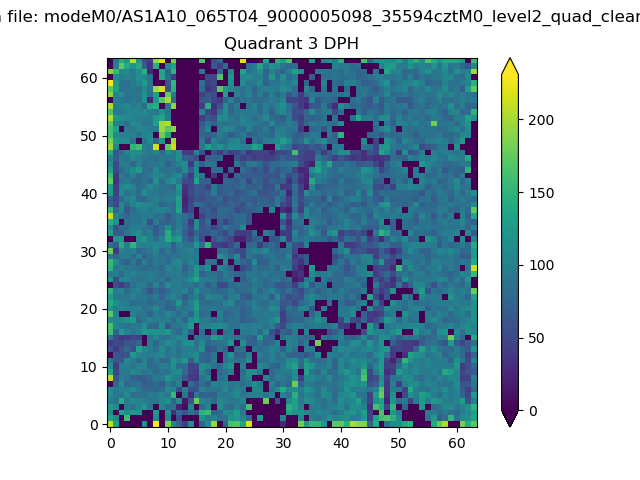 |
 |
Quadrant C |
| Plot type | Count rate plots | Images |
|---|---|---|
| Comparison with Poisson distribution Blue bars denote a histogram of data divided into 1 sec bins. Red curve is a Poisson curve with rate = median count rate of data. |
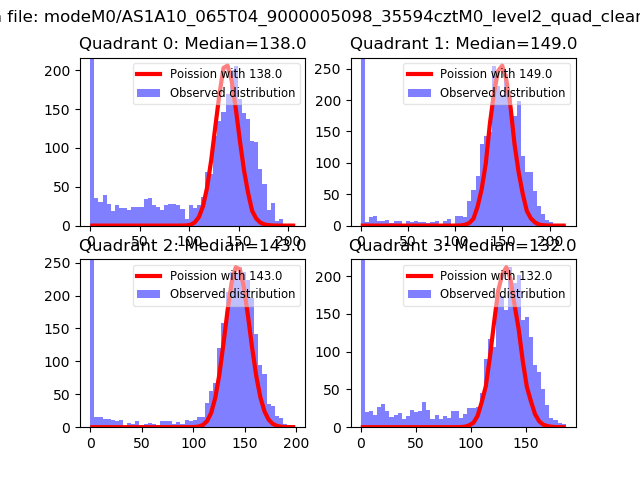 |
 |
| Quadrant-wise count rates Data is divided into 100 sec bins |
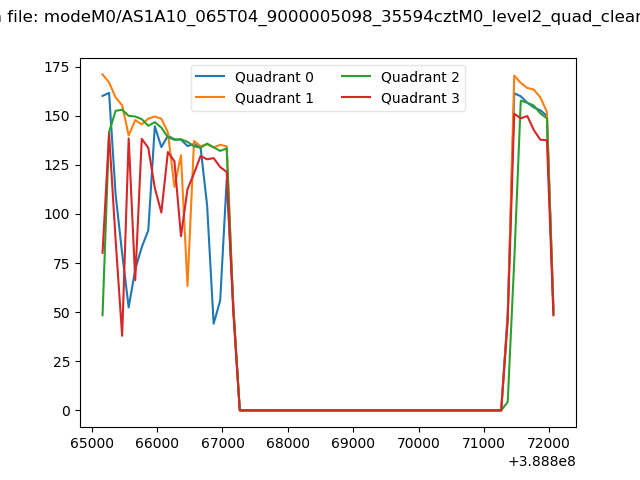 |
|
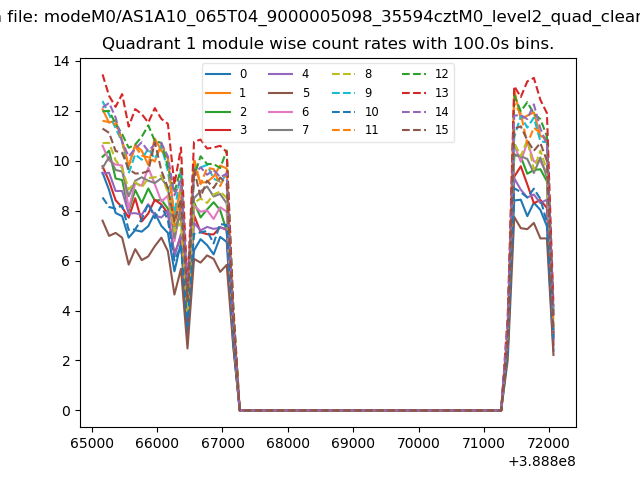
| Module-wise count rates for Quadrant A Data is divided into 100 sec bins |
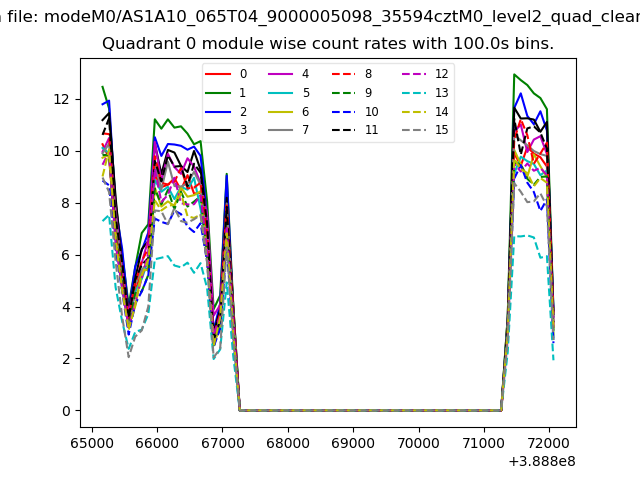 |
 |
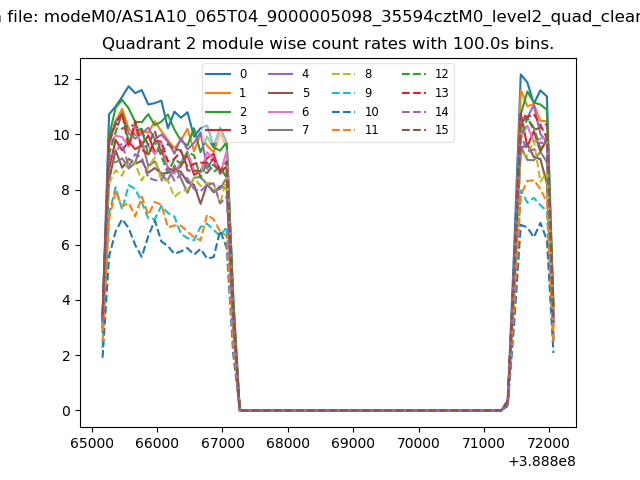
| Module-wise count rates for Quadrant B Data is divided into 100 sec bins |
 |
 |
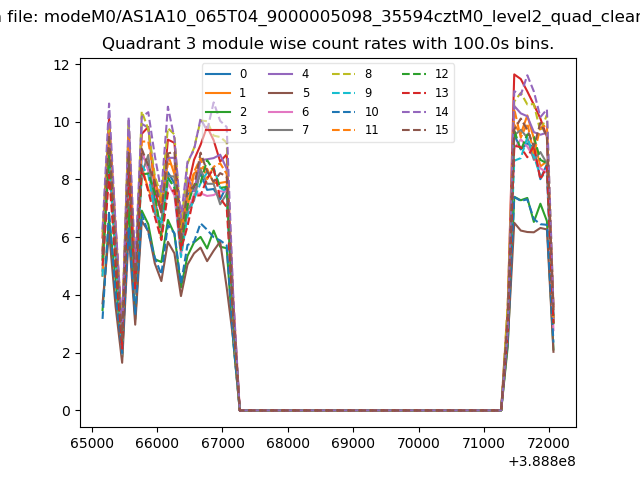
| Module-wise count rates for Quadrant C Data is divided into 100 sec bins |
 |
 |
| Module-wise count rates for Quadrant D Data is divided into 100 sec bins |
 |
 |
| Parameter | Plot |
|---|---|
| CZT HV Monitor | 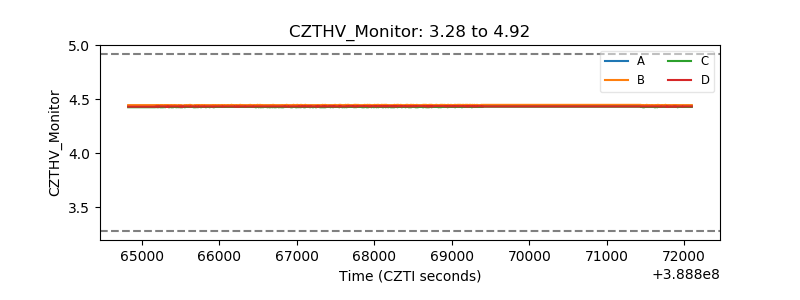 |
| D_VDD | 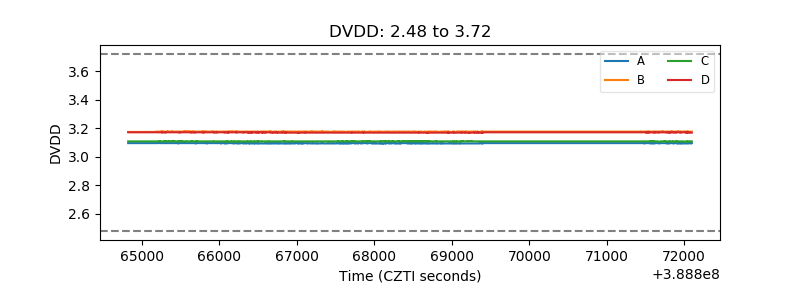 |
| Temperature 1 | 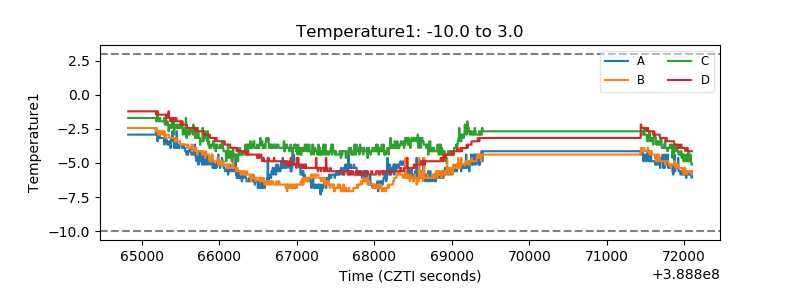 |
| Veto HV Monitor | 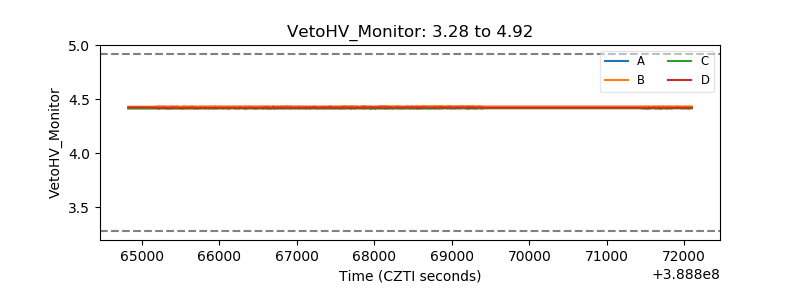 |
| Veto LLD | 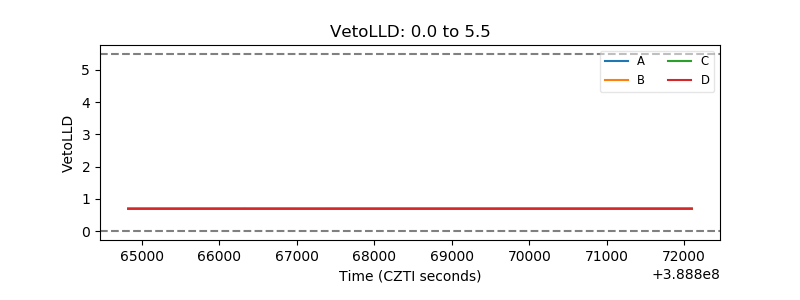 |
| Alpha Counter | 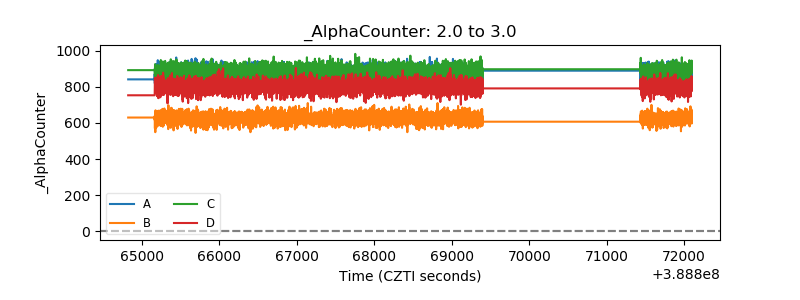 |
| _CPM_Rate | 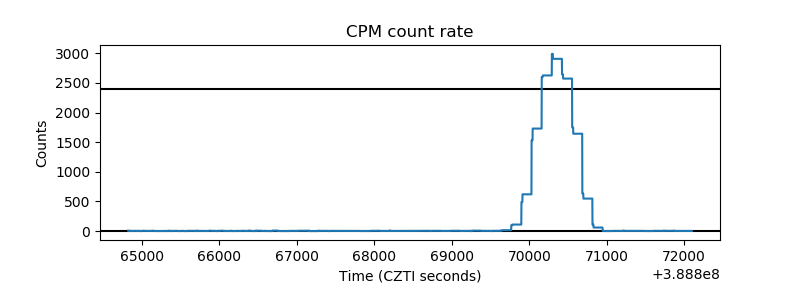 |
| CZT Counter | 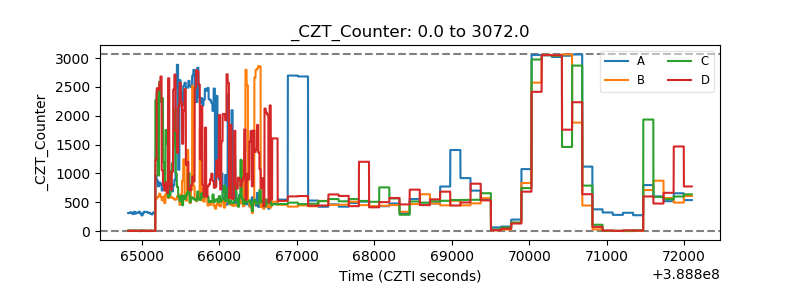 |
| +2.5 Volts monitor | 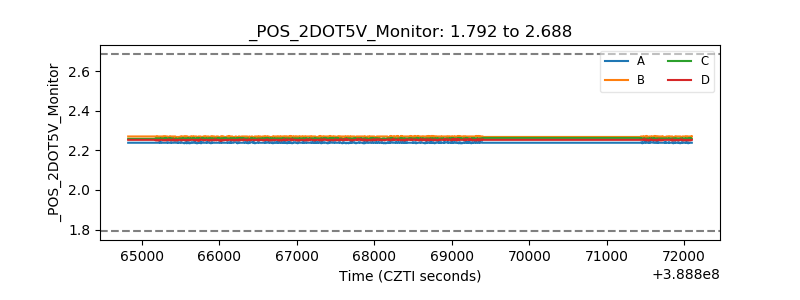 |
| +5 Volts monitor | 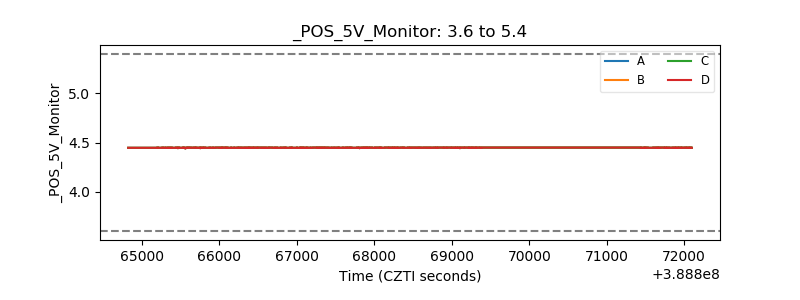 |
| _ROLL_ROT | 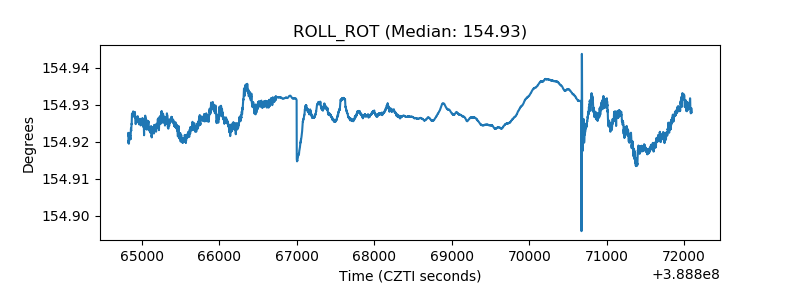 |
| _Roll_DEC | 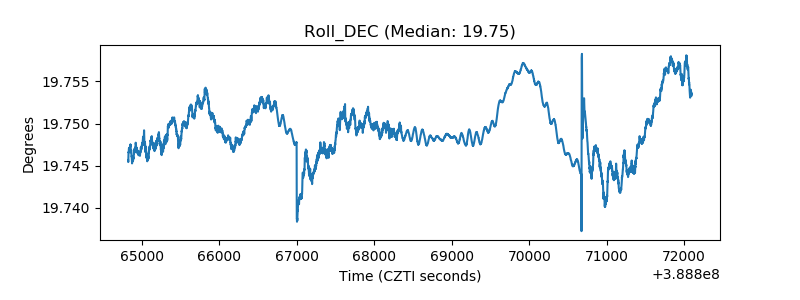 |
| _Roll_RA | 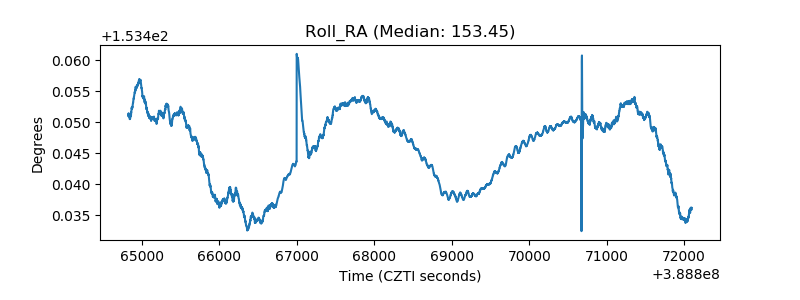 |
| Veto Counter | 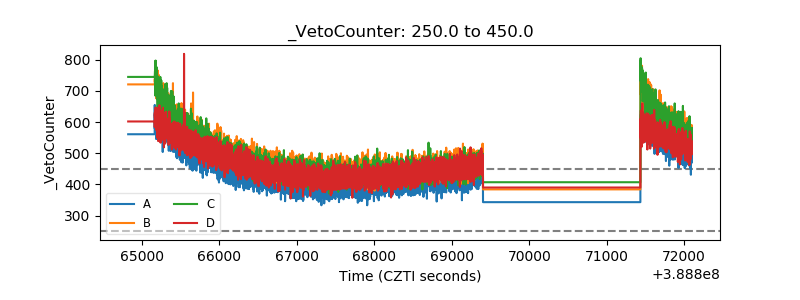 |