| Param | Original file | Final file |
|---|---|---|
| Filename | modeM0/AS1A11_065T21_9000005094_35574cztM0_level2.evt | modeM0/AS1A11_065T21_9000005094_35574cztM0_level2_quad_clean.evt |
| Size (bytes) | 530,447,040 | 90,403,200 |
| Size | 505.9 MB | 86.2 MB |
| Events in quadrant A | 3,546,219 | 575,001 |
| Events in quadrant B | 4,531,185 | 578,063 |
| Events in quadrant C | 3,830,858 | 587,147 |
| Events in quadrant D | 3,736,153 | 564,925 |
| Mode M0 | |||
|---|---|---|---|
| Quadrant | BADHDUFLAG | Total packets | Discarded packets |
| A | 0 | 14604 | 3 |
| B | 0 | 17604 | 2 |
| C | 0 | 15113 | 2 |
| D | 0 | 15051 | 2 |
| Mode M9 | |||
|---|---|---|---|
| Quadrant | BADHDUFLAG | Total packets | Discarded packets |
| A | 0 | 28 | 0 |
| B | 0 | 28 | 0 |
| C | 0 | 28 | 0 |
| D | 0 | 28 | 0 |
| Mode SS | |||
|---|---|---|---|
| Quadrant | BADHDUFLAG | Total packets | Discarded packets |
| A | 0 | 130 | 0 |
| B | 0 | 130 | 0 |
| C | 0 | 130 | 0 |
| D | 0 | 130 | 0 |
| Quadrant | Total seconds | Saturated seconds | Saturation percentage |
|---|---|---|---|
| A | 6185 | 351 | 5.675020% |
| B | 6185 | 603 | 9.749394% |
| C | 6185 | 158 | 2.554568% |
| D | 6185 | 144 | 2.328213% |
Noise dominated data is calculated using 1-second bins in cleaned event files. If a bin has >2000 counts, and if more than 50% of those come from <1% of pixels, then it is considered to be noise-dominated and hence unusable.
| Quadrant | # 1 sec bins | Bins with >0 counts | Bins with >2000 counts | High rate bins dominated by noise | Noise dominated (total time) | Noise dominated (detector-on time) | Marked lightcurve |
|---|---|---|---|---|---|---|---|
| A | 9020 | 6186 | 305 | 305 | 3.38% | 4.93% | 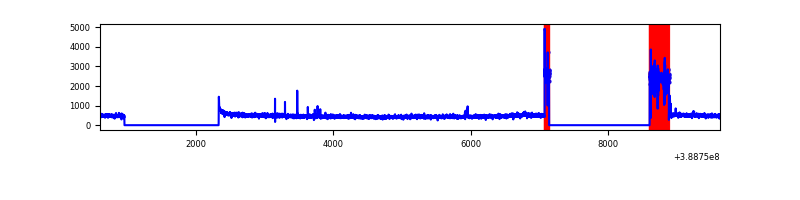 |
| B | 9020 | 6187 | 408 | 408 | 4.52% | 6.59% | 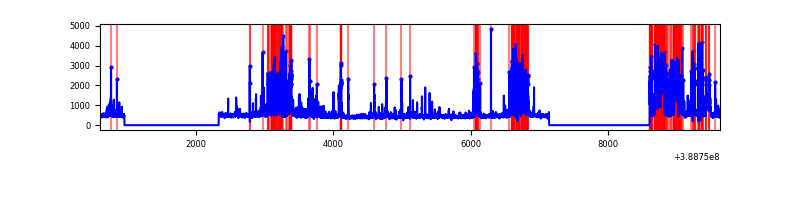 |
| C | 9020 | 6187 | 95 | 95 | 1.05% | 1.54% | 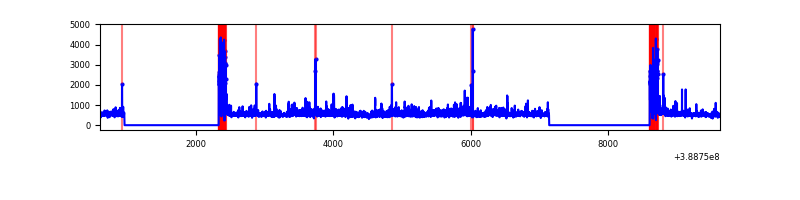 |
| D | 9020 | 6187 | 112 | 112 | 1.24% | 1.81% | 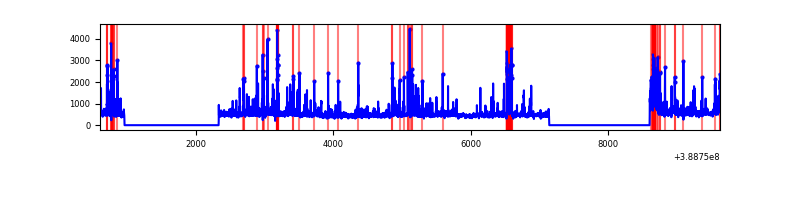 |
Top three noisy pixels from each quadrant. If the there are fewer than three noisy pixels in the level2.evt file, extra rows are filled as -1
| Pixel properties | Quadrant properties | ||||||
|---|---|---|---|---|---|---|---|
| Quadrant | DetID | PixID | Counts | Sigma | Mean | Median | Sigma |
| A | 15 | 169 | 778530 | 5644.21 | 679 | 664 | 137.8 |
| A | 10 | 83 | 124239 | 896.66 | 679 | 664 | 137.8 |
| A | 13 | 6 | 10118 | 68.6 | 679 | 664 | 137.8 |
| B | 5 | 172 | 1601528 | 12277.01 | 674 | 655 | 130.4 |
| B | 5 | 200 | 122010 | 930.66 | 674 | 655 | 130.4 |
| B | 4 | 81 | 51034 | 386.35 | 674 | 655 | 130.4 |
| C | 0 | 10 | 712404 | 4438.49 | 685 | 688 | 160.4 |
| C | 15 | 214 | 251418 | 1563.63 | 685 | 688 | 160.4 |
| C | 9 | 187 | 168351 | 1045.6 | 685 | 688 | 160.4 |
| D | 8 | 195 | 222213 | 1312.82 | 688 | 667 | 168.8 |
| D | 7 | 80 | 171844 | 1014.35 | 688 | 667 | 168.8 |
| D | 13 | 249 | 155603 | 918.11 | 688 | 667 | 168.8 |
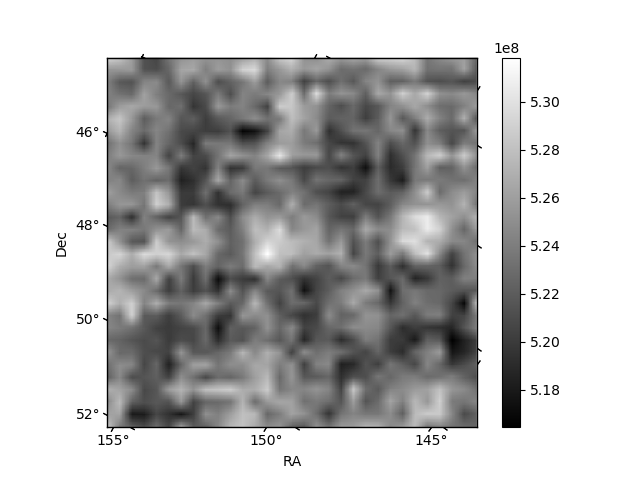
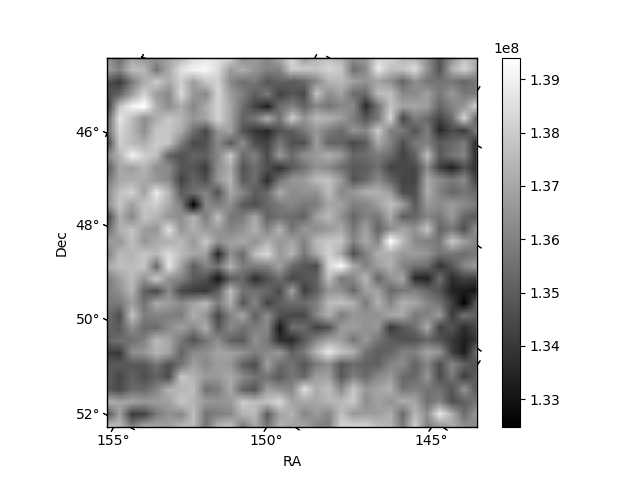
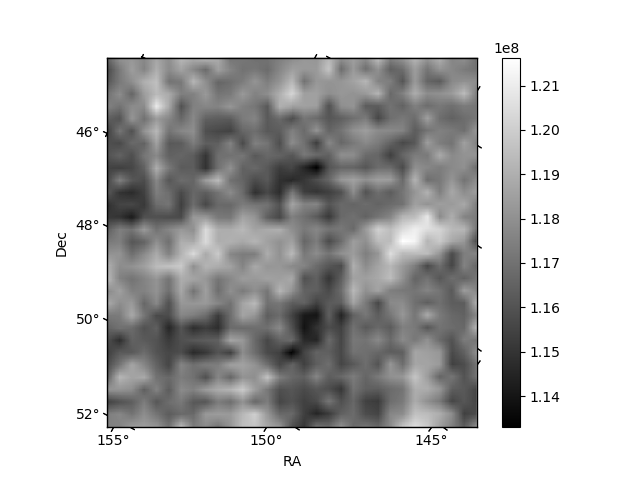
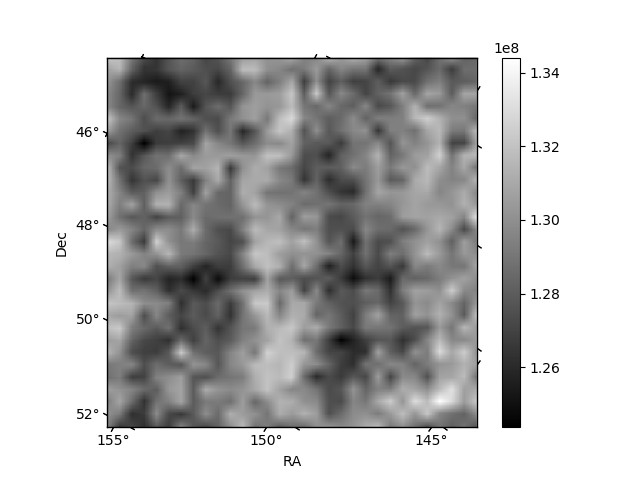
Histogram calculated using DETX and DETY for each event in the final _common_clean file
| Quadrant A | 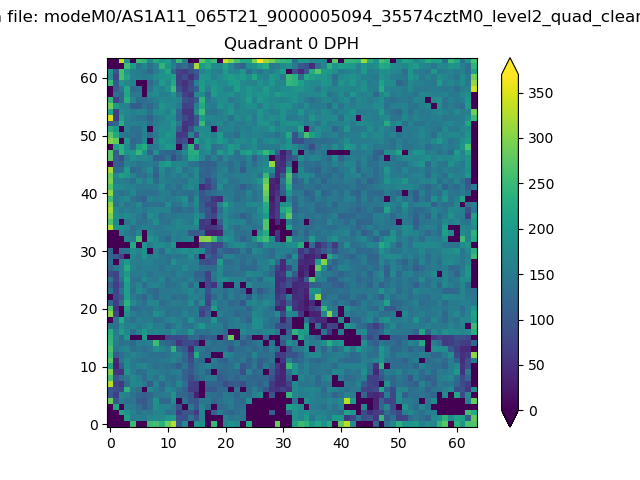 |
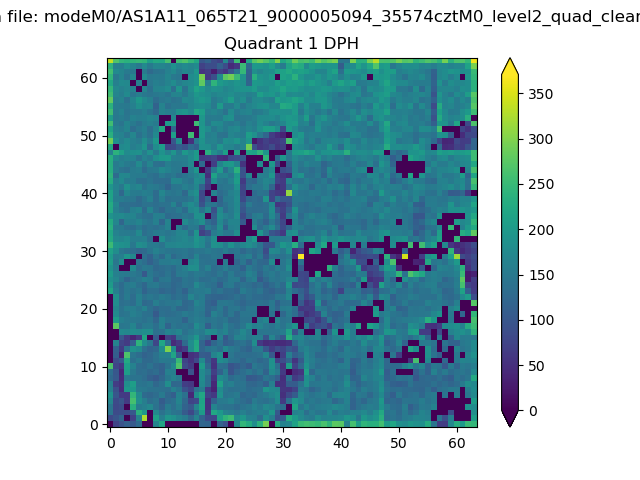 |
Quadrant B |
|---|---|---|---|
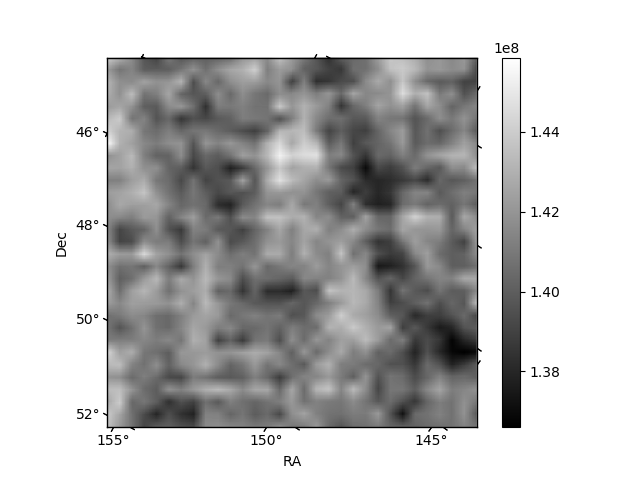
| Quadrant D | 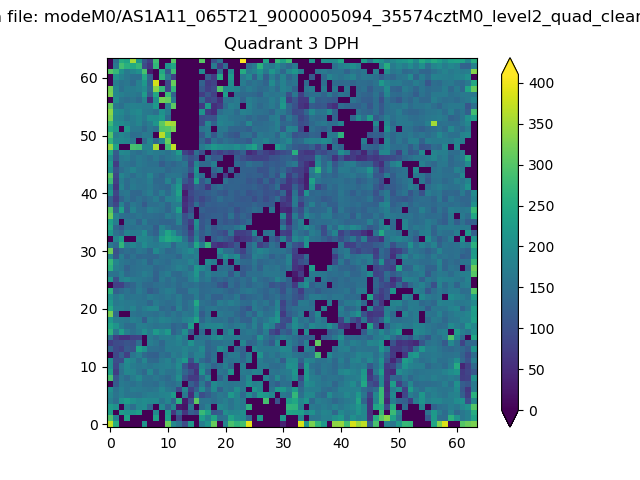 |
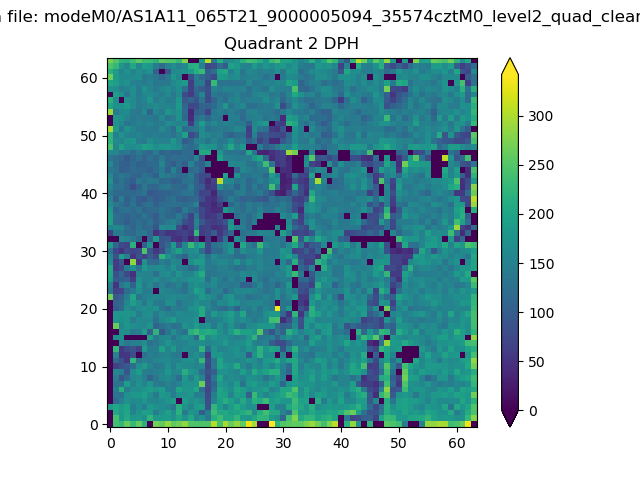 |
Quadrant C |
| Plot type | Count rate plots | Images |
|---|---|---|
| Comparison with Poisson distribution Blue bars denote a histogram of data divided into 1 sec bins. Red curve is a Poisson curve with rate = median count rate of data. |
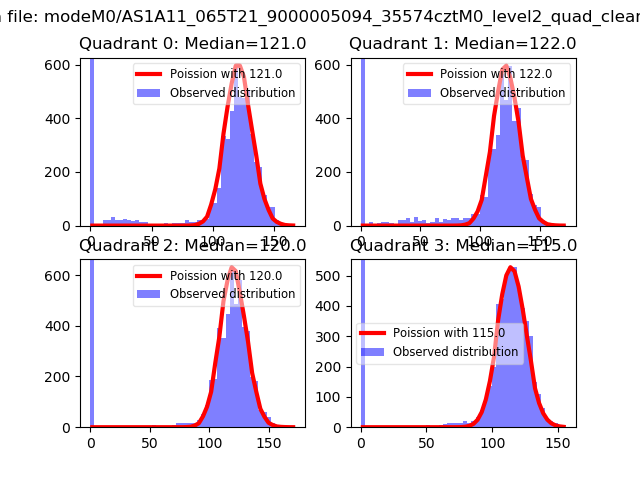 |
 |
| Quadrant-wise count rates Data is divided into 100 sec bins |
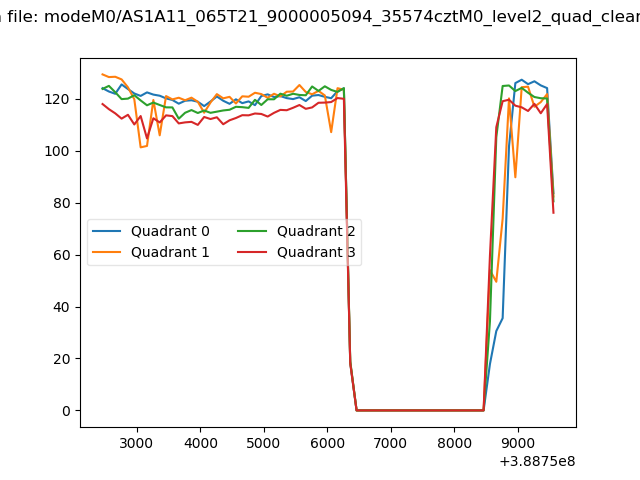 |
|
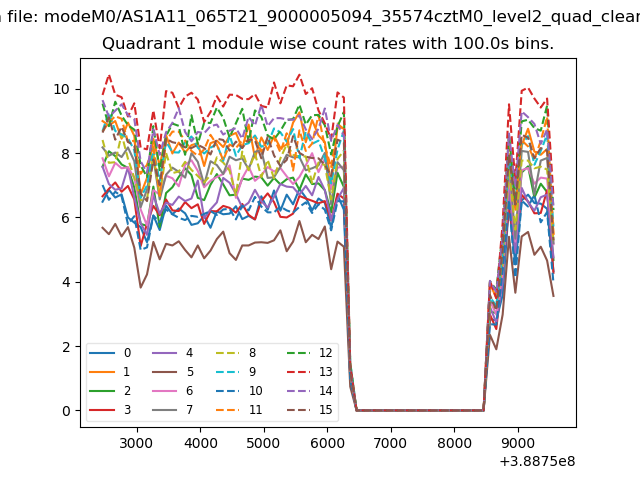
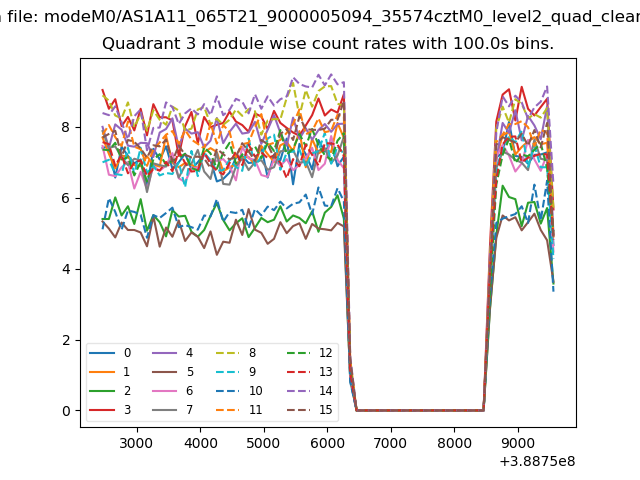
| Module-wise count rates for Quadrant A Data is divided into 100 sec bins |
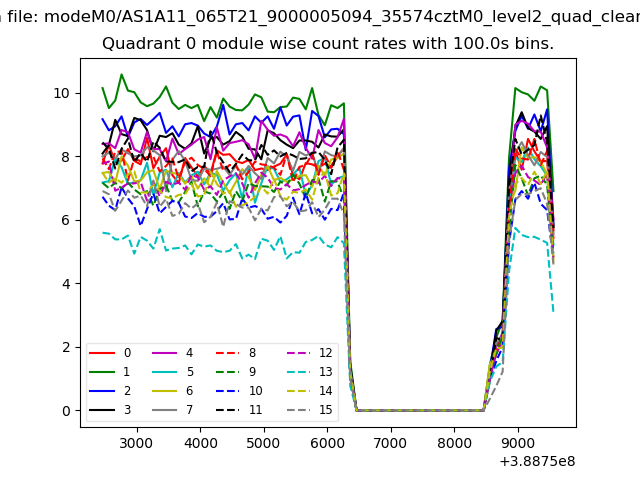 |
 |
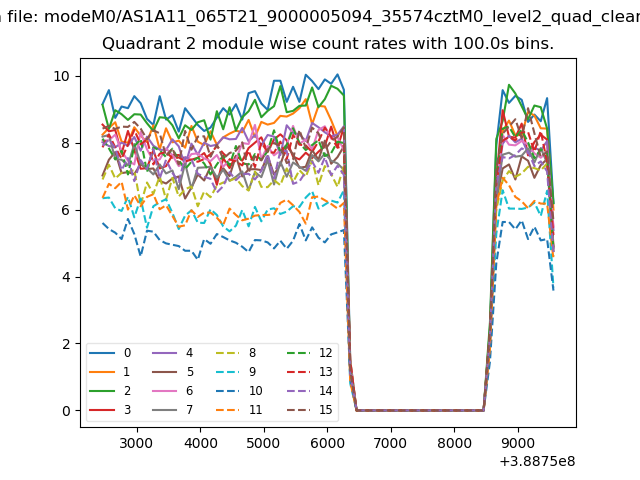
| Module-wise count rates for Quadrant B Data is divided into 100 sec bins |
 |
 |
| Module-wise count rates for Quadrant C Data is divided into 100 sec bins |
 |
 |
| Module-wise count rates for Quadrant D Data is divided into 100 sec bins |
 |
 |
| Parameter | Plot |
|---|---|
| CZT HV Monitor | 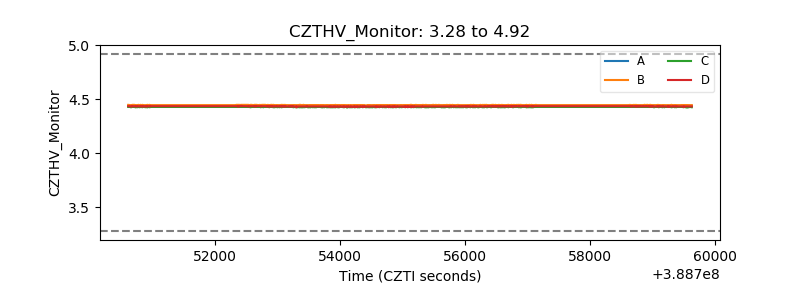 |
| D_VDD | 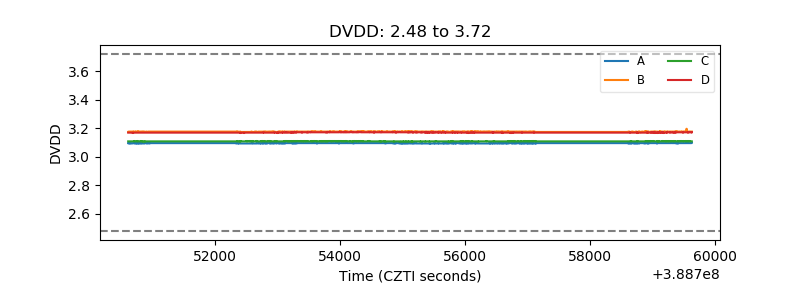 |
| Temperature 1 | 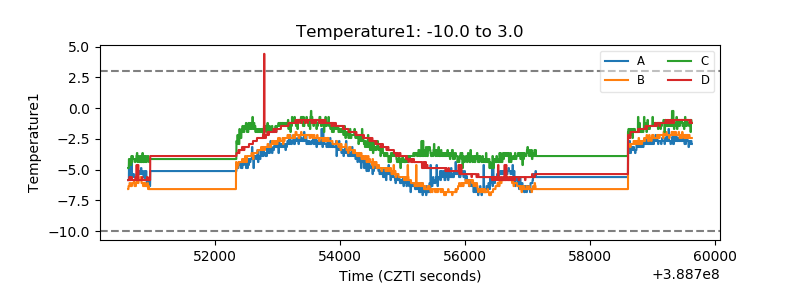 |
| Veto HV Monitor | 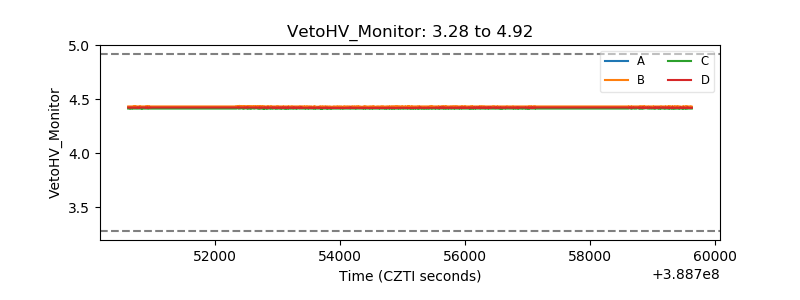 |
| Veto LLD | 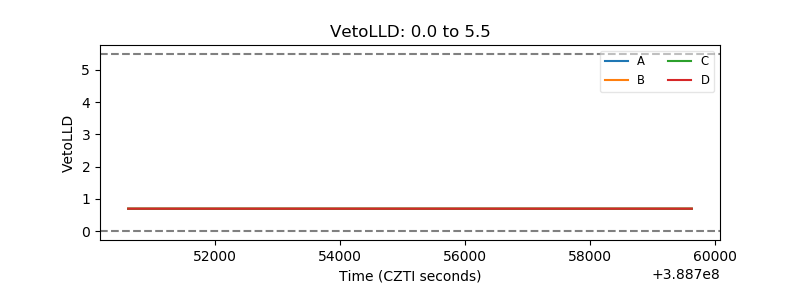 |
| Alpha Counter | 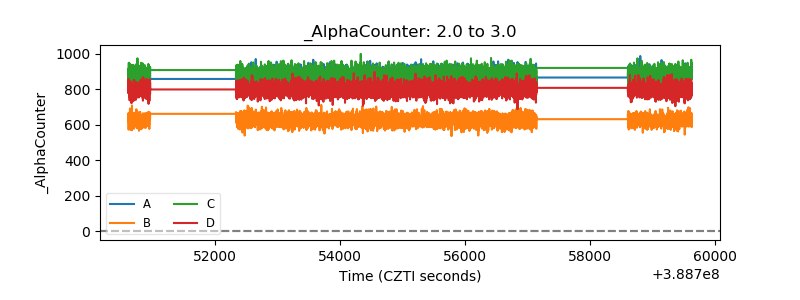 |
| _CPM_Rate | 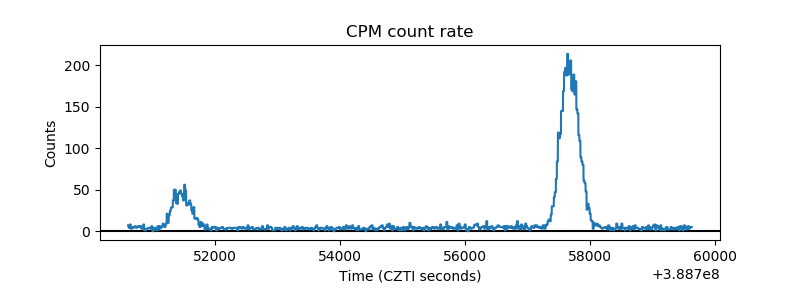 |
| CZT Counter | 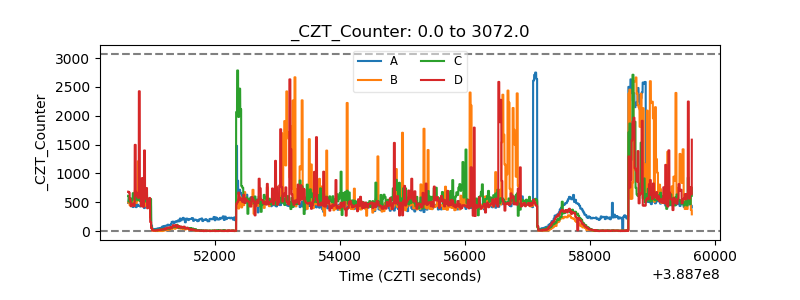 |
| +2.5 Volts monitor | 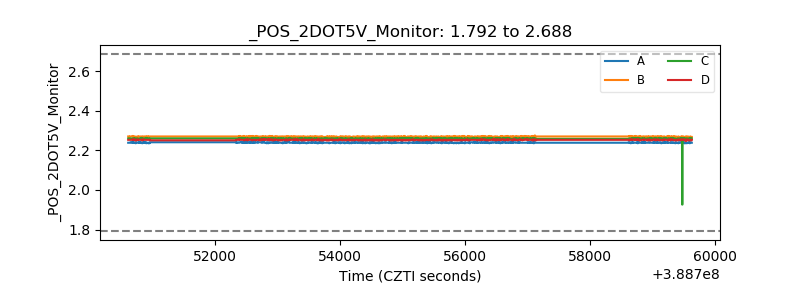 |
| +5 Volts monitor | 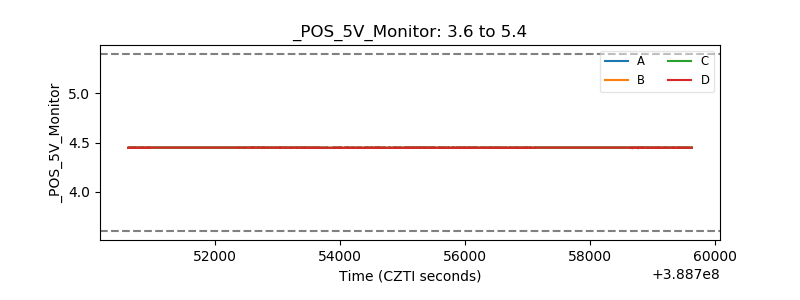 |
| _ROLL_ROT | 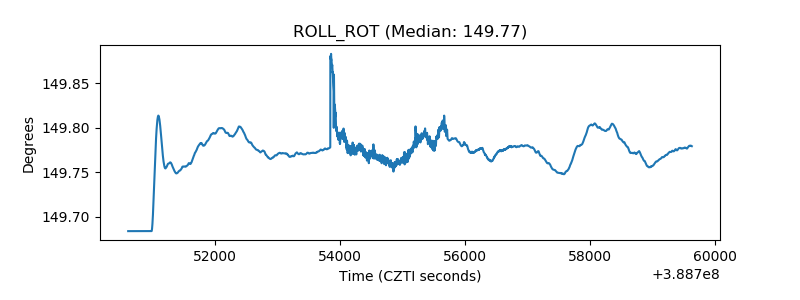 |
| _Roll_DEC |  |
| _Roll_RA | 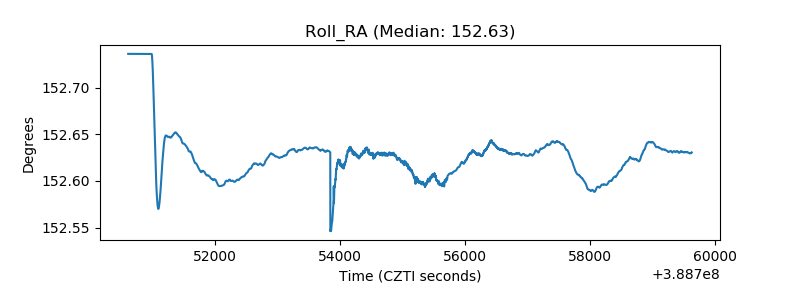 |
| Veto Counter | 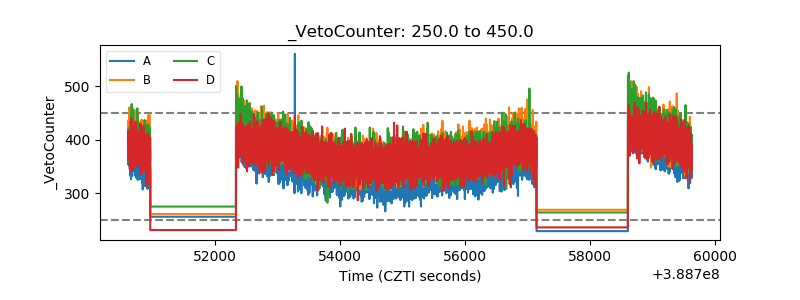 |