| Param | Original file | Final file |
|---|---|---|
| Filename | modeM0/AS1A10_071T01_9000005096_35586cztM0_level2.evt | modeM0/AS1A10_071T01_9000005096_35586cztM0_level2_quad_clean.evt |
| Size (bytes) | 501,842,880 | 71,006,400 |
| Size | 478.6 MB | 67.7 MB |
| Events in quadrant A | 3,082,692 | 438,180 |
| Events in quadrant B | 4,564,370 | 413,177 |
| Events in quadrant C | 3,559,659 | 436,108 |
| Events in quadrant D | 3,558,141 | 416,890 |
| Mode SS | |||
|---|---|---|---|
| Quadrant | BADHDUFLAG | Total packets | Discarded packets |
| A | 0 | 130 | 0 |
| B | 0 | 130 | 0 |
| C | 0 | 130 | 0 |
| D | 0 | 130 | 0 |
| Mode M9 | |||
|---|---|---|---|
| Quadrant | BADHDUFLAG | Total packets | Discarded packets |
| A | 0 | 27 | 0 |
| B | 0 | 27 | 0 |
| C | 0 | 27 | 0 |
| D | 0 | 27 | 0 |
| Mode M0 | |||
|---|---|---|---|
| Quadrant | BADHDUFLAG | Total packets | Discarded packets |
| A | 0 | 13114 | 3 |
| B | 0 | 17725 | 2 |
| C | 0 | 14156 | 2 |
| D | 0 | 14765 | 2 |
| Quadrant | Total seconds | Saturated seconds | Saturation percentage |
|---|---|---|---|
| A | 6390 | 7 | 0.109546% |
| B | 6390 | 547 | 8.560250% |
| C | 6390 | 115 | 1.799687% |
| D | 6390 | 89 | 1.392801% |
Noise dominated data is calculated using 1-second bins in cleaned event files. If a bin has >2000 counts, and if more than 50% of those come from <1% of pixels, then it is considered to be noise-dominated and hence unusable.
| Quadrant | # 1 sec bins | Bins with >0 counts | Bins with >2000 counts | High rate bins dominated by noise | Noise dominated (total time) | Noise dominated (detector-on time) | Marked lightcurve |
|---|---|---|---|---|---|---|---|
| A | 9049 | 6392 | 1 | 1 | 0.01% | 0.02% | 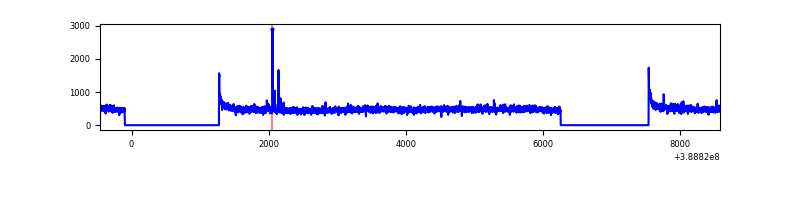 |
| B | 9049 | 6392 | 371 | 371 | 4.10% | 5.80% | 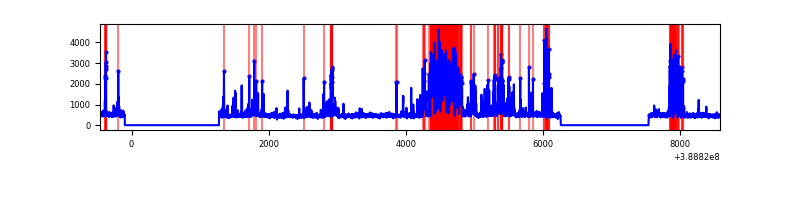 |
| C | 9049 | 6392 | 92 | 92 | 1.02% | 1.44% | 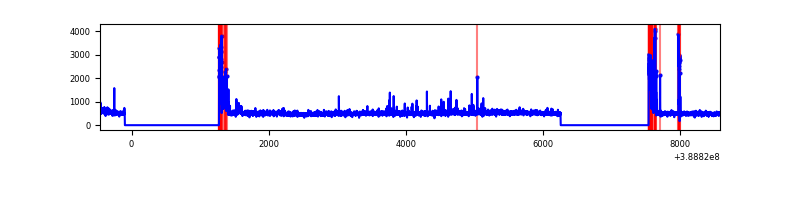 |
| D | 9049 | 6392 | 67 | 67 | 0.74% | 1.05% | 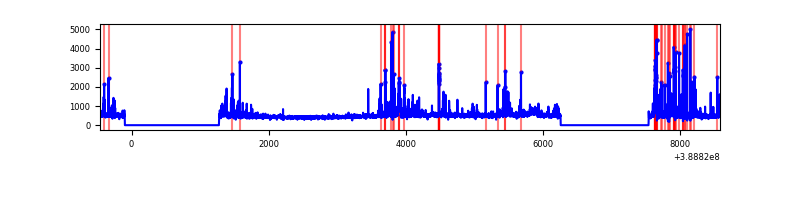 |
Top three noisy pixels from each quadrant. If the there are fewer than three noisy pixels in the level2.evt file, extra rows are filled as -1
| Pixel properties | Quadrant properties | ||||||
|---|---|---|---|---|---|---|---|
| Quadrant | DetID | PixID | Counts | Sigma | Mean | Median | Sigma |
| A | 10 | 83 | 148440 | 981.7 | 744 | 729 | 150.5 |
| A | 15 | 169 | 49511 | 324.21 | 744 | 729 | 150.5 |
| A | 13 | 6 | 12559 | 78.62 | 744 | 729 | 150.5 |
| B | 5 | 172 | 1650127 | 12109.88 | 714 | 694 | 136.2 |
| B | 4 | 232 | 76205 | 554.39 | 714 | 694 | 136.2 |
| B | 12 | 111 | 18010 | 127.13 | 714 | 694 | 136.2 |
| C | 0 | 10 | 421487 | 2481.81 | 720 | 724 | 169.5 |
| C | 15 | 214 | 264001 | 1552.9 | 720 | 724 | 169.5 |
| C | 9 | 69 | 51949 | 302.14 | 720 | 724 | 169.5 |
| D | 7 | 80 | 299504 | 1670.04 | 720 | 698 | 178.9 |
| D | 13 | 249 | 118421 | 657.96 | 720 | 698 | 178.9 |
| D | 8 | 195 | 91331 | 506.55 | 720 | 698 | 178.9 |
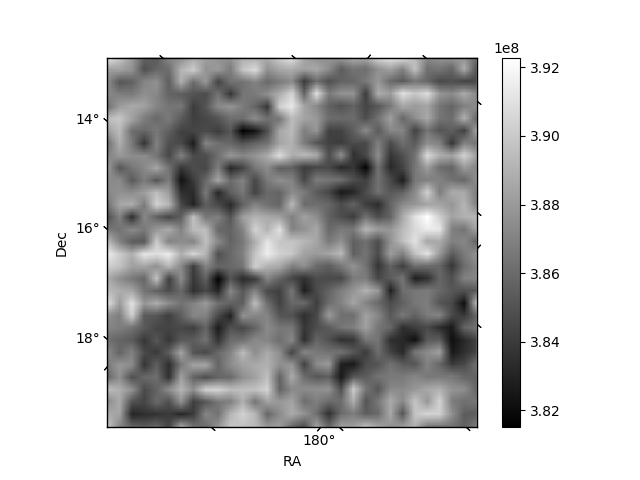
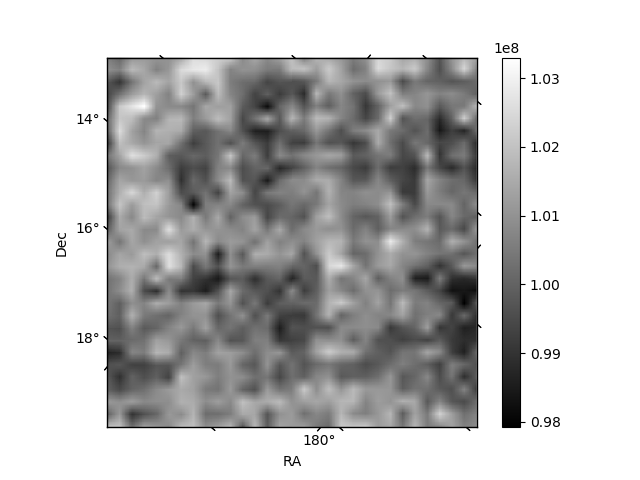
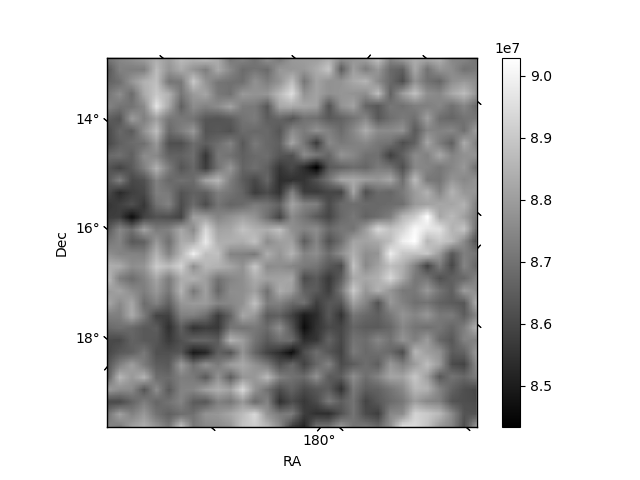
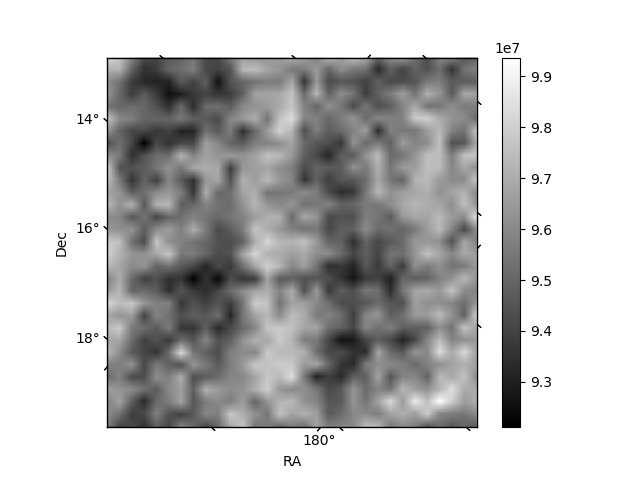
Histogram calculated using DETX and DETY for each event in the final _common_clean file
| Quadrant A | 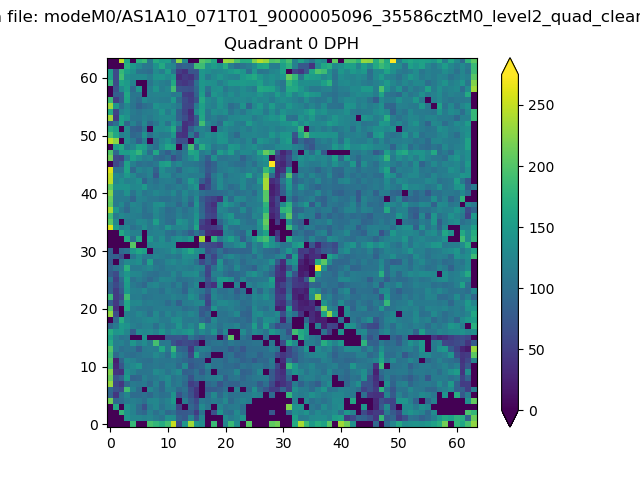 |
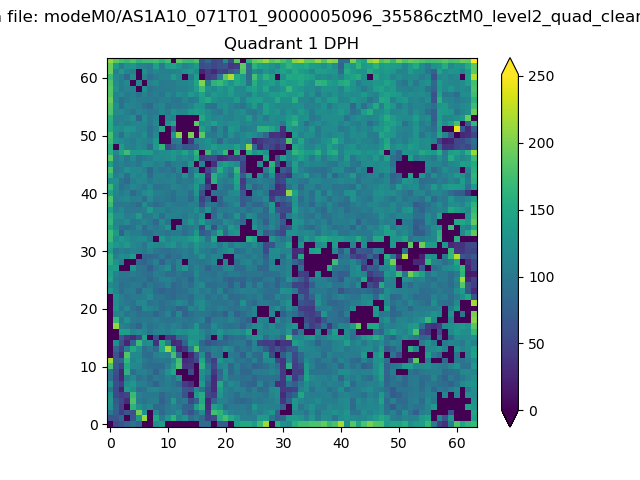 |
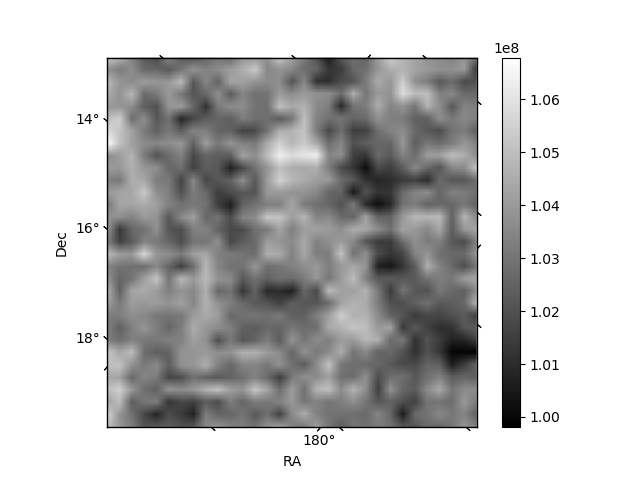
Quadrant B |
|---|---|---|---|
| Quadrant D | 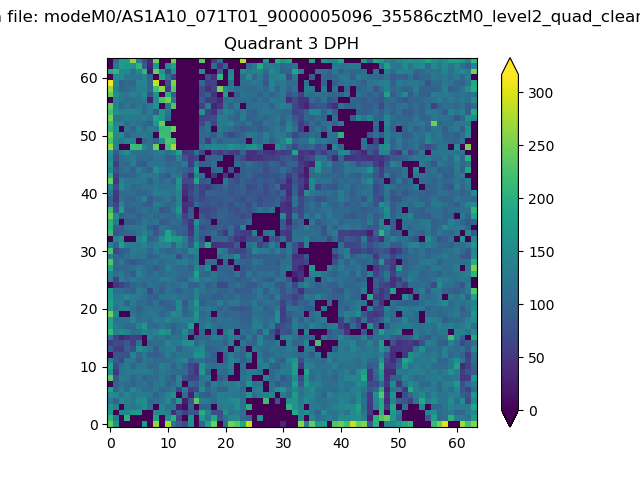 |
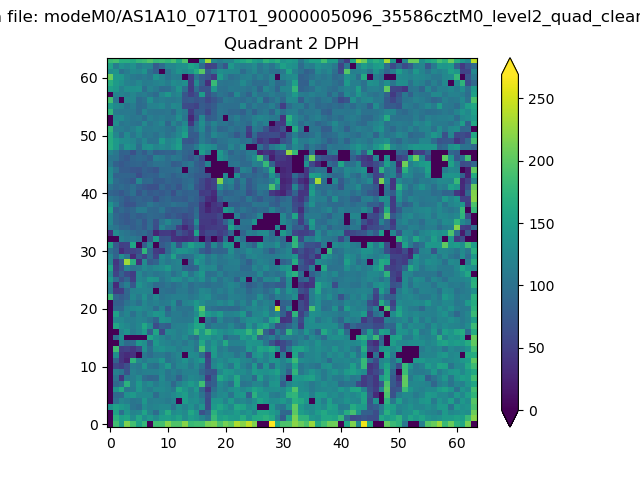 |
Quadrant C |
| Plot type | Count rate plots | Images |
|---|---|---|
| Comparison with Poisson distribution Blue bars denote a histogram of data divided into 1 sec bins. Red curve is a Poisson curve with rate = median count rate of data. |
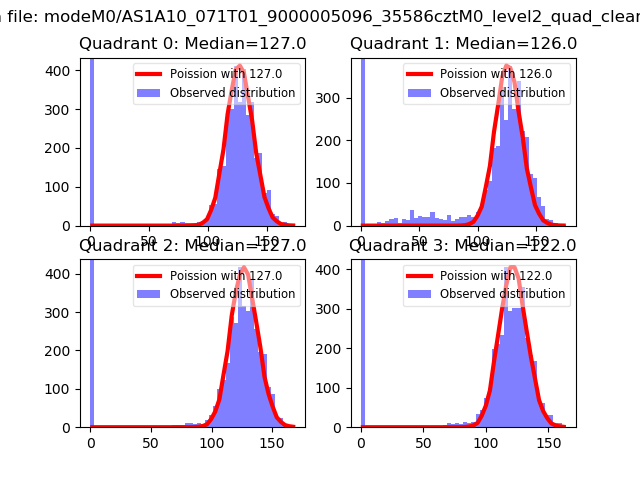 |
 |
| Quadrant-wise count rates Data is divided into 100 sec bins |
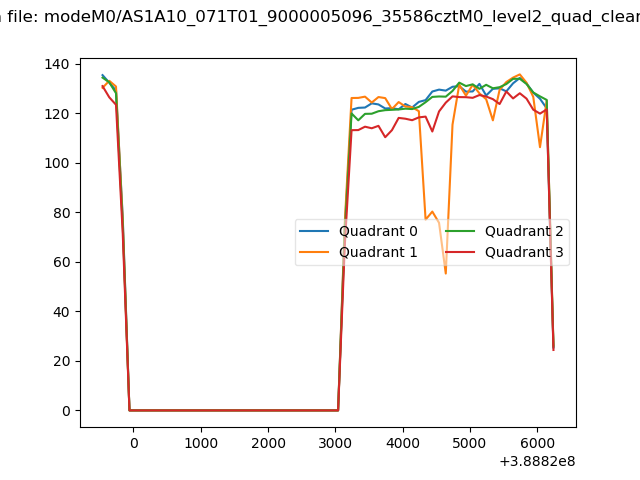 |
|
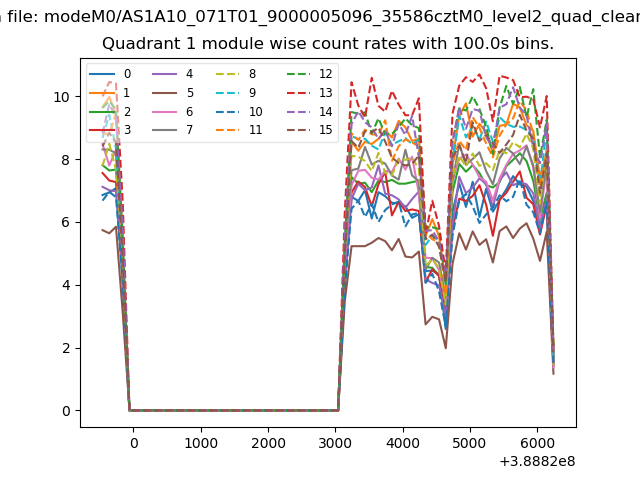
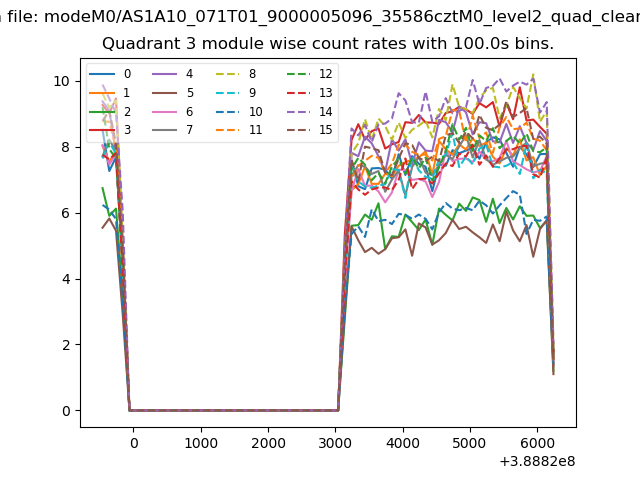
| Module-wise count rates for Quadrant A Data is divided into 100 sec bins |
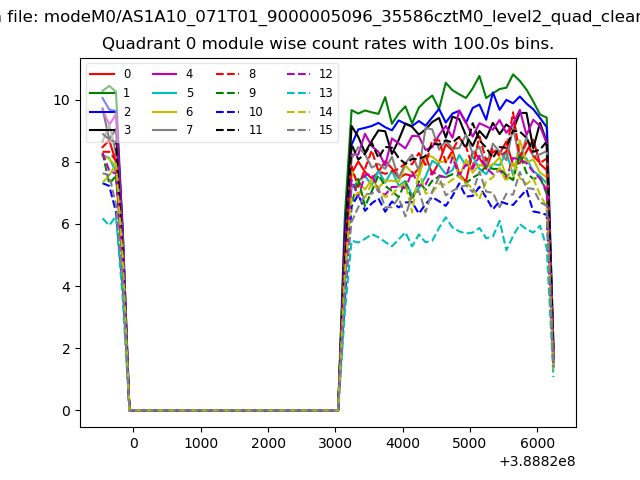 |
 |
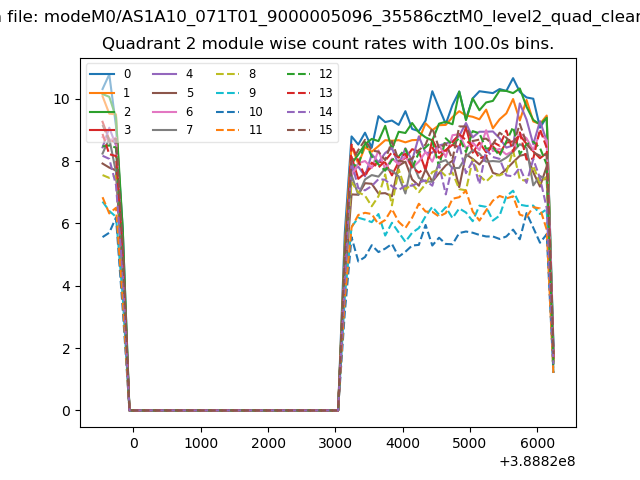
| Module-wise count rates for Quadrant B Data is divided into 100 sec bins |
 |
 |
| Module-wise count rates for Quadrant C Data is divided into 100 sec bins |
 |
 |
| Module-wise count rates for Quadrant D Data is divided into 100 sec bins |
 |
 |
| Parameter | Plot |
|---|---|
| CZT HV Monitor | 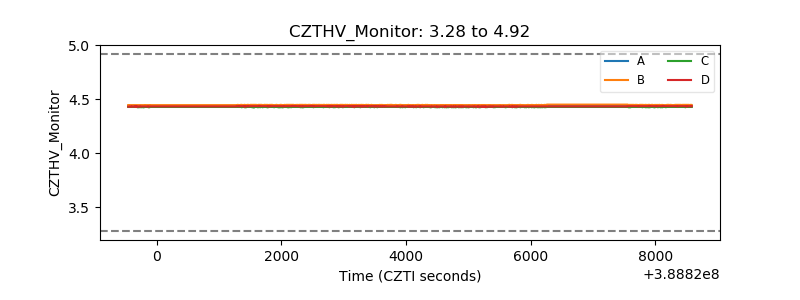 |
| D_VDD | 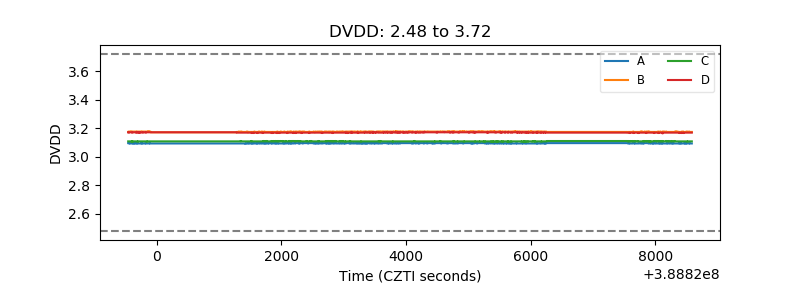 |
| Temperature 1 | 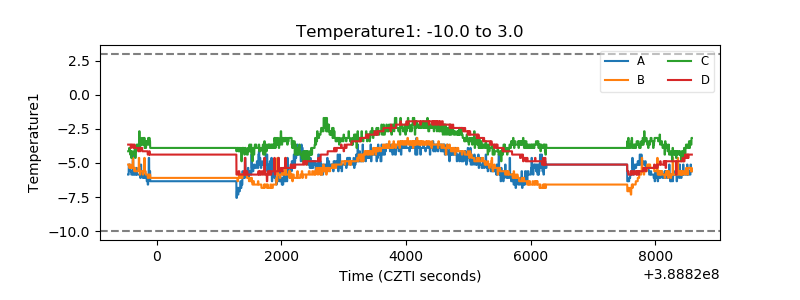 |
| Veto HV Monitor | 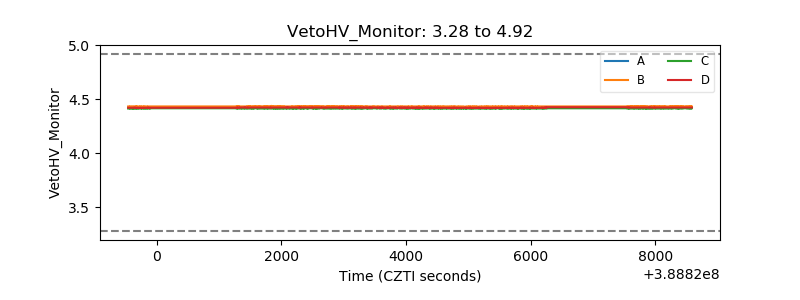 |
| Veto LLD | 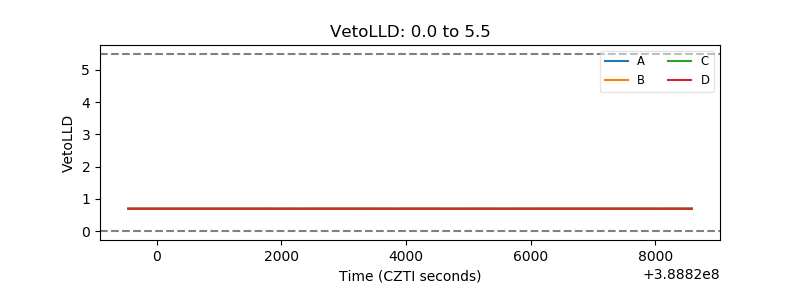 |
| Alpha Counter | 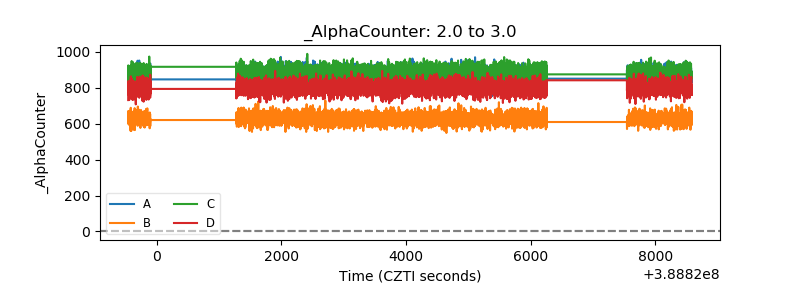 |
| _CPM_Rate | 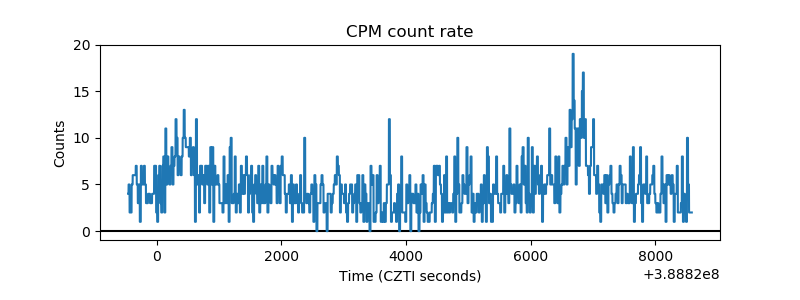 |
| CZT Counter | 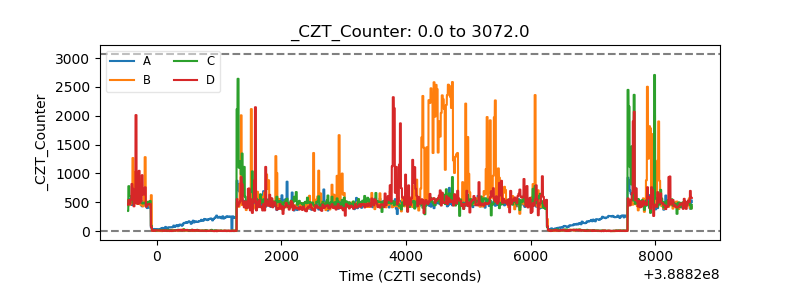 |
| +2.5 Volts monitor | 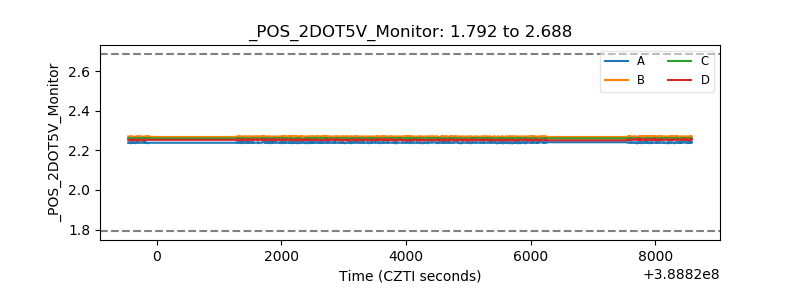 |
| +5 Volts monitor | 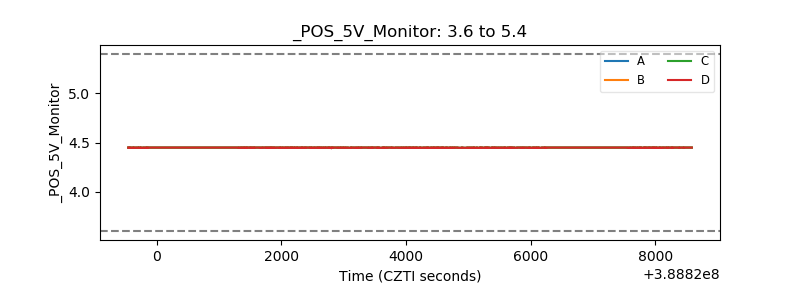 |
| _ROLL_ROT | 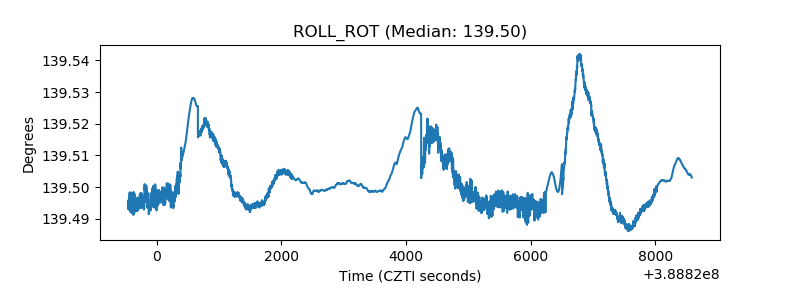 |
| _Roll_DEC | 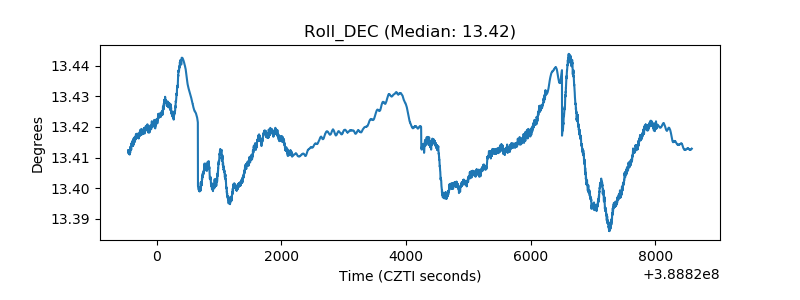 |
| _Roll_RA | 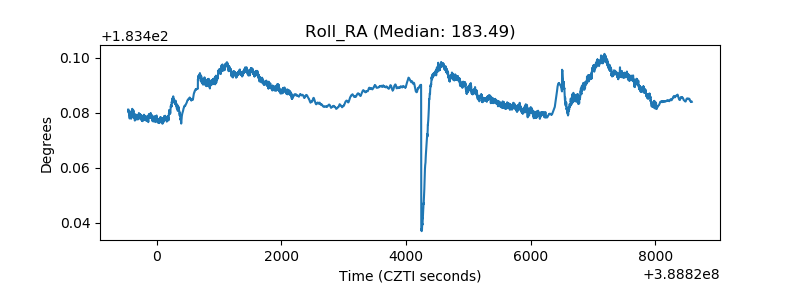 |
| Veto Counter | 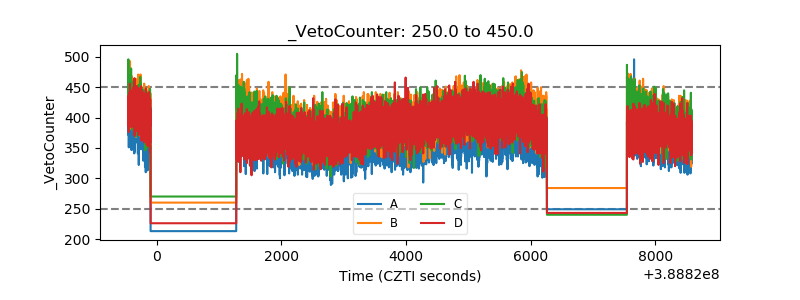 |