| Param | Original file | Final file |
|---|---|---|
| Filename | modeM0/AS1A10_071T01_9000005096_35582cztM0_level2.evt | modeM0/AS1A10_071T01_9000005096_35582cztM0_level2_quad_clean.evt |
| Size (bytes) | 392,463,360 | 59,333,760 |
| Size | 374.3 MB | 56.6 MB |
| Events in quadrant A | 2,799,736 | 369,217 |
| Events in quadrant B | 3,208,300 | 369,495 |
| Events in quadrant C | 2,974,224 | 357,524 |
| Events in quadrant D | 2,565,807 | 351,850 |
| Mode SS | |||
|---|---|---|---|
| Quadrant | BADHDUFLAG | Total packets | Discarded packets |
| A | 0 | 100 | 0 |
| B | 0 | 100 | 0 |
| C | 0 | 100 | 0 |
| D | 0 | 100 | 0 |
| Mode M9 | |||
|---|---|---|---|
| Quadrant | BADHDUFLAG | Total packets | Discarded packets |
| A | 0 | 32 | 0 |
| B | 0 | 32 | 0 |
| C | 0 | 32 | 0 |
| D | 0 | 33 | 0 |
| Mode M0 | |||
|---|---|---|---|
| Quadrant | BADHDUFLAG | Total packets | Discarded packets |
| A | 0 | 11523 | 3 |
| B | 0 | 12595 | 2 |
| C | 0 | 11697 | 2 |
| D | 0 | 10806 | 2 |
| Quadrant | Total seconds | Saturated seconds | Saturation percentage |
|---|---|---|---|
| A | 4969 | 29 | 0.583618% |
| B | 4969 | 273 | 5.494063% |
| C | 4969 | 198 | 3.984705% |
| D | 4969 | 35 | 0.704367% |
Noise dominated data is calculated using 1-second bins in cleaned event files. If a bin has >2000 counts, and if more than 50% of those come from <1% of pixels, then it is considered to be noise-dominated and hence unusable.
| Quadrant | # 1 sec bins | Bins with >0 counts | Bins with >2000 counts | High rate bins dominated by noise | Noise dominated (total time) | Noise dominated (detector-on time) | Marked lightcurve |
|---|---|---|---|---|---|---|---|
| A | 7091 | 4970 | 21 | 21 | 0.30% | 0.42% | 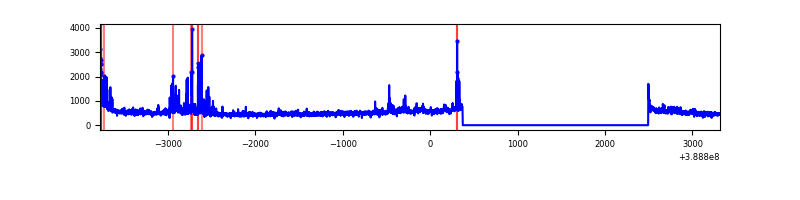 |
| B | 7091 | 4970 | 204 | 204 | 2.88% | 4.10% | 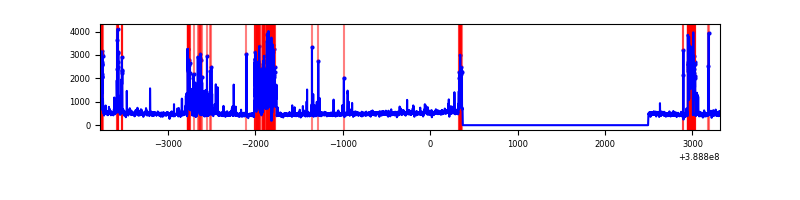 |
| C | 7091 | 4970 | 146 | 146 | 2.06% | 2.94% | 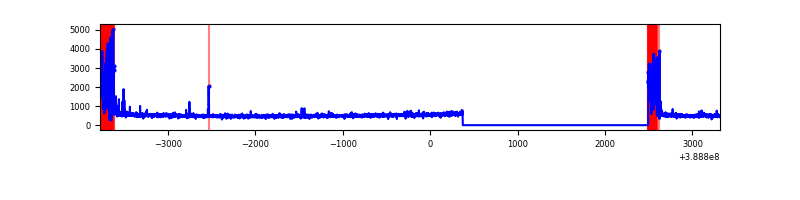 |
| D | 7091 | 4970 | 19 | 19 | 0.27% | 0.38% | 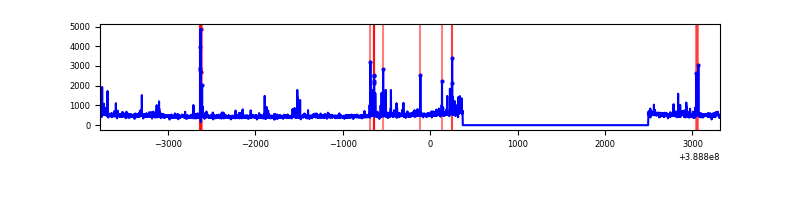 |
Top three noisy pixels from each quadrant. If the there are fewer than three noisy pixels in the level2.evt file, extra rows are filled as -1
| Pixel properties | Quadrant properties | ||||||
|---|---|---|---|---|---|---|---|
| Quadrant | DetID | PixID | Counts | Sigma | Mean | Median | Sigma |
| A | 15 | 169 | 352031 | 2921.12 | 593 | 582 | 120.3 |
| A | 10 | 83 | 128144 | 1060.25 | 593 | 582 | 120.3 |
| A | 7 | 16 | 28634 | 233.16 | 593 | 582 | 120.3 |
| B | 5 | 172 | 883525 | 7937.82 | 580 | 567 | 111.2 |
| B | 0 | 189 | 25120 | 220.73 | 580 | 567 | 111.2 |
| B | 12 | 111 | 13831 | 119.24 | 580 | 567 | 111.2 |
| C | 0 | 10 | 533457 | 4007.33 | 568 | 574 | 133.0 |
| C | 15 | 214 | 207791 | 1558.29 | 568 | 574 | 133.0 |
| C | 10 | 49 | 12636 | 90.71 | 568 | 574 | 133.0 |
| D | 8 | 195 | 122664 | 875.3 | 571 | 555 | 139.5 |
| D | 7 | 80 | 74578 | 530.61 | 571 | 555 | 139.5 |
| D | 13 | 249 | 56025 | 397.62 | 571 | 555 | 139.5 |
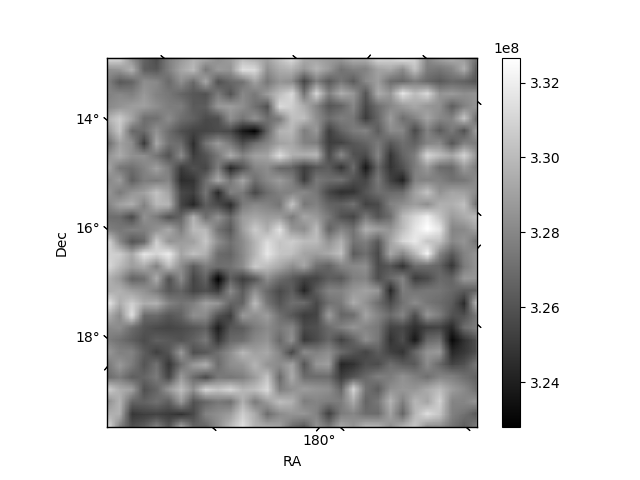
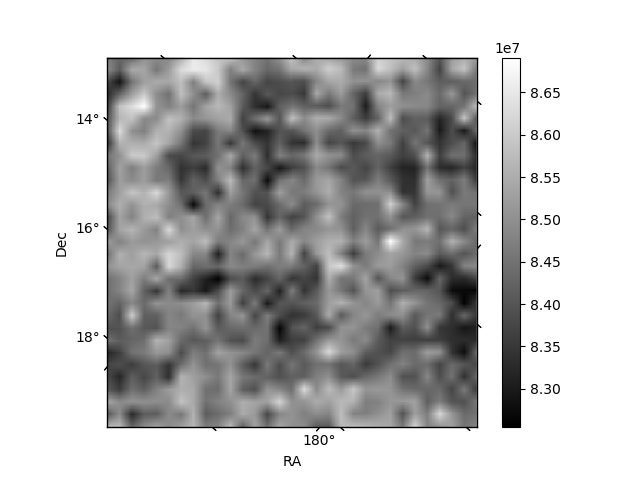
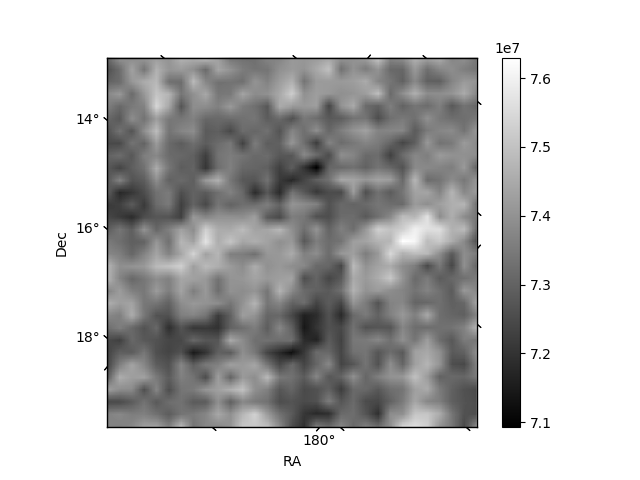
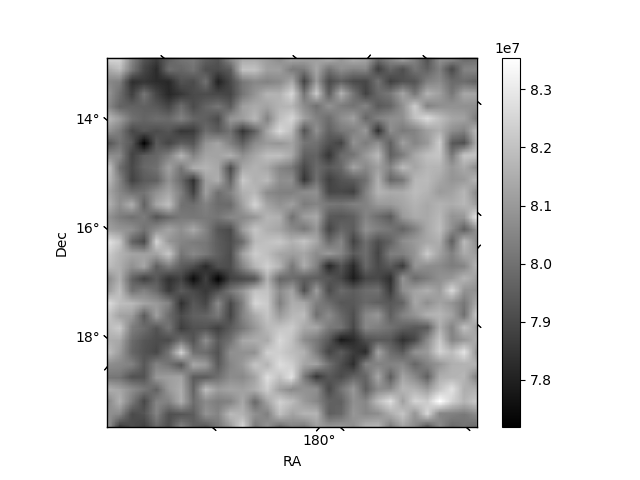
Histogram calculated using DETX and DETY for each event in the final _common_clean file
| Quadrant A | 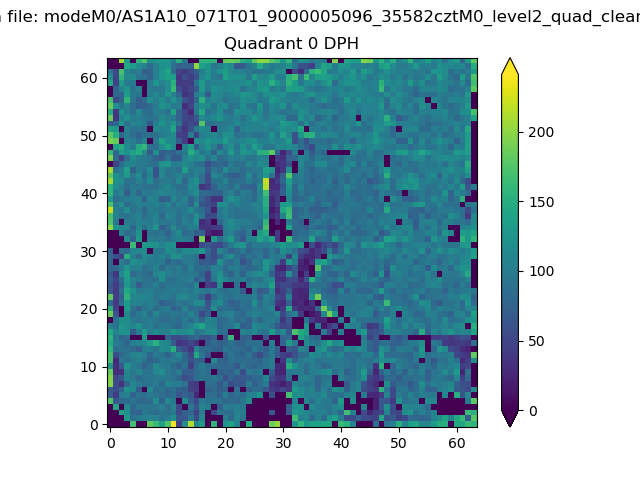 |
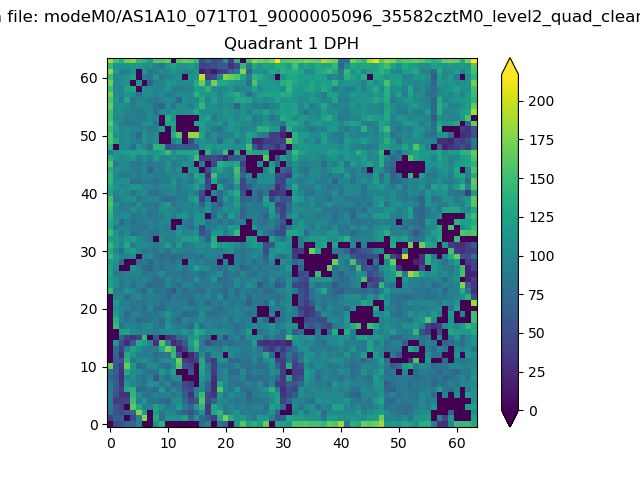 |
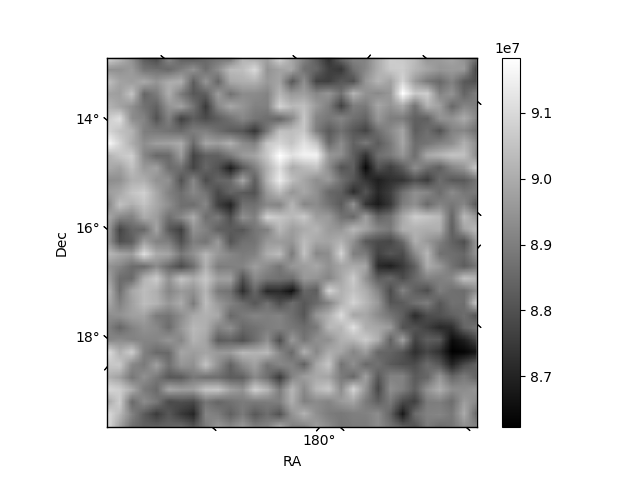
Quadrant B |
|---|---|---|---|
| Quadrant D | 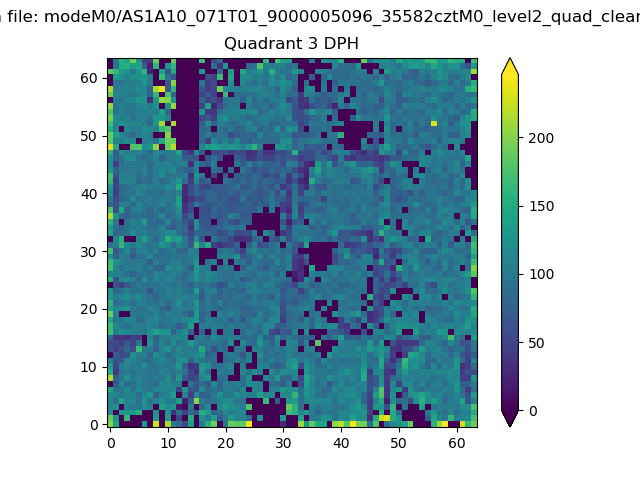 |
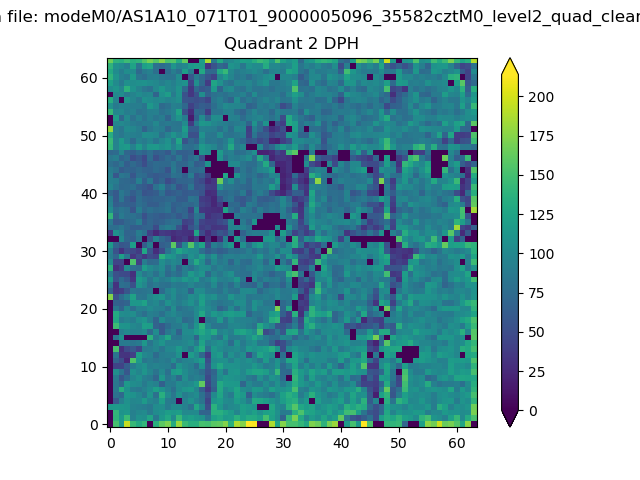 |
Quadrant C |
| Plot type | Count rate plots | Images |
|---|---|---|
| Comparison with Poisson distribution Blue bars denote a histogram of data divided into 1 sec bins. Red curve is a Poisson curve with rate = median count rate of data. |
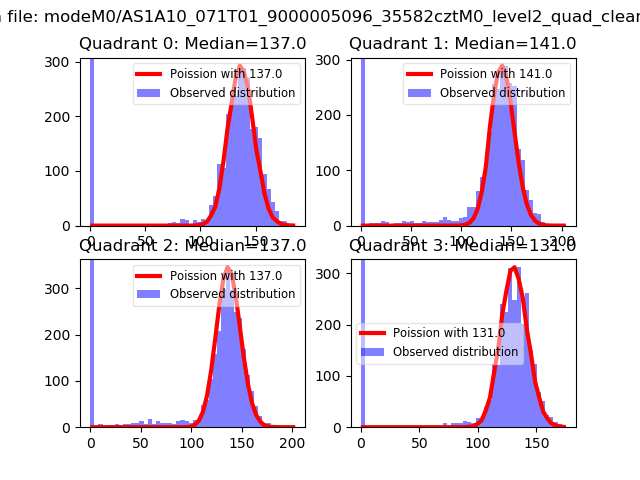 |
 |
| Quadrant-wise count rates Data is divided into 100 sec bins |
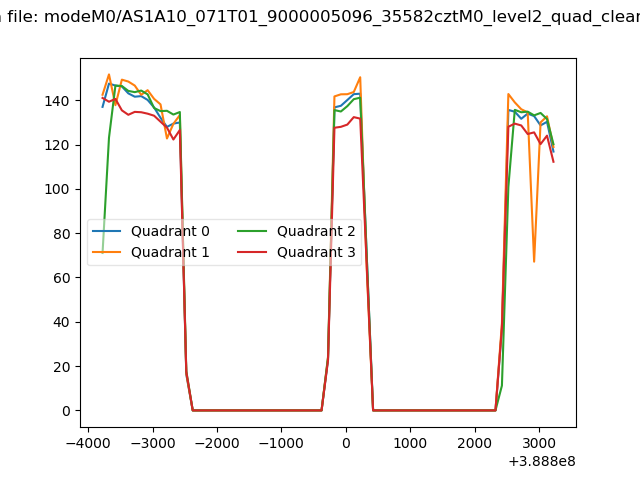 |
|
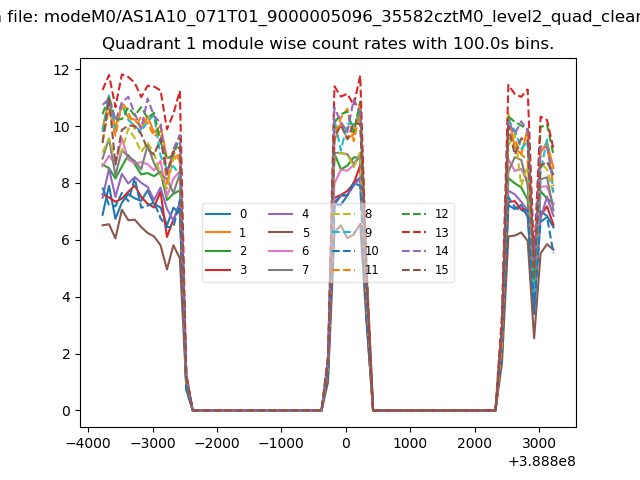
| Module-wise count rates for Quadrant A Data is divided into 100 sec bins |
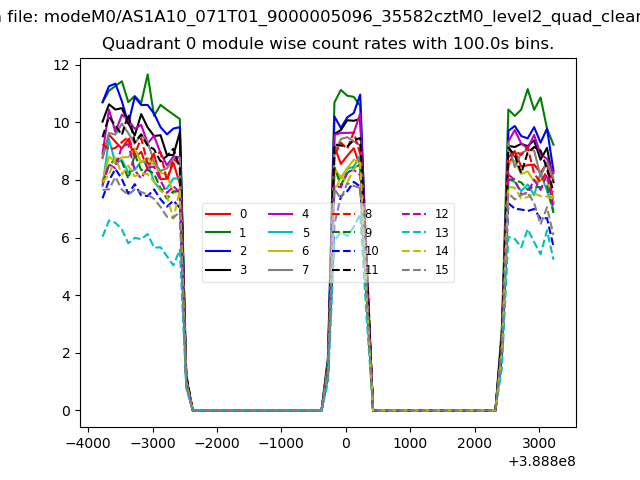 |
 |
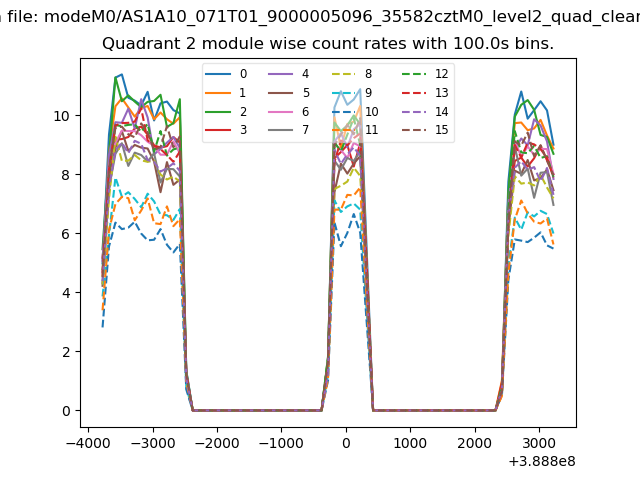
| Module-wise count rates for Quadrant B Data is divided into 100 sec bins |
 |
 |
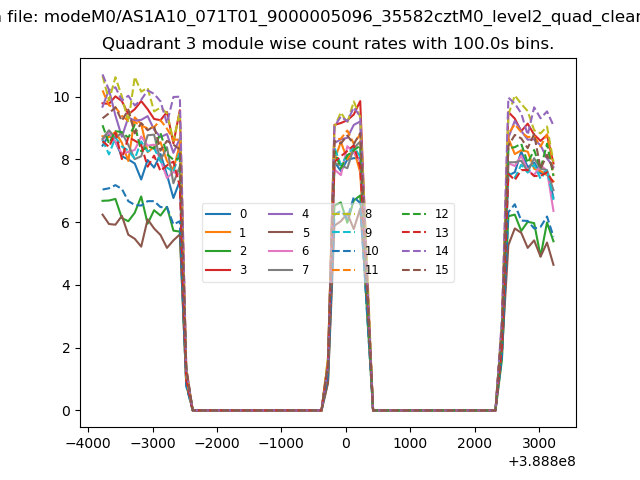
| Module-wise count rates for Quadrant C Data is divided into 100 sec bins |
 |
 |
| Module-wise count rates for Quadrant D Data is divided into 100 sec bins |
 |
 |
| Parameter | Plot |
|---|---|
| CZT HV Monitor | 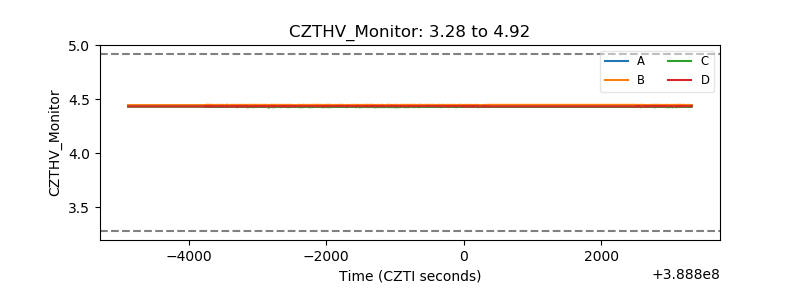 |
| D_VDD | 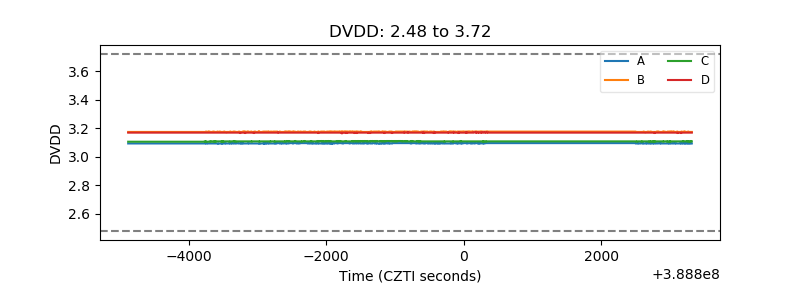 |
| Temperature 1 | 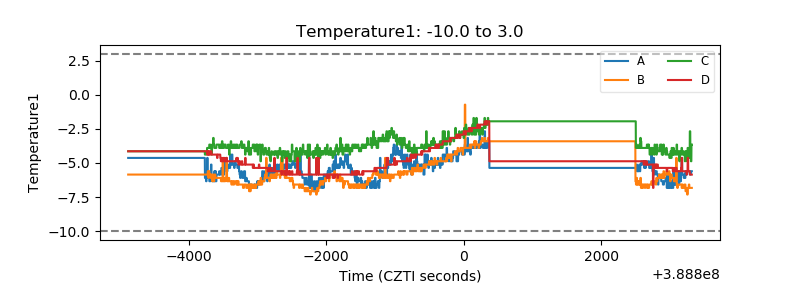 |
| Veto HV Monitor | 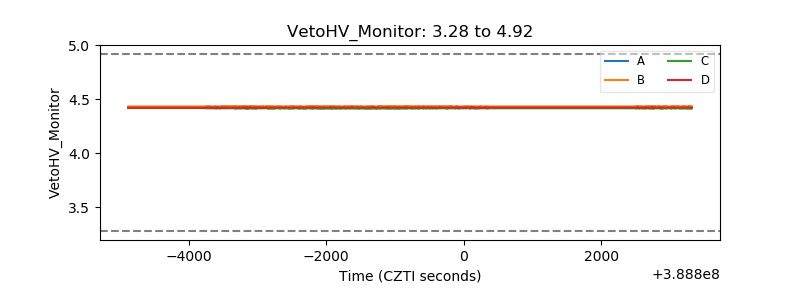 |
| Veto LLD | 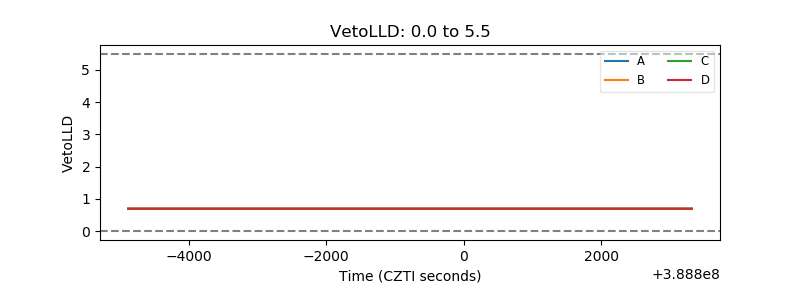 |
| Alpha Counter | 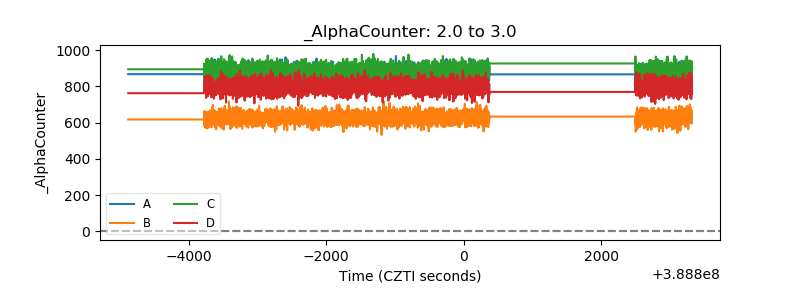 |
| _CPM_Rate | 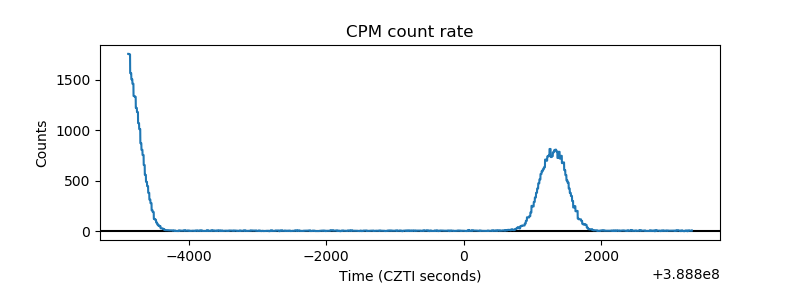 |
| CZT Counter | 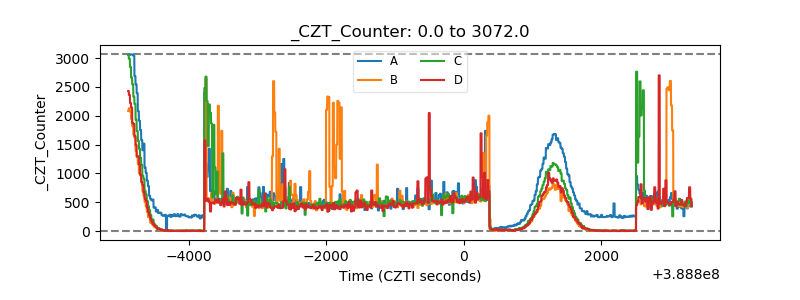 |
| +2.5 Volts monitor | 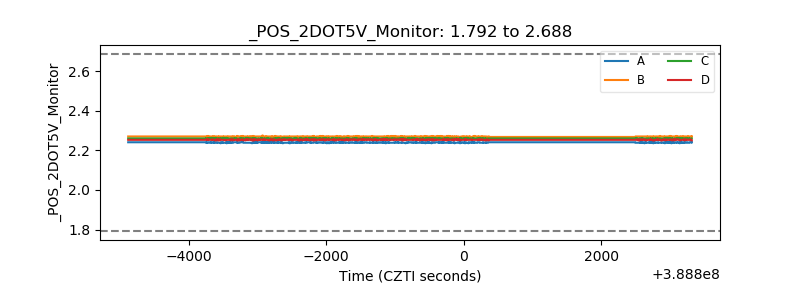 |
| +5 Volts monitor | 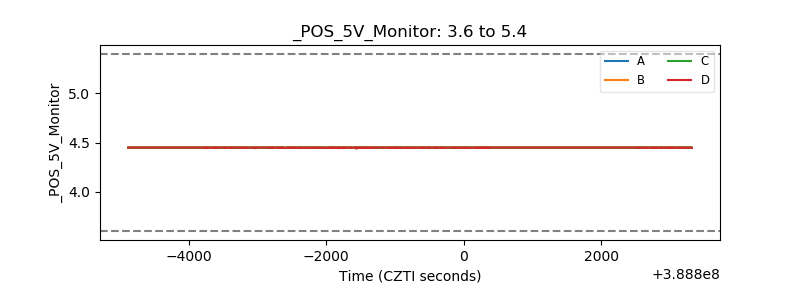 |
| _ROLL_ROT | 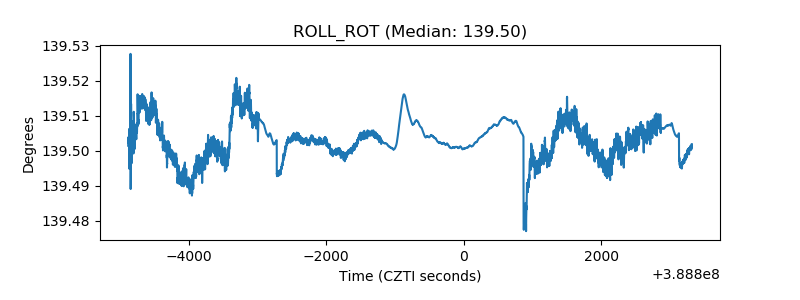 |
| _Roll_DEC | 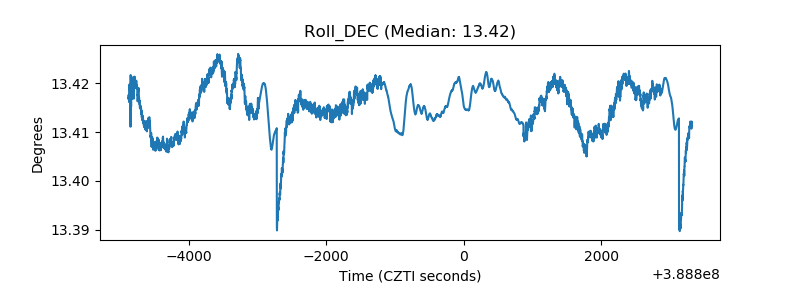 |
| _Roll_RA | 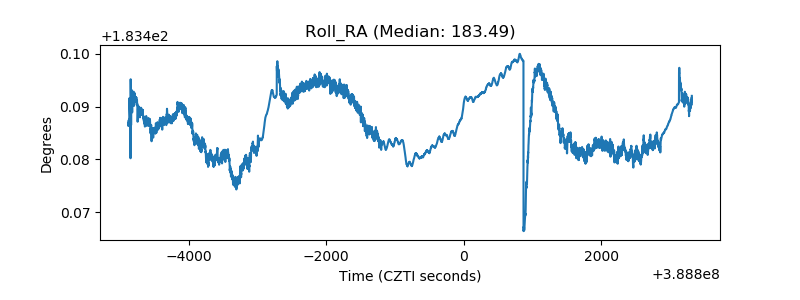 |
| Veto Counter | 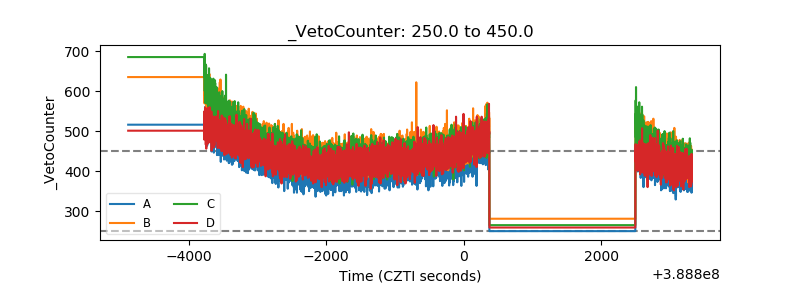 |