| Param | Original file | Final file |
|---|---|---|
| Filename | modeM0/AS1A10_071T01_9000005096cztM0_level2_bc.evt | modeM0/AS1A10_071T01_9000005096cztM0_level2_quad_clean.evt |
| Size (bytes) | 1,756,313,280 | 484,692,480 |
| Size | 1.6 GB | 462.2 MB |
| Events in quadrant A | 12,548,984 | 2,962,084 |
| Events in quadrant B | 13,728,428 | 2,941,364 |
| Events in quadrant C | 11,923,128 | 2,987,019 |
| Events in quadrant D | 12,097,689 | 2,876,582 |
| Mode SS | |||
|---|---|---|---|
| Quadrant | BADHDUFLAG | Total packets | Discarded packets |
| A | 0 | 864 | 0 |
| B | 0 | 864 | 0 |
| C | 0 | 864 | 0 |
| D | 0 | 864 | 0 |
| Mode M9 | |||
|---|---|---|---|
| Quadrant | BADHDUFLAG | Total packets | Discarded packets |
| A | 0 | 165 | 0 |
| B | 0 | 165 | 0 |
| C | 0 | 165 | 0 |
| D | 0 | 165 | 0 |
| Mode M0 | |||
|---|---|---|---|
| Quadrant | BADHDUFLAG | Total packets | Discarded packets |
| A | 0 | 99331 | 0 |
| B | 0 | 109792 | 0 |
| C | 0 | 93223 | 0 |
| D | 0 | 95632 | 0 |
| Quadrant | Total seconds | Saturated seconds | Saturation percentage |
|---|---|---|---|
| A | 42429 | 988 | 2.328596% |
| B | 42429 | 2696 | 6.354145% |
| C | 42429 | 702 | 1.654529% |
| D | 42429 | 404 | 0.952179% |
Noise dominated data is calculated using 1-second bins in cleaned event files. If a bin has >2000 counts, and if more than 50% of those come from <1% of pixels, then it is considered to be noise-dominated and hence unusable.
| Quadrant | # 1 sec bins | Bins with >0 counts | Bins with >2000 counts | High rate bins dominated by noise | Noise dominated (total time) | Noise dominated (detector-on time) | Marked lightcurve |
|---|---|---|---|---|---|---|---|
| A | 58774 | 42436 | 151 | 151 | 0.26% | 0.36% | 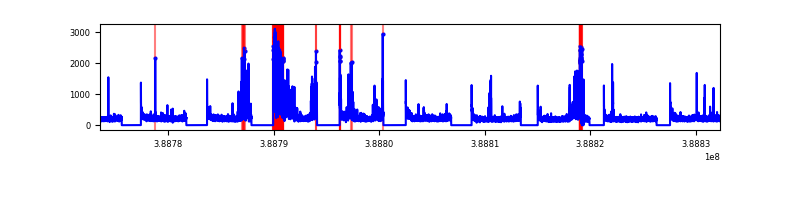 |
| B | 58774 | 42429 | 83 | 83 | 0.14% | 0.20% | 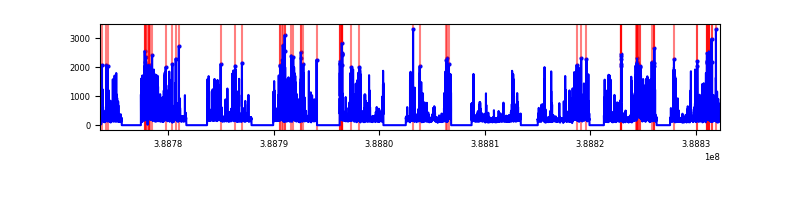 |
| C | 58774 | 42430 | 54 | 54 | 0.09% | 0.13% | 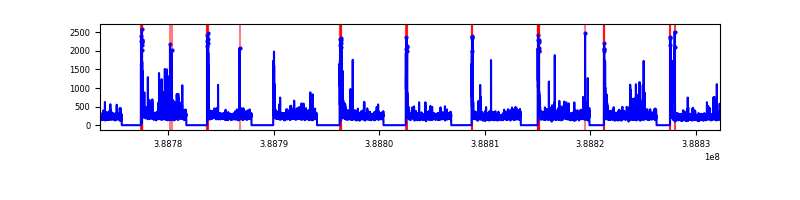 |
| D | 58774 | 42430 | 75 | 75 | 0.13% | 0.18% | 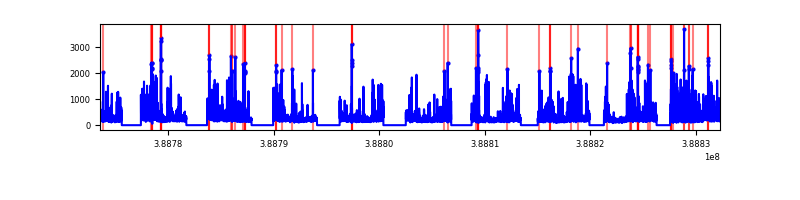 |
Top three noisy pixels from each quadrant. If the there are fewer than three noisy pixels in the level2.evt file, extra rows are filled as -1
| Pixel properties | Quadrant properties | ||||||
|---|---|---|---|---|---|---|---|
| Quadrant | DetID | PixID | Counts | Sigma | Mean | Median | Sigma |
| A | 15 | 169 | 3229763 | 6686.57 | 2184 | 2149 | 482.7 |
| A | 10 | 83 | 774297 | 1599.64 | 2184 | 2149 | 482.7 |
| A | 13 | 6 | 82480 | 166.42 | 2184 | 2149 | 482.7 |
| B | 5 | 172 | 5075340 | 12101.08 | 2164 | 2117 | 419.2 |
| B | 0 | 189 | 120775 | 283.03 | 2164 | 2117 | 419.2 |
| B | 4 | 232 | 114724 | 268.6 | 2164 | 2117 | 419.2 |
| C | 15 | 214 | 1684902 | 3388.01 | 2170 | 2149 | 496.7 |
| C | 0 | 10 | 1558388 | 3133.29 | 2170 | 2149 | 496.7 |
| C | 14 | 67 | 72034 | 140.7 | 2170 | 2149 | 496.7 |
| D | 7 | 80 | 916398 | 1794.07 | 2176 | 2116 | 509.6 |
| D | 8 | 195 | 629323 | 1230.75 | 2176 | 2116 | 509.6 |
| D | 13 | 249 | 424826 | 829.47 | 2176 | 2116 | 509.6 |
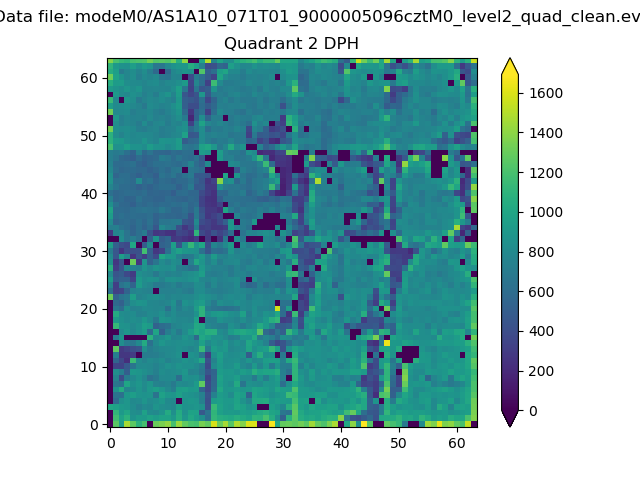
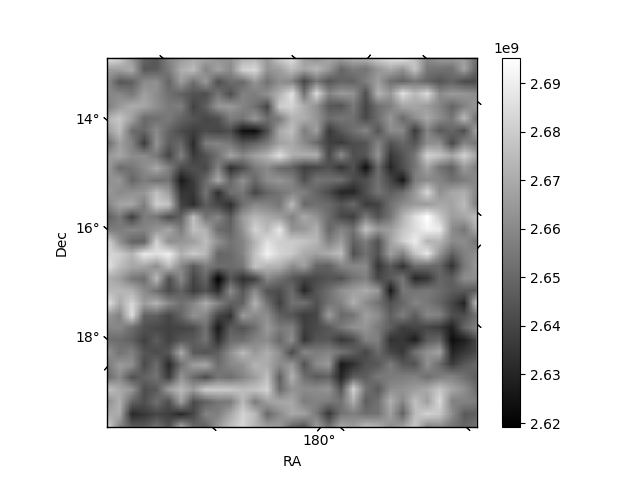
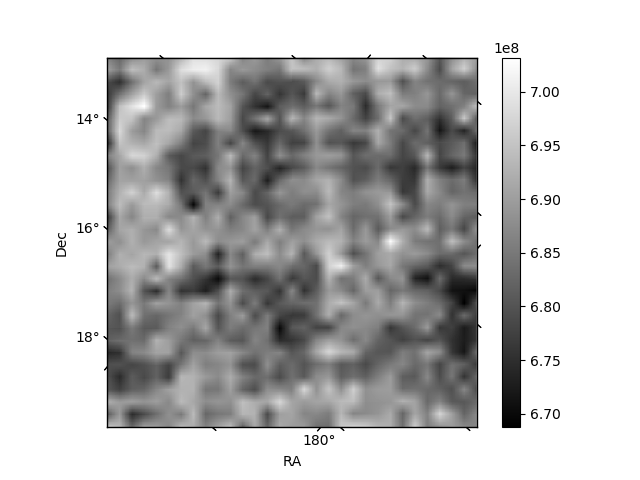
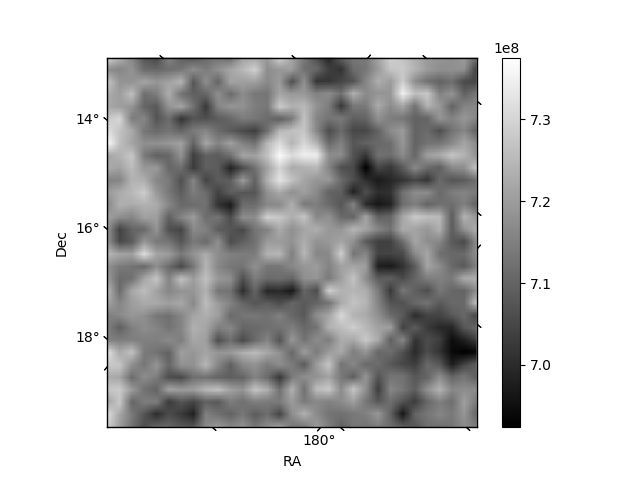
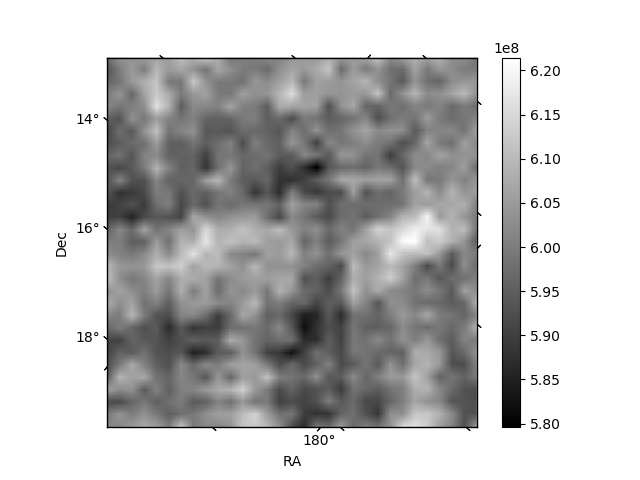
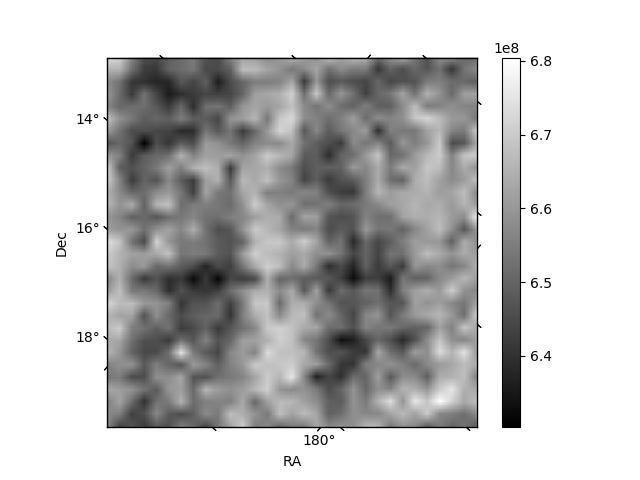
Histogram calculated using DETX and DETY for each event in the final _common_clean file
| Quadrant A | 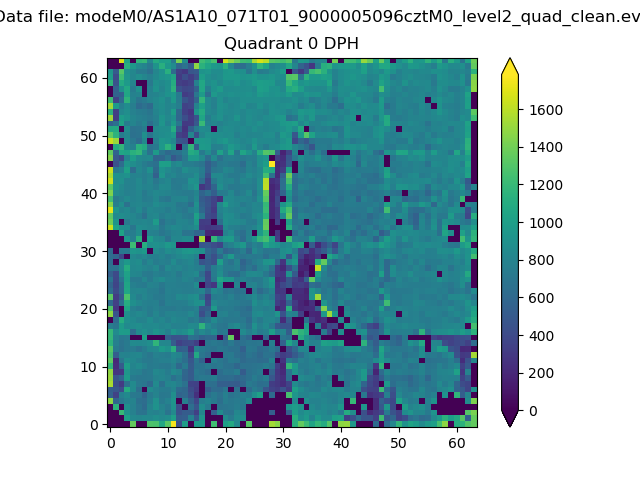 |
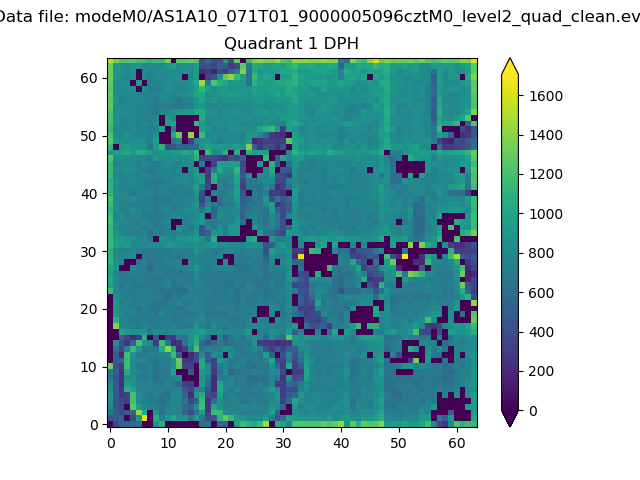 |
Quadrant B |
|---|---|---|---|
| Quadrant D | 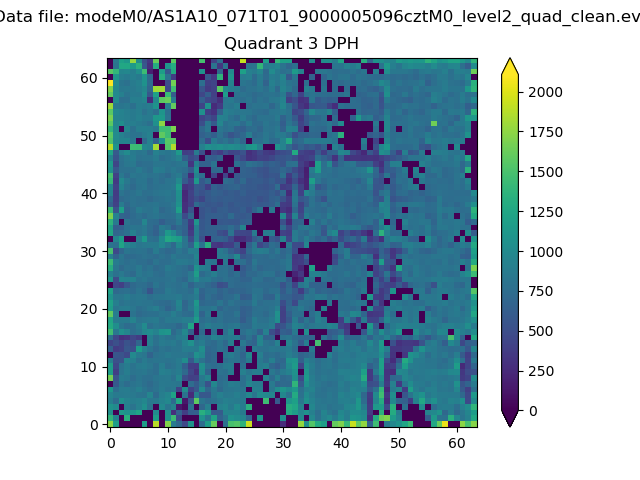 |
 |
Quadrant C |
| Plot type | Count rate plots | Images |
|---|---|---|
| Comparison with Poisson distribution Blue bars denote a histogram of data divided into 1 sec bins. Red curve is a Poisson curve with rate = median count rate of data. |
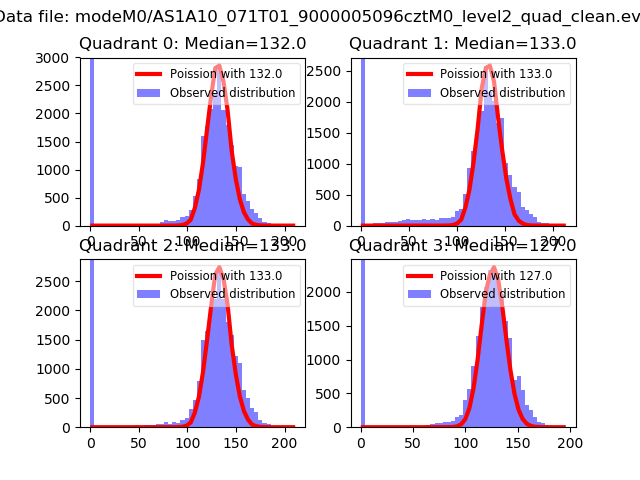 |
 |
| Quadrant-wise count rates Data is divided into 100 sec bins |
 |
|
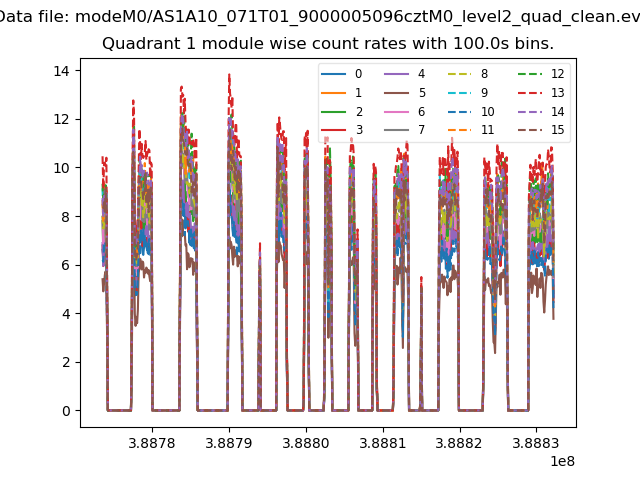
| Module-wise count rates for Quadrant A Data is divided into 100 sec bins |
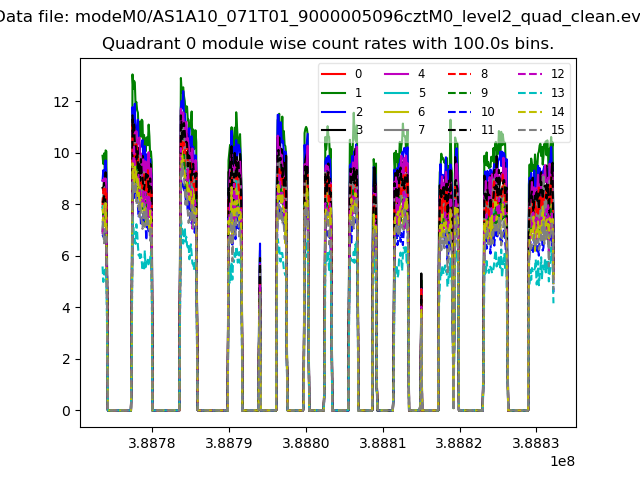 |
 |
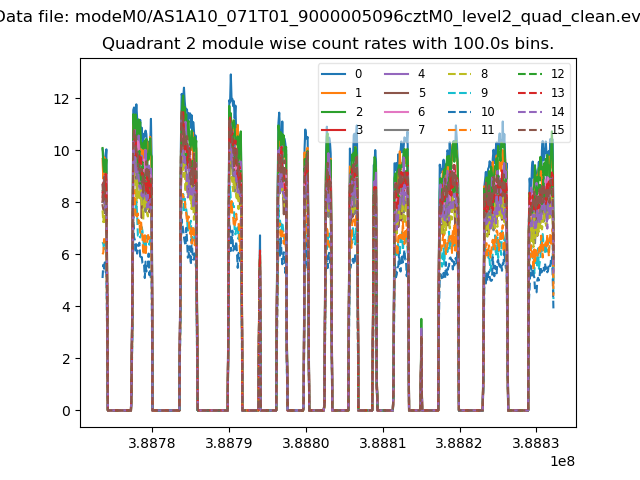
| Module-wise count rates for Quadrant B Data is divided into 100 sec bins |
 |
 |
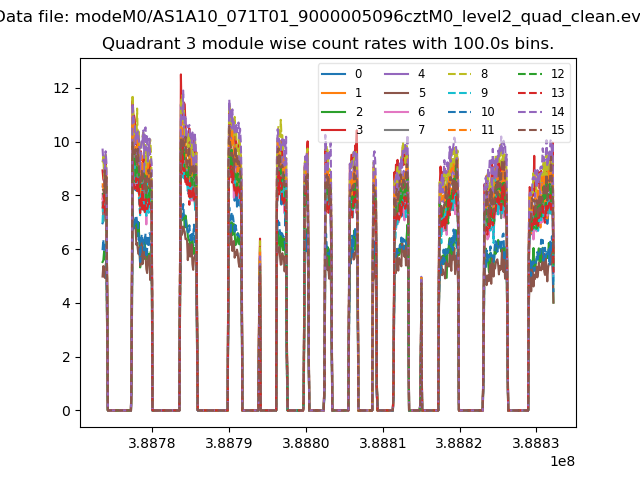
| Module-wise count rates for Quadrant C Data is divided into 100 sec bins |
 |
 |
| Module-wise count rates for Quadrant D Data is divided into 100 sec bins |
 |
 |
| Parameter | Plot |
|---|---|
| CZT HV Monitor |  |
| D_VDD | 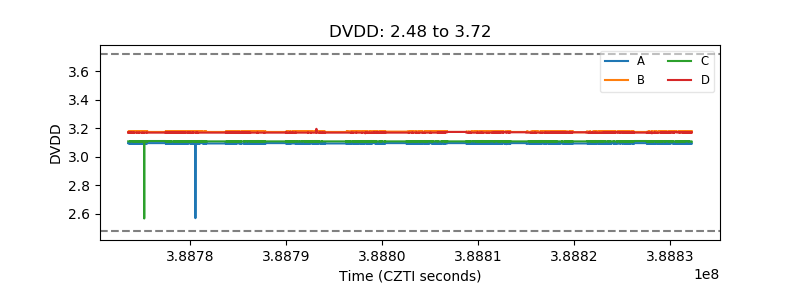 |
| Temperature 1 | 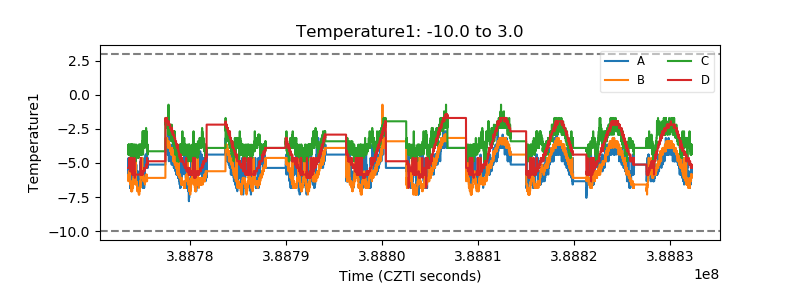 |
| Veto HV Monitor | 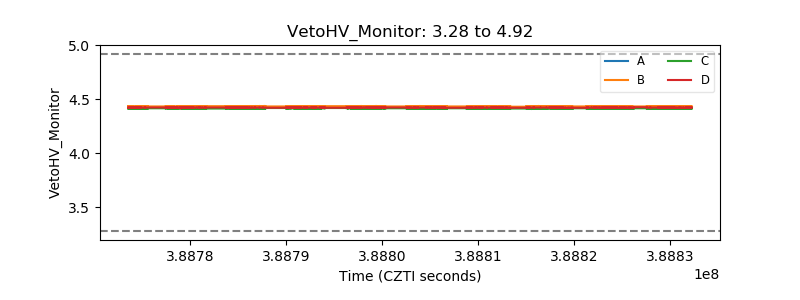 |
| Veto LLD | 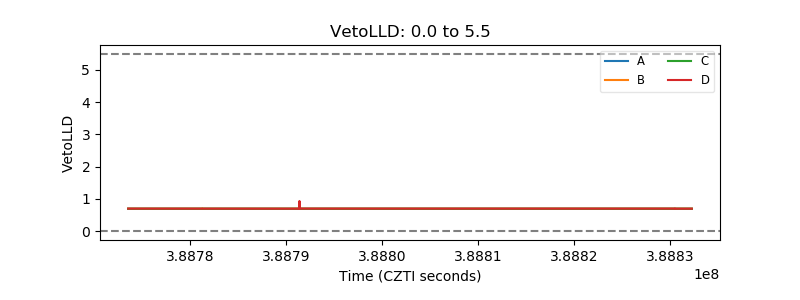 |
| Alpha Counter | 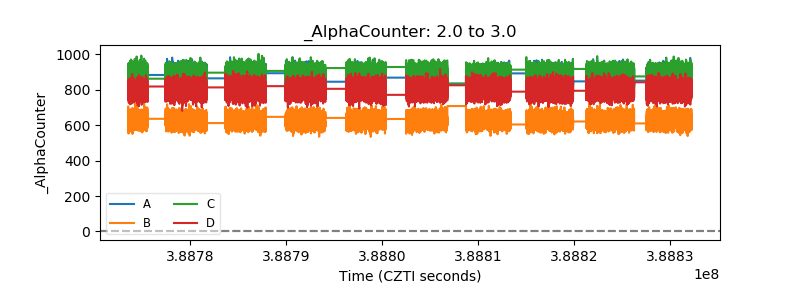 |
| _CPM_Rate | 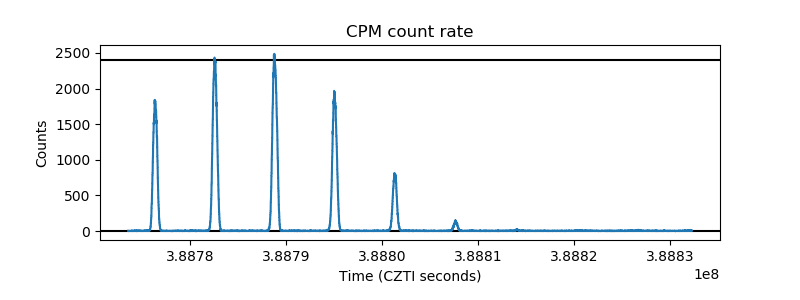 |
| CZT Counter | 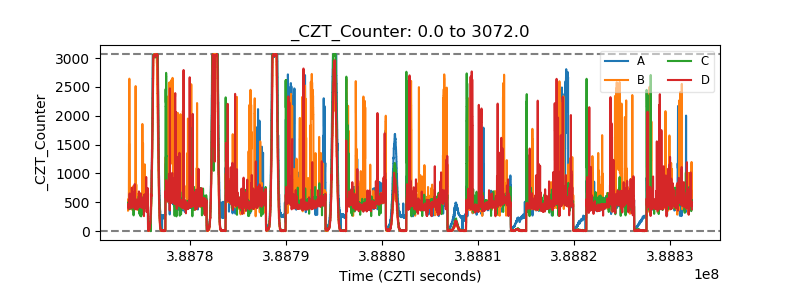 |
| +2.5 Volts monitor | 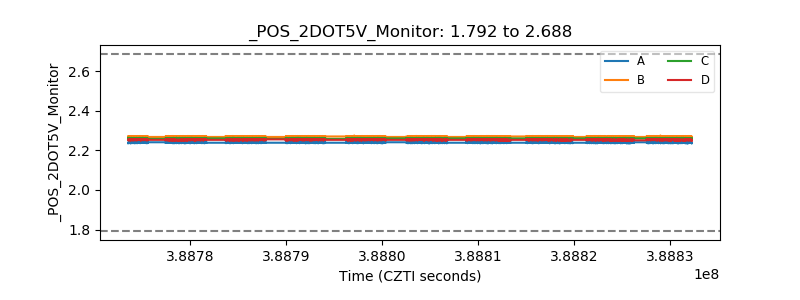 |
| +5 Volts monitor | 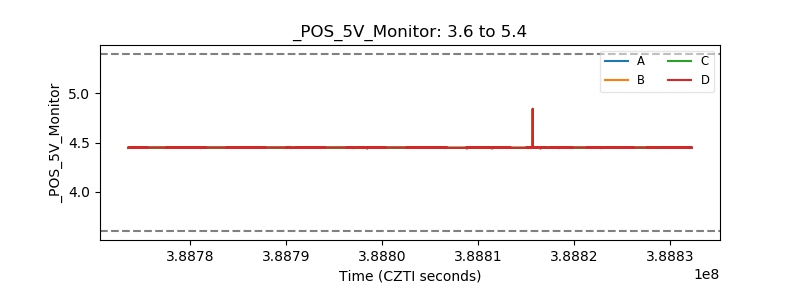 |
| _ROLL_ROT | 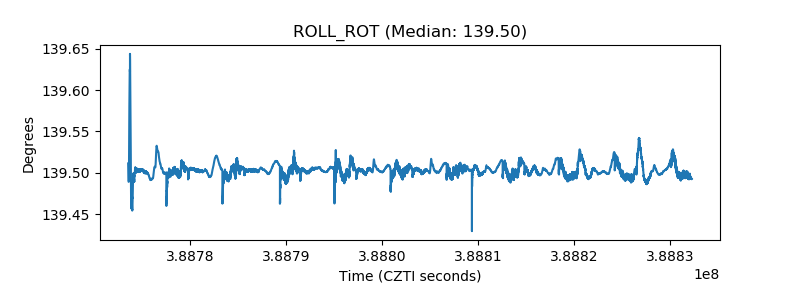 |
| _Roll_DEC | 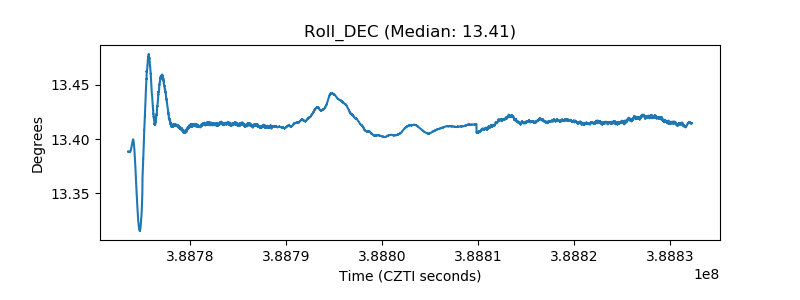 |
| _Roll_RA | 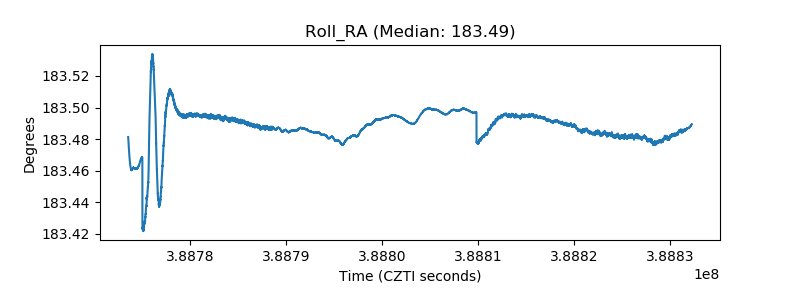 |
| Veto Counter | 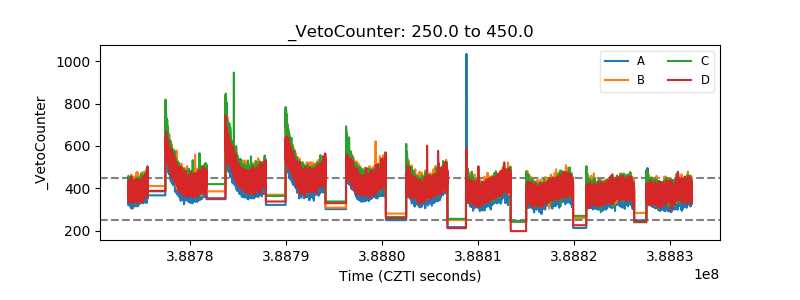 |